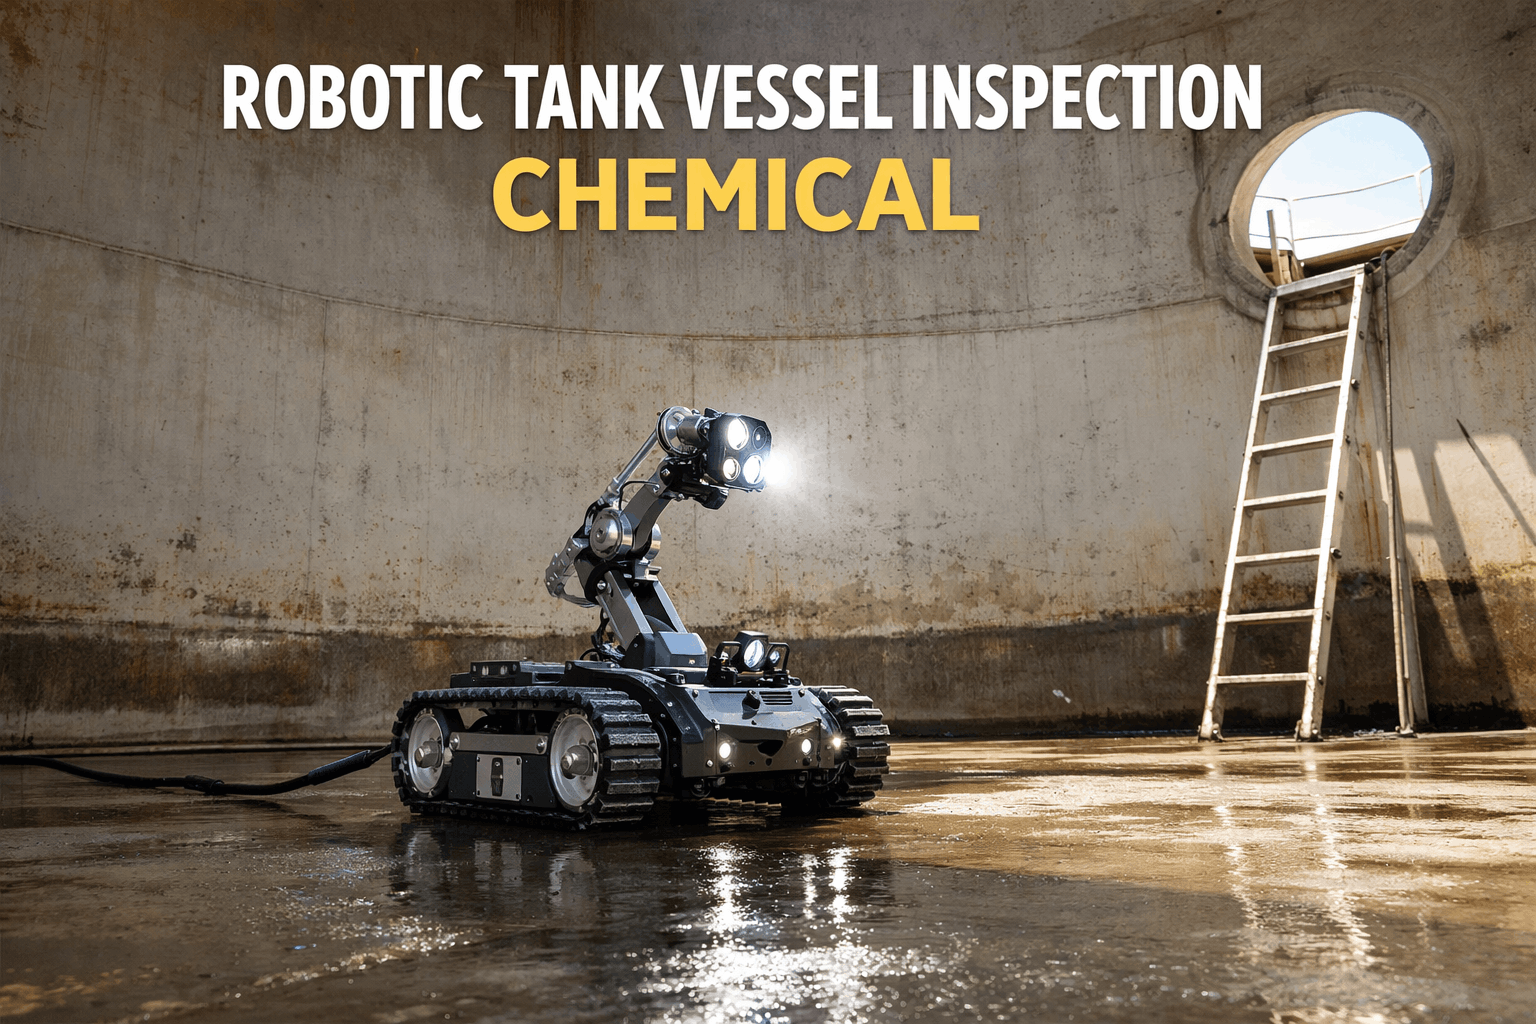
Corrosion is the single largest threat to asset integrity in chemical processing — responsible for an estimated 3.4% of global GDP in direct and indirect losses annually, and the leading root cause of catastrophic containment failures in facilities handling corrosive media. Yet most chemical plants still inspect for corrosion the same way they did thirty years ago: sending technicians with ultrasonic thickness gauges up scaffolding to spot-check a handful of pre-selected grid points on vessels, piping, and structural steel — once a year, sometimes less. Between inspections, corrosion advances invisibly beneath coatings, under insulation, and across surfaces that no human inspector can reach without confined space entry or expensive scaffolding erection. Robotic inspection platforms equipped with visual, thermal, and ultrasonic sensors change this equation fundamentally — covering entire asset surfaces in hours instead of days, detecting coating degradation and wall thinning at resolutions human inspectors cannot match, and feeding every measurement into trend dashboards that predict remaining useful life rather than simply documenting current condition. Book a free demo to see how iFactory's corrosion trend dashboards, coating condition alerts, and inspection frequency scheduler transform corrosion management from periodic spot-checks into continuous, data-driven asset integrity programs.
Robotic Corrosion & Coating Inspection in Chemical Plants Using Visual + Thermal Sensors
Manual spot-checks miss 60–80% of corroding surface area. This guide covers robotic inspection sensor technologies, scheduling best practices, data interpretation methods, and CMMS integration for continuous corrosion trend monitoring across chemical plant assets.
The Difference Between Spot-Check Corrosion Data and Continuous Corrosion Intelligence
A manual ultrasonic thickness reading at a single grid point tells you the wall thickness at that location on that day. It tells you nothing about the 99% of the surface you did not measure, nothing about the corrosion rate between this reading and the last one, and nothing about whether the protective coating three meters away is delaminating and accelerating localized attack in a zone you have never measured. Robotic inspection replaces this sampling approach with comprehensive surface coverage — and iFactory converts that coverage into corrosion rate trends, remaining life predictions, and inspection frequency optimization that manual programs cannot achieve. Book a demo to see iFactory's corrosion trend dashboard with predictive remaining life calculations.
Six Robotic Inspection Capabilities for Chemical Plant Corrosion Management
Each capability below covers the sensor technology, what it detects, the resolution it achieves, how the data integrates with iFactory's corrosion trend dashboards, and when to deploy it. These capabilities can be combined on a single robotic platform or deployed as mission-specific sensor packages depending on the asset type and inspection objective.
Robotic UT scanning replaces the traditional approach of measuring wall thickness at pre-selected grid points with continuous or high-density scanning across the entire accessible surface. Dry-coupled probes eliminate the need for couplant gel application that slows manual inspection. EMAT transducers can measure through thin paint layers without surface preparation. Every reading is GPS-tagged and logged in iFactory's corrosion database with the asset ID, location coordinates, and measurement timestamp — enabling corrosion rate calculation between sequential inspections at every measured point, not just the few grid points that manual inspectors revisit.
Corrosion under insulation is the most dangerous form of hidden corrosion in chemical plants — causing an estimated 40–60% of piping failures in insulated systems. Thermal imaging detects CUI by identifying anomalous heat patterns caused by moisture trapped beneath insulation jacketing. Wet insulation conducts heat differently from dry insulation, creating thermal signatures that a calibrated infrared camera can detect from the exterior surface without removing insulation. Robotic platforms scan entire insulated pipe runs and vessel shells systematically, producing thermal mosaics that iFactory processes into CUI probability maps — highlighting zones where moisture ingress patterns indicate active or developing corrosion beneath the insulation that would be invisible to any external visual inspection.
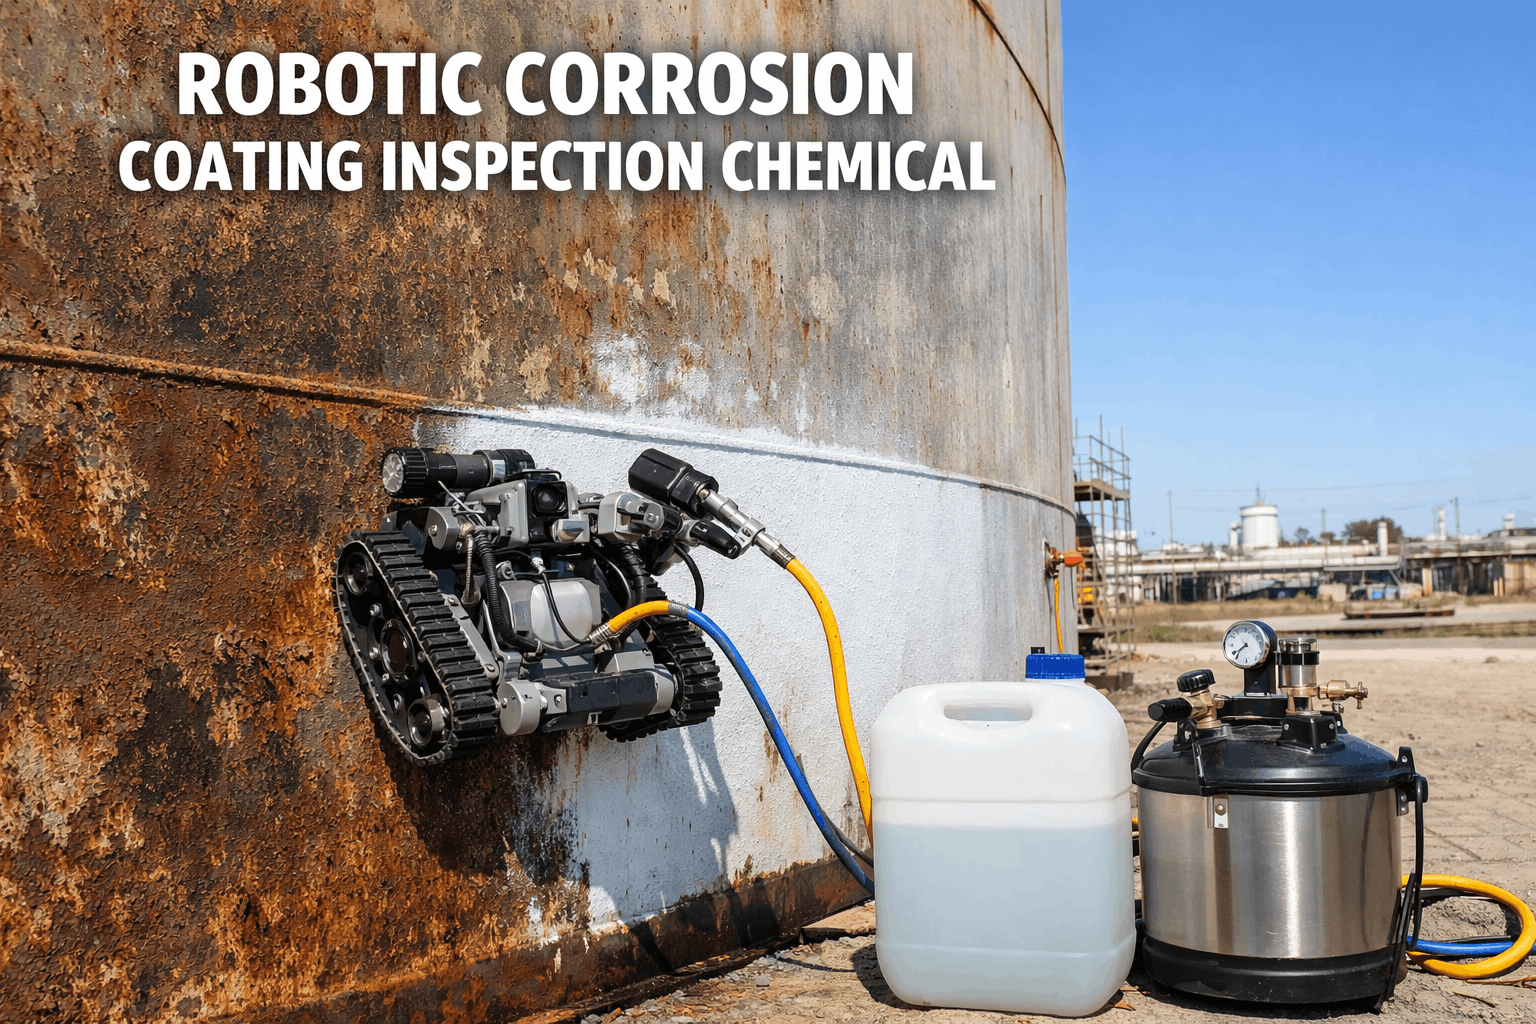
Protective coatings are the first line of defense against corrosion in chemical environments — and the first line to fail. Robotic platforms capture high-resolution imagery of the entire coated surface, and iFactory's AI classification engine grades every square meter against ISO 4628 and ASTM D610 standards for blistering, rusting, cracking, flaking, and chalking. The result is a quantified coating condition map — not a subjective inspector's opinion — that identifies exactly where coating breakdown is occurring, how it compares to the previous inspection, and which areas are advancing toward the rating threshold that triggers recoating. Book a demo to see AI coating classification in iFactory.
Pulsed eddy current is the only widely deployed NDT method that measures remaining wall thickness through insulation, weather jacketing, and coatings without any surface preparation or insulation removal. For chemical plants with thousands of meters of insulated piping, PEC eliminates the enormous cost — and process disruption — of stripping and replacing insulation solely to access the pipe surface for conventional UT measurements. Robotic PEC scanning covers entire insulated pipe runs in a single pass, feeding average wall thickness readings into iFactory's corrosion database at every measurement point. While PEC provides average wall loss rather than pitting-depth resolution, it is the most effective screening tool for identifying insulated piping sections that require targeted follow-up inspection with conventional UT or phased array techniques.
Weld zones in chemical process equipment are the highest-risk locations for stress corrosion cracking, fatigue cracking, and preferential weld metal corrosion. Robotic phased array ultrasonic testing scans weld seams with multi-angle beam steering that produces cross-sectional images of the weld volume — detecting internal flaws, sidewall lack-of-fusion, and crack propagation that single-element UT probes miss. The robotic platform maintains consistent probe pressure, coupling, and scan speed across the entire weld length — eliminating the operator-dependent variability that is the primary source of missed defects in manual PAUT. Every weld scan is stored in iFactory as a retrievable dataset linked to the weld ID, enabling direct comparison between sequential inspections to track flaw growth rates.
Corrosion rate trending is where robotic inspection data becomes genuinely predictive rather than merely descriptive. iFactory's corrosion trend dashboard calculates corrosion rates at every measurement point by comparing sequential robotic scans — producing a spatial corrosion rate map that shows exactly where metal loss is accelerating, decelerating, or stable across the asset surface. Remaining useful life calculations use the measured corrosion rate and the API 510/570 minimum wall thickness formula to predict when each zone will reach its retirement threshold. This prediction drives iFactory's inspection frequency scheduler — automatically adjusting the next inspection interval based on the measured corrosion rate rather than using a fixed calendar cycle. Contact iFactory support to configure corrosion rate trending for your asset register.
iFactory aggregates robotic UT, thermal, visual, PEC, and PAUT inspection data into unified corrosion trend dashboards with automatic remaining life calculations and risk-based inspection scheduling. Contact support to discuss your asset integrity program.
Which Inspection Sensors to Deploy — Based on Your Asset and Corrosion Risk
Not every sensor applies equally to every asset type. Use this matrix to identify the primary and secondary robotic inspection technologies for each asset category in your chemical plant — then configure iFactory's inspection frequency scheduler to match.
We were inspecting our acid storage tank shells with a 24-point manual UT grid once every two years. When we ran the first robotic scan — 3,200 UT readings across the full shell — we found a 1.8mm-deep localized thinning zone between grid points 7 and 8 that our manual program had never detected. The corrosion rate at that zone calculated to 0.4mm/year, which meant we had roughly 3 years of remaining life before reaching minimum wall. Without the robotic scan, we would have discovered it at the next scheduled inspection — when there would have been less than 12 months of remaining life and zero flexibility for planned intervention. iFactory's trend dashboard now tracks 14 tanks with sequential robotic scan data, and our inspection intervals are driven by measured corrosion rates rather than a fixed calendar. Two tanks moved to annual inspection; eight moved to 30-month cycles because the data showed they were corroding slower than we assumed.
Robotic Corrosion Inspection — FAQs
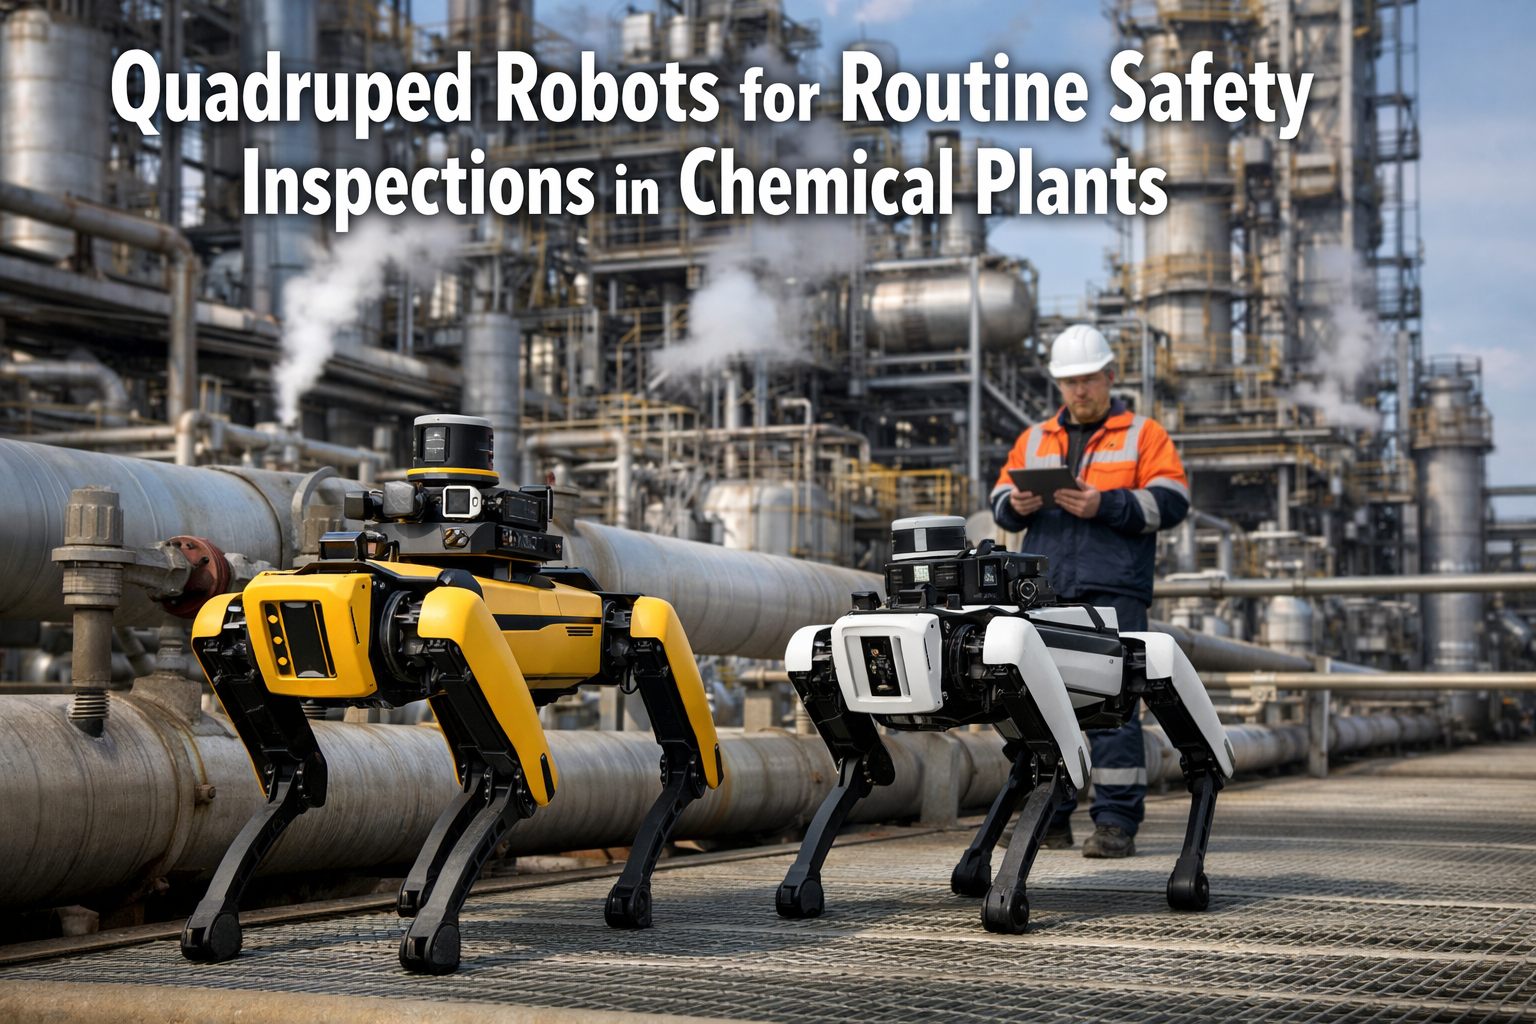
What types of robots are used for corrosion inspection in chemical plants?
How does iFactory's inspection frequency scheduler work?
Can robotic inspection data satisfy API 510, 570, and 653 compliance requirements?
What is corrosion under insulation (CUI) and why is it so difficult to detect?
Stop Guessing Where Your Assets Are Corroding. Start Measuring Everywhere.
iFactory aggregates robotic UT, thermal, visual, PEC, and PAUT inspection data into unified corrosion trend dashboards — with automatic corrosion rate calculation, remaining life prediction, risk-based inspection scheduling, and coating condition alerts across your entire chemical plant asset register.