Every manufacturer wants higher output, lower costs, and fewer surprises on the shop floor. But most are still making decisions based on yesterday's data — shift summaries, morning reports, and operator logs...
See every machine, every line, every shift — live. Track OEE, eliminate downtime, optimize throughput, and turn shop floor data into production intelligence.
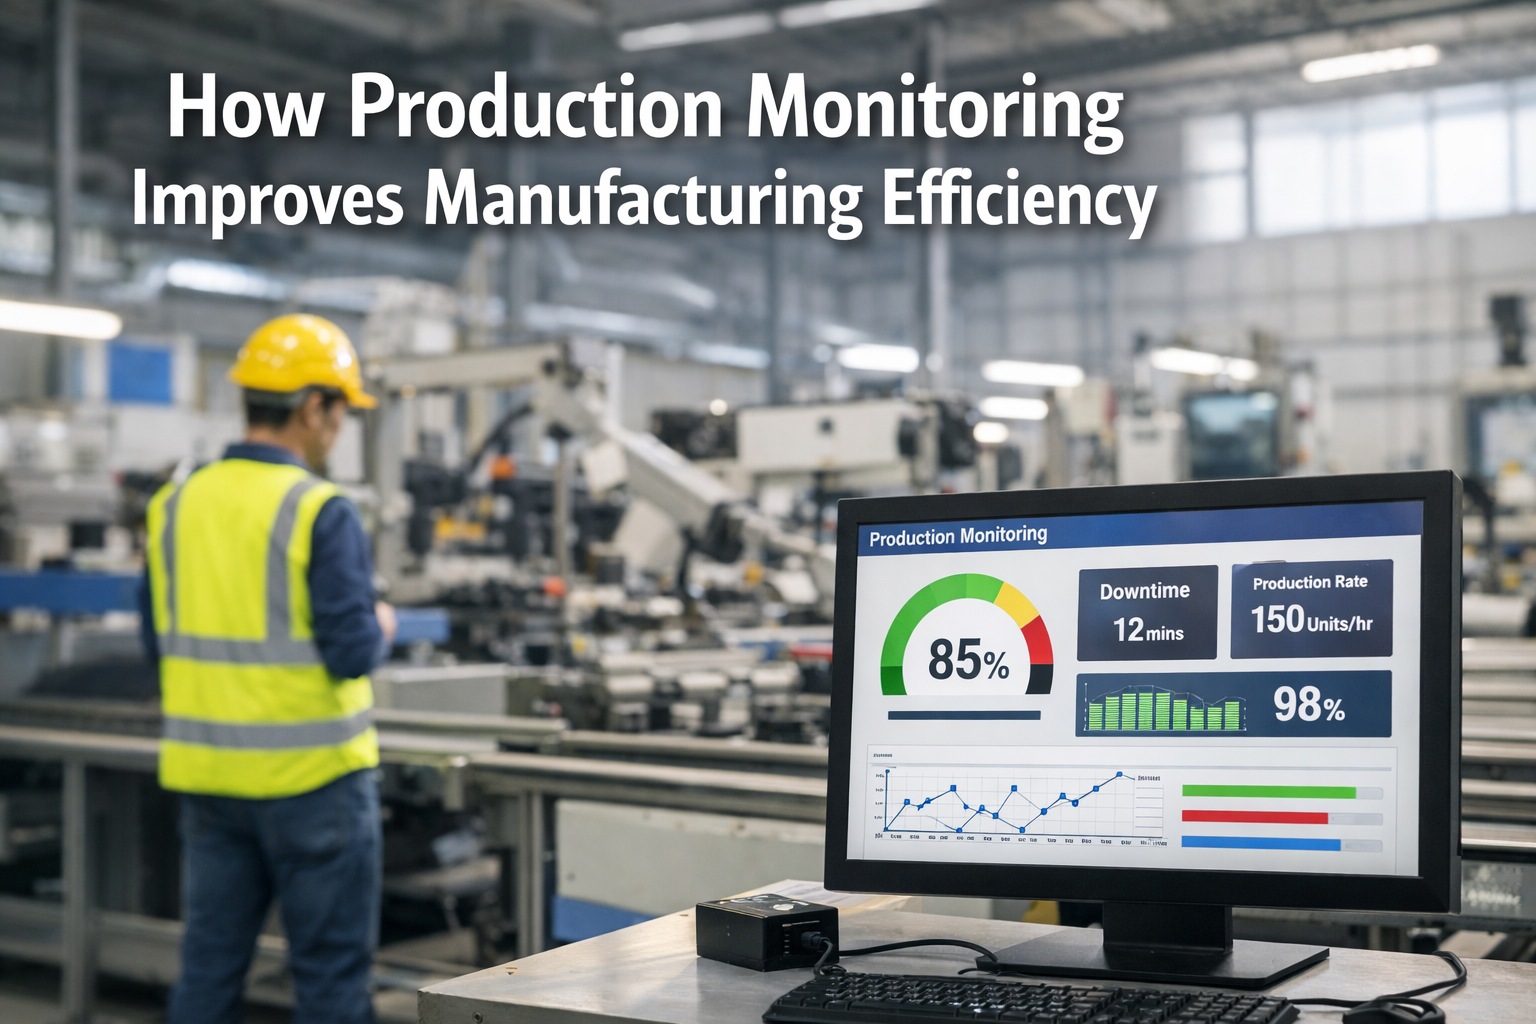
Production monitoring captures real-time data from every machine, line, and operator — transforming raw signals into actionable intelligence that drives efficiency, quality, and profitability.
World-class OEE is 85%+. The average manufacturer operates at just 60% — losing 40% of productive capacity.
iFactory transforms every machine signal into real-time visibility and AI-powered insights — in four simple steps.
IoT sensors, PLCs, and OPC-UA connectors capture data from every machine — including legacy equipment.
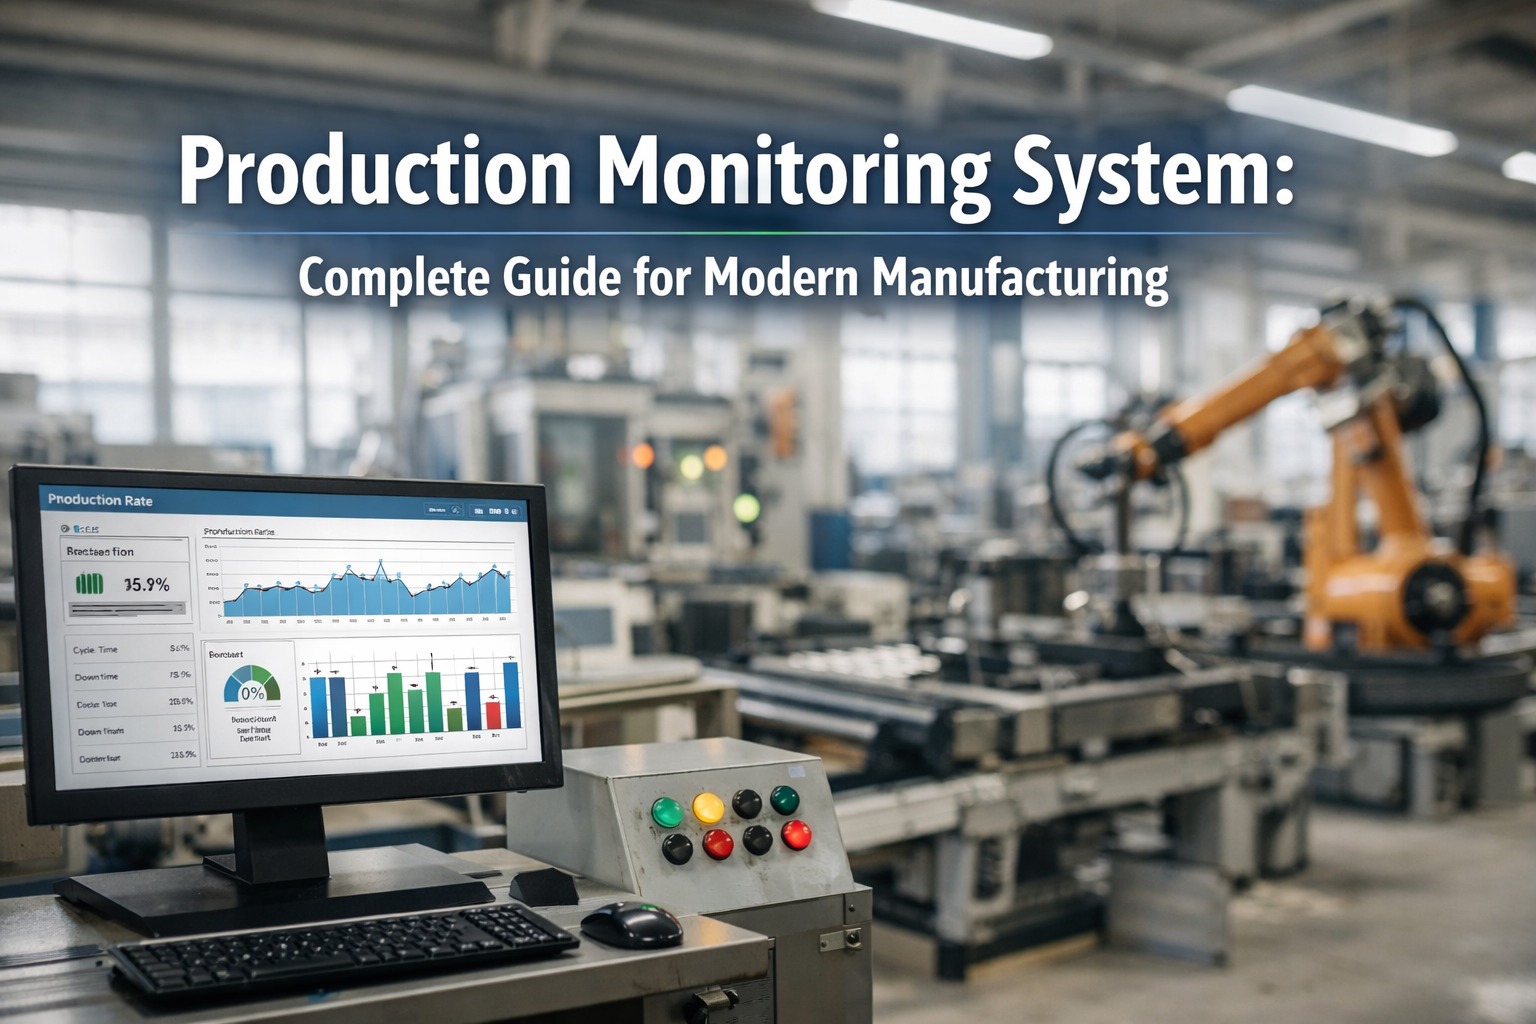
Real-time dashboards display OEE, output rates, downtime, and quality KPIs for every line and shift.
Instant alerts on anomalies, speed losses, and quality deviations. AI identifies root causes automatically.
AI trends, Pareto analysis, and benchmarking drive continuous improvement across all plants.
Monitor every production line, every machine, every shift — all in real time. Auto-calculated OEE, live output counters, and instant performance alerts keep your floor running at peak.
Availability × Performance × Quality — calculated live.
Large-screen displays with live OEE, targets, and alerts.
Compare OEE, output, and quality across shifts and teams.
Monitor production from anywhere — iOS, Android, web.
Automatically capture every downtime event — planned and unplanned. AI categorizes root causes, builds Pareto charts, and recommends corrective actions to eliminate recurring losses.
Sensors detect stops instantly — no manual input needed.
Top downtime causes ranked by duration and frequency.
ML models correlate patterns to identify hidden causes.
Capture small stops under 5 min that add up to big losses.
Continuous quality tracking per product, line, and operator. AI detects quality drifts instantly, triggers alerts, and correlates defects to machine parameters for rapid root cause.
Track good parts vs. total — per product and machine.
Statistical Process Control with auto control limits.
AI detects quality drift before defects exceed threshold.
Trace every defect to machine, batch, operator, and shift.
Go beyond dashboards. AI analyzes weeks of production data to uncover hidden patterns, predict bottlenecks, forecast output, and recommend process optimizations.
OEE, throughput, and quality trends over days to months.
Predict output, completion times, and capacity gaps.
Compare shifts, lines, products, and plants side-by-side.
Auto-generated shift, daily, and weekly reports via email.
From legacy equipment to modern PLCs — iFactory connects to virtually any machine. Plus seamless ERP, MES, and SCADA integration for a unified production ecosystem.
Purpose-built dashboards, KPIs, and compliance workflows for your specific industry — from automotive to food & beverage.
Takt time tracking, line balancing, and weld quality monitoring. 22% of production monitoring adoption is automotive.
SMT line monitoring, pick-and-place speed tracking, and solder quality inspection with AI vision integration.
Batch tracking, temperature monitoring, and HACCP compliance with full lot traceability and label verification.
GMP-compliant production monitoring with batch record automation, environmental monitoring, and FDA audit trails.
AS9100 compliant production tracking with full part traceability, tool life monitoring, and process parameter logging.
Continuous process monitoring for steel, chemicals, and cement. Energy optimization and emission tracking built in.
Every manufacturer wants higher output, lower costs, and fewer surprises on the shop floor. But most are still making decisions based on yesterday's data — shift summaries, morning reports, and operator logs...
Right now, on your shop floor, machines are running below rated speed, micro-stoppages are compounding into hours of lost output, and quality deviations are forming before any alarm goes off. You won't see it in...
Manufacturers using iFactory see results within weeks — not months. Real data from real production floors across 45 countries.
OEE Improvement
Less Downtime
Cost Reduction
Fewer Defects
"We saw a 29% improvement in production efficiency within the first week. Real-time OEE displays on the floor transformed operator behavior instantly."
— John Davis, Operations Director
"Quality monitoring caught a drift pattern that would have produced 10,000+ defective units. The AI correlation to machine parameters was game-changing."
— Sarah Martinez, Quality Manager
"Throughput increased 40% in 6 months. The downtime Pareto analysis showed us that 80% of our losses came from just 3 root causes we never tracked before."
— Michael Roberts, Plant Manager
Average Payback Period: 8–10 Months • Most manufacturers break even within the first year.
Production monitoring software tracks and analyzes manufacturing processes in real-time — capturing machine data, cycle times, output rates, downtime events, and quality metrics. It automatically calculates OEE (Overall Equipment Effectiveness), identifies bottlenecks, and provides actionable insights to optimize production efficiency and reduce waste. iFactory adds AI-powered root cause analysis and predictive intelligence.
OEE (Overall Equipment Effectiveness) measures manufacturing productivity by combining three factors: Availability (actual run time vs. planned time), Performance (actual speed vs. ideal speed), and Quality (good parts vs. total parts). World-class OEE is 85%+. The average manufacturer operates at just 60% — meaning 40% of productive capacity is lost to downtime, speed losses, and defects. iFactory tracks OEE in real-time and helps close that gap.
Most manufacturers see 15–20% efficiency improvement within the first week just from real-time visibility and floor scoreboards. Within 3–6 months, expect 35% OEE improvement, 45% downtime reduction, and 25% quality improvement. Average payback period is 8–10 months with 200%+ ROI in the first year.
Yes. iFactory connects to virtually any machine — modern PLCs via OPC-UA, MQTT, Modbus, Ethernet/IP, and PROFINET, as well as legacy equipment using retrofit IoT sensors (vibration, current, proximity, photoelectric). Even manual stations can be tracked with operator input tablets. No machine is too old to monitor.
Production monitoring focuses on real-time tracking of machine performance, OEE, downtime, and quality metrics. MES (Manufacturing Execution System) is broader — managing work orders, scheduling, material tracking, and production execution. iFactory combines both capabilities, giving you real-time monitoring intelligence within a full MES platform. You get one unified system instead of multiple disconnected tools.
Yes. Pre-built connectors for SAP, Oracle, Microsoft Dynamics, and other major ERP systems via REST APIs. SCADA integration via OPC-UA provides bi-directional data flow. Production data flows seamlessly between shop floor and enterprise systems for unified planning, scheduling, and financial reporting.
Absolutely. iFactory supports large-screen floor scoreboards (Andon boards) that display real-time OEE, output vs. target, downtime alerts, and shift performance. Operators and supervisors see live data at all times — driving immediate accountability and faster response to production issues. Research shows that simply adding visible production displays improves efficiency by 15–29%.
The global production monitoring market reached $6.47 billion in 2025 and is projected to grow to $9.95–12.24 billion by 2030–2034 at a 7–9% CAGR. Automotive leads adoption at 22% market share, with healthcare and food & beverage growing fastest. Only 16% of manufacturers have real-time shop floor visibility today — meaning the opportunity for competitive advantage is enormous.
Join 500+ factories using iFactory production monitoring. Schedule a free 30-minute demo — we'll show you real-time OEE tracking, downtime analysis, and AI insights using your industry scenarios.