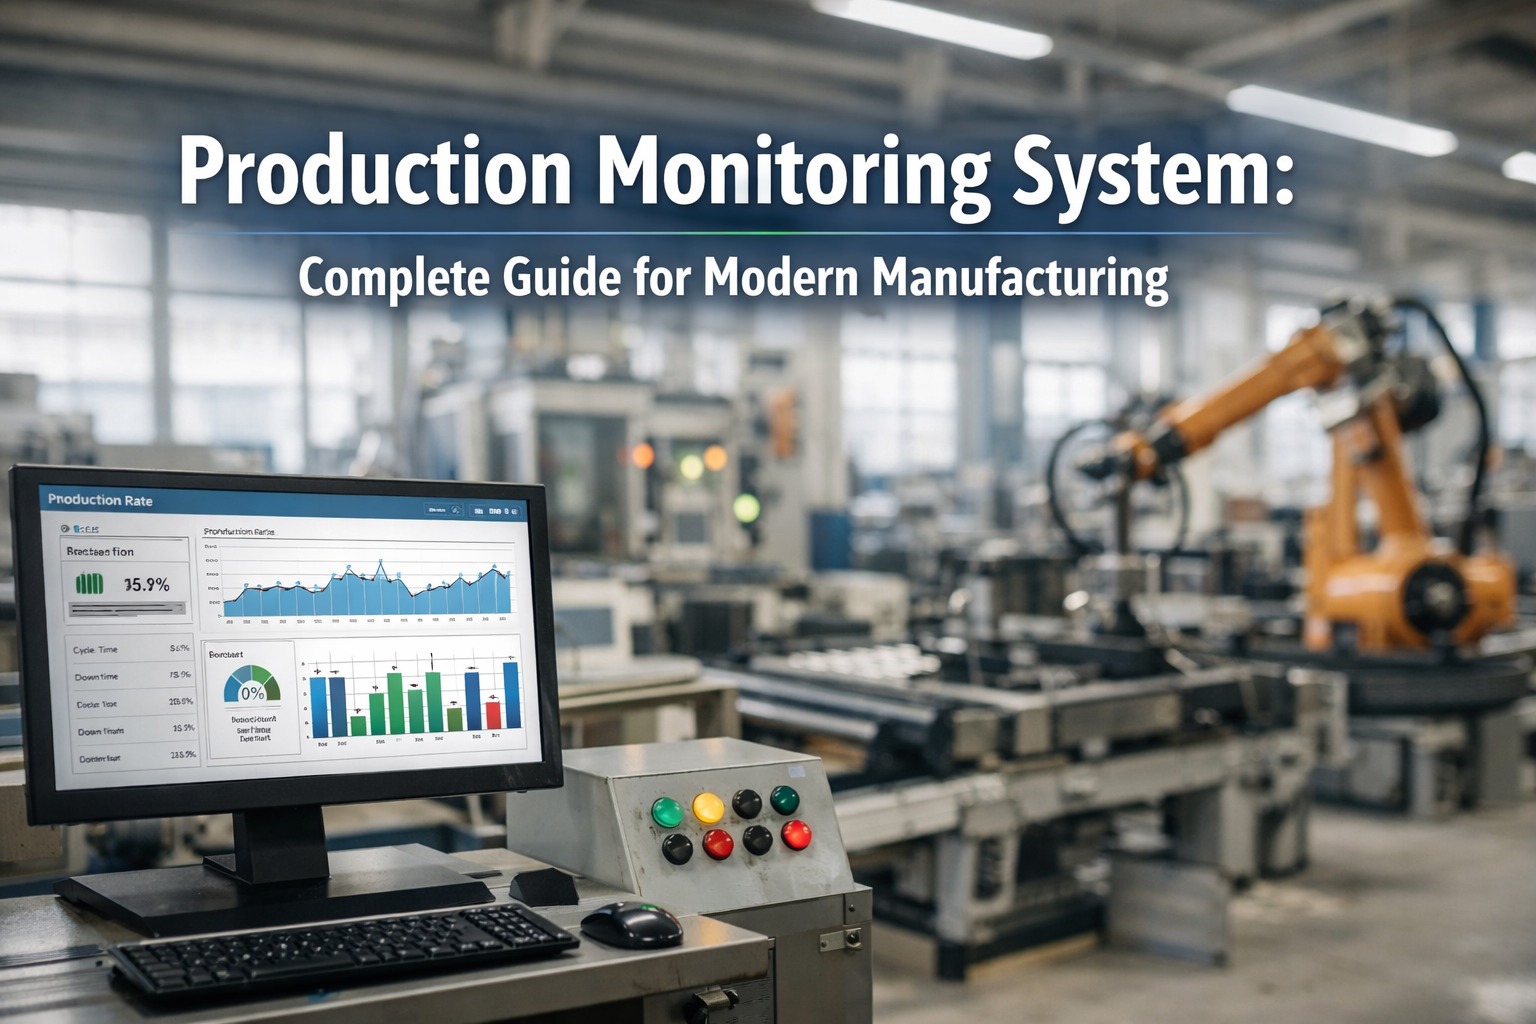
Every manufacturer wants higher output, lower costs, and fewer surprises on the shop floor. But most are still making decisions based on yesterday's data — shift summaries, morning reports, and operator logs assembled hours after the losses already happened. Production monitoring changes the fundamental equation: instead of explaining why efficiency dropped last shift, your team acts on live data to prevent efficiency from dropping this one. Here is exactly how production monitoring software closes the gap between the factory you think you're running and the one you actually are.
The Real Cost of Running Without Live Production Data
Before examining how monitoring improves efficiency, it helps to quantify what poor visibility actually costs. The losses are larger — and more recoverable — than most operations managers realise. See how iFactory reveals your facility's hidden losses in a free 30-minute live demo →
Equipment failures that weren't predicted, weren't caught early, and whose root causes were never properly documented because no real-time record was made when they happened.
Extended changeovers that aren't measured against standard time, never analysed for variation, and whose best-practice completion times aren't replicated across operators and shifts.
The invisible losses — 2–5 second micro-stoppages, slightly slow cycle times — that never trigger an alarm but compound into hours of missing output per shift when left untracked.
Process drift that goes undetected until an operator or inspector catches a bad batch — by which point hundreds or thousands of defective units have already been produced.
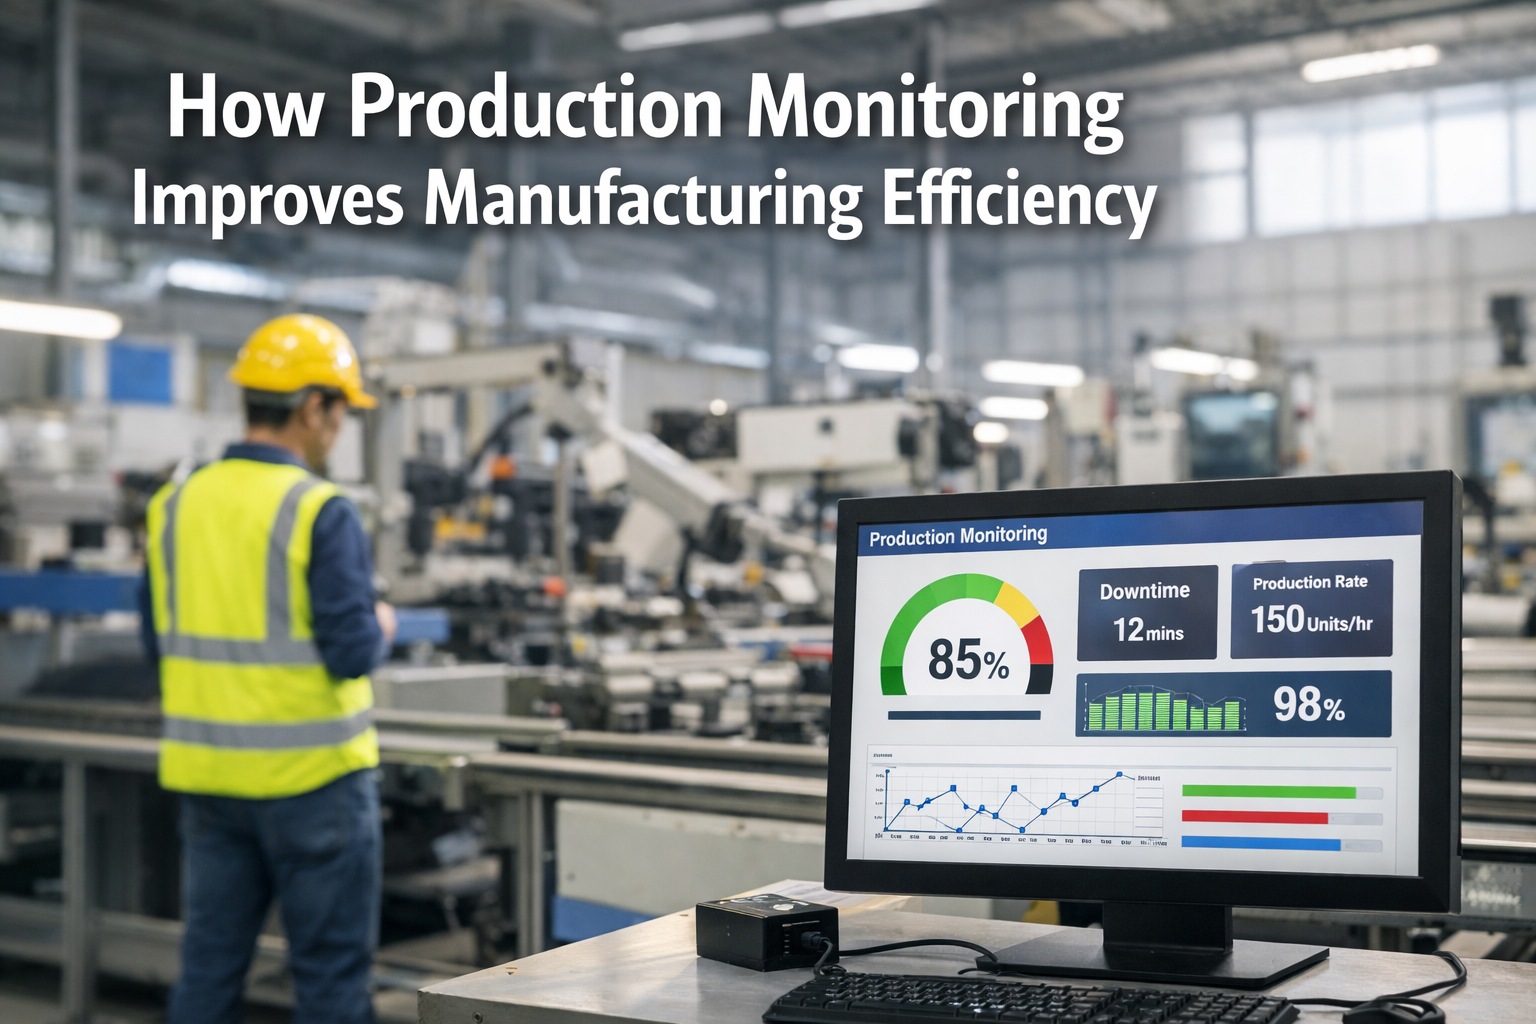
6 Ways Production Monitoring Directly Improves Manufacturing Efficiency
Each improvement mechanism below is directly linked to a specific data capability that real-time production monitoring software delivers. These are not theoretical benefits — they are the specific changes that generate the 15–30% productivity gains McKinsey reports for manufacturers deploying digital production monitoring.
Downtime Events Are Captured and Categorised the Moment They Happen
In a traditional environment, a 45-minute stoppage is logged as "breakdown" at shift end — no machine context, no fault code, no sequence of events. iFactory captures every stop with a timestamp, prompts the operator for a reason code within 60 seconds, and records the prior sensor readings that preceded the event. Over weeks, this data builds a Pareto of your actual downtime causes — not what people remember, but what actually happened. Teams with this data eliminate their top-three downtime causes within 90 days because they can finally see what they are.
Speed Losses Are Flagged Before They Accumulate Into Missed Shift Targets
A machine running at 92% of its rated speed looks fine from across the floor. Over an 8-hour shift, that 8% speed loss removes roughly 38 minutes of full-rate output — hundreds of units, completely silently. iFactory compares actual cycle time against the ideal cycle time for every single part produced, and alerts operators in real time when performance drops below a configurable threshold. The operator corrects the cause — worn tooling, inconsistent material, a jammed guide — before the gap becomes a missed order. Speed loss recovery consistently delivers the fastest throughput gain of any monitoring intervention.
Process Drift Triggers an Alert Before an Entire Batch Is Defective
Quality problems in manufacturing almost always develop gradually — a temperature setpoint drifts, tooling wears incrementally, an upstream process introduces dimensional variation. Without real-time monitoring, this drift continues undetected until an operator notices visually or a downstream inspection catches a bad batch. iFactory monitors process parameters against statistical control limits continuously, and flags drift the moment it exceeds acceptable bounds — before any defective parts leave the station. Defect rates drop not because of better inspection, but because problems are caught and corrected while they're still small.
Machine Health Data Predicts Failures Weeks Before They Stop Production
iFactory's sensor layer monitors vibration signatures, motor current draw, thermal patterns, and pressure readings from every connected asset. AI models trained on failure data identify the specific patterns — subtle harmonic shifts, gradual current increases, thermal asymmetry — that precede known failure modes. When these patterns appear, iFactory generates a predictive maintenance work order days or weeks before the machine would have failed mid-production. Automotive manufacturers who deployed predictive analytics reduced unplanned breakdowns by up to 70%, recovering production time previously lost to emergency repairs and unplanned maintenance windows.
Shift-to-Shift Performance Gaps Are Identified and Closed Systematically
In most facilities, shift A and shift C run the same machines, the same products, the same materials — and produce noticeably different output. Nobody knows why because nobody has consistent, comparable data across both shifts. iFactory makes this gap visible by producing identical OEE, downtime, and cycle time reports for every shift, every line, every day. When one shift consistently outperforms on changeover time, that procedure becomes the documented standard for all shifts. Best-practice knowledge that previously lived in the heads of experienced operators becomes a measurable, transferable process embedded into work order instructions.
Resource Consumption Is Tied to Actual Output — Waste Becomes Visible
IoT-enabled production monitoring can reduce production costs by 10–30% by making resource consumption visible at the machine and product level. Energy consumed per unit, compressed air usage per cycle, tooling consumed per thousand parts — iFactory surfaces all of this against actual good-part output. Facilities that appear to be running efficiently at the macro level often discover specific machines, shifts, or product changeovers where cost-per-unit spikes significantly. Without monitoring, these inefficiencies are invisible in aggregate financial reporting. With iFactory, they become addressable line items with a measurable cost and a specific operator or process attached.
What "Improved Efficiency" Looks Like in Real Numbers
Efficiency gains from production monitoring are not abstract percentages — they translate directly into output volume, cost reduction, and competitive margin. Here is what a mid-size discrete manufacturer typically realises in the 12 months after deploying iFactory across a single production line:
| Metric | Before iFactory | After 12 Months | Business Impact |
|---|---|---|---|
| OEE Score | 62% | 79% | +85 units/hour additional output — no new equipment |
| Unplanned Downtime | 18 hrs/month | 5.4 hrs/month | 12.6 hours of recovered production time monthly |
| Defect Rate | 3.2% | 1.1% | 65% fewer defects — scrap and rework cost slashed |
| Reactive Maintenance % | 71% | 26% | Emergency repair costs drop 50–60% year over year |
| Report Generation Time | 3–4 hours/day | Automated | Management time redirected to improvement projects |
| Cost Per Unit | Baseline | −18–24% | Lower cost base improves margin on every unit shipped |
Industry-Specific Efficiency Gains from Production Monitoring
The efficiency improvement from production monitoring varies by industry — driven by the specific mix of downtime causes, quality requirements, and production complexity each sector faces. Here's where iFactory delivers the strongest impact: Get a demo tailored to your industry — book 30 minutes with an iFactory manufacturing specialist →
See iFactory's Production Monitoring Live — On Your Actual Equipment
In 30 minutes, iFactory's engineering team connects to your production environment, shows you live OEE and downtime data, and calculates the throughput and cost savings your facility stands to gain. No slides. No generic demos. Your machines, your lines, your numbers.