Injection molding runs at high cadence where every second of cycle time and every gram of material affect margin. Process analytics connects press controllers, vision inspection, and energy meters into a unified...
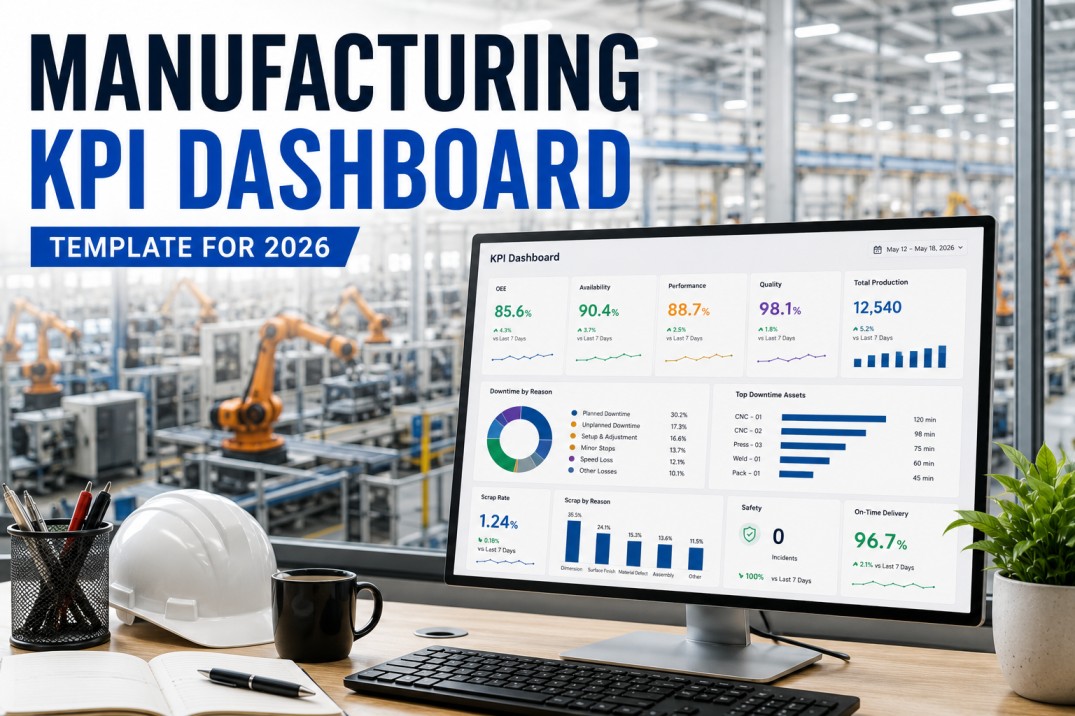
Turn your maintenance and manufacturing data into actionable insights. Customizable dashboards, real-time KPIs, and comprehensive reports help you make data-driven decisions that reduce downtime and cut costs.
Work Orders by Priority • This Month
From raw data collection to actionable insights, iFactory transforms your maintenance and manufacturing operations with intelligent analytics at every step.
Gather data from work orders, assets, sensors, and inspections automatically.
AI finds patterns, anomalies, and trends across all your operational data.
Interactive dashboards with charts, gauges, KPI cards, and heatmaps.
Generate PDF, Excel, CSV reports and schedule automated delivery.
Turn insights into action with AI recommendations and alerts.
Build personalized dashboards that display the metrics that matter most to your team. Drag-and-drop widgets, filter by location, asset, or technician, and monitor KPIs in real-time from anywhere.
Customize layout with drag-and-drop widgets.
Data refreshes automatically, no manual refresh needed.
Different dashboards for technicians, managers, and executives.
Access dashboards on any device, anywhere on the shop floor.
Analyze work order statuses by technician, team, asset, or location. Instantly spot bottlenecks, track completion rates, and identify which assets require the most attention. Eliminate manual reporting with automated summaries.
Open, in progress, completed, overdue at a glance.
WOs completed per technician, avg completion time.
Breakdown by critical, high, medium, low priority.
Weekly, monthly, yearly work order trends.
Top Technicians This Month
Track equipment downtime, calculate Mean Time To Repair (MTTR) and Mean Time Between Failures (MTBF). Identify your worst-performing assets and make data-driven decisions to improve reliability.
Mean Time To Repair by asset and category.
Mean Time Between Failures for reliability planning.
Complete history of planned and unplanned downtime.
Calculate financial impact of equipment failures.
Highest Downtime Assets
Track every maintenance dollar spent. Analyze costs by asset, location, work order type, or time period. Identify cost-saving opportunities and justify capital investments with comprehensive financial reports.
Track total maintenance spend over any period.
See which assets cost the most to maintain.
Break down costs by labor, parts, and vendors.
Compare actual spend vs budget allocation.
Cost Breakdown
Monitor preventive maintenance compliance rates and asset health scores. Ensure your PM program is on track, identify at-risk assets, and maintain equipment reliability with proactive reporting.
Track % of PMs completed on time across all assets.
Overall health scoring for each asset based on data.
Balance between reactive and PM work orders.
Correlate PM compliance with failure rates.
Asset Health Scores
Generate shareable PDF and Excel reports from any dashboard. Schedule automatic report delivery to stakeholders daily, weekly, or monthly. Eliminate manual reporting and keep everyone informed.
Export as PDF, Excel, or CSV with one click.
Set up automatic email delivery: daily, weekly, monthly.
Select from templates or create custom ones from scratch.
Reports automatically delivered to the right people.
Export Options
Scheduled Reports
Analytics and reporting pull data from every module in iFactory for complete visibility across your maintenance and manufacturing operations.
WO analytics
Equipment health
MTTR / MTBF
Budget tracking
Parts usage
Compliance rates
Whether you run a single facility or a global operation, iFactory analytics adapts to your industry's unique reporting requirements and KPIs.
OEE tracking, line efficiency, IATF compliance reporting.
FDA audit trails, calibration compliance, GMP reporting.
HACCP compliance, sanitation tracking, equipment uptime.
Yield analytics, defect tracking, cleanroom compliance.
Grid reliability, outage reports, asset lifecycle analytics.
Space utilization, tenant requests, SLA compliance.
Batch analytics, process efficiency, EHS incident reports.
AS9100 compliance, flight-hour tracking, reliability reports.

Injection molding runs at high cadence where every second of cycle time and every gram of material affect margin. Process analytics connects press controllers, vision inspection, and energy meters into a unified...

Heavy equipment OEMs face a different analytics challenge than discrete manufacturers. With production in the hundreds of units per year and multi-week build cycles, unit-level traceability matters far more than...

Cement and building materials manufacturing presents unique analytics challenges that differ fundamentally from discrete production. The process is continuous, thermally intensive, and operates under extreme...
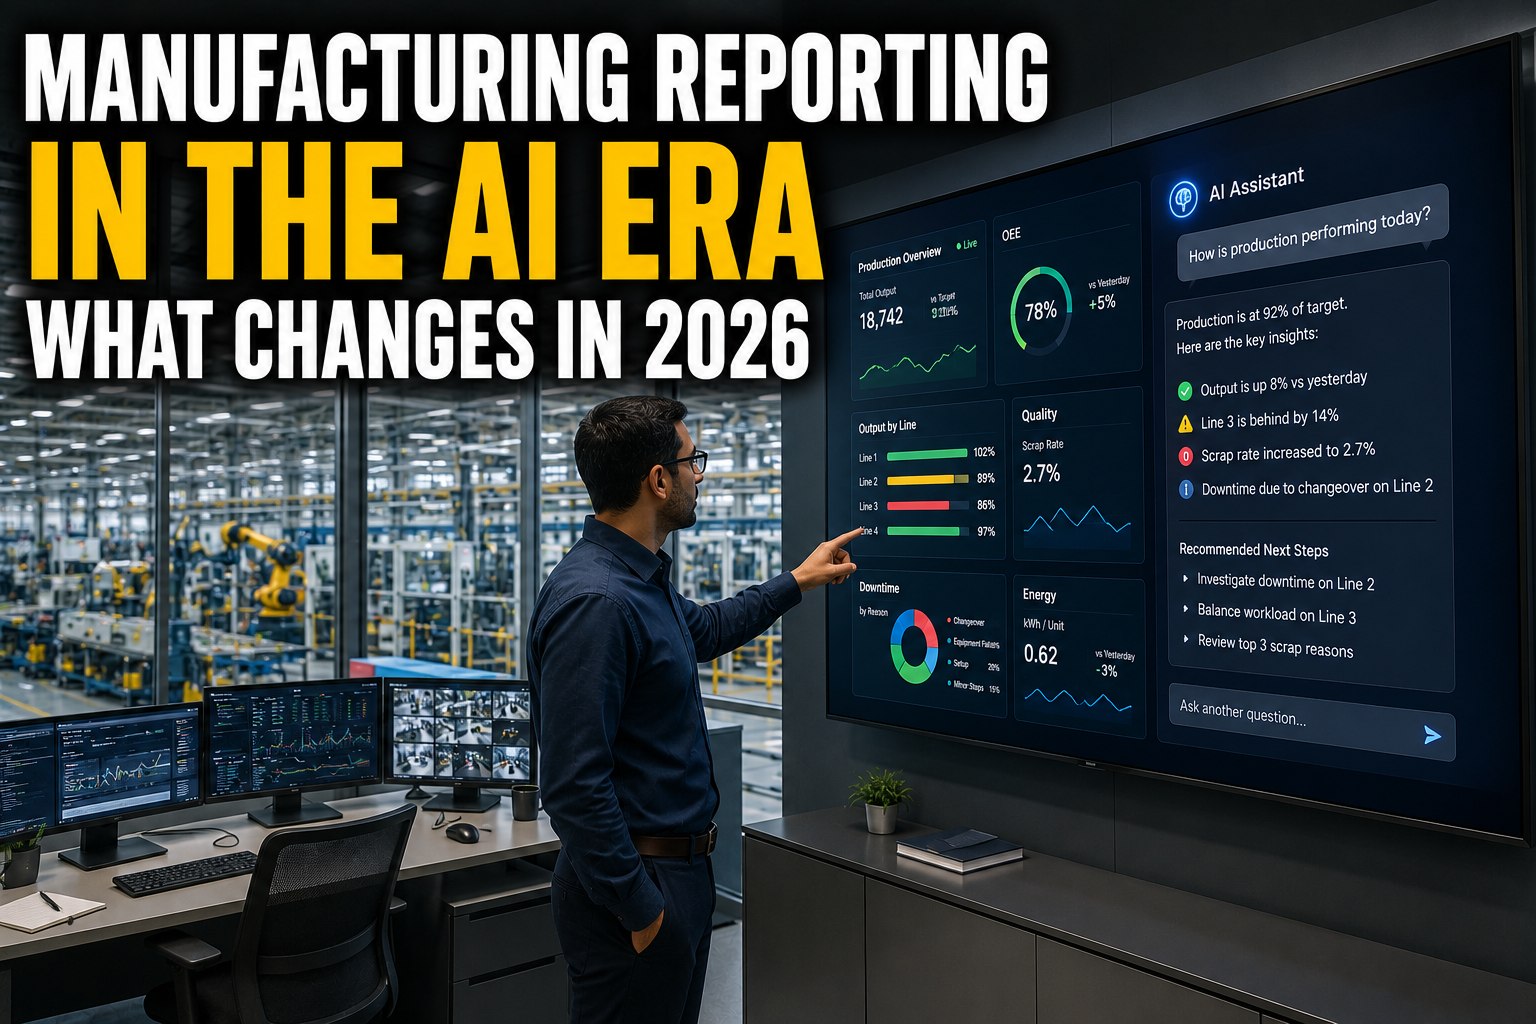
Artificial intelligence is fundamentally reshaping manufacturing reporting, moving the industry from dashboards you have to read to insights that find you. Instead of writing SQL queries, you ask questions in...
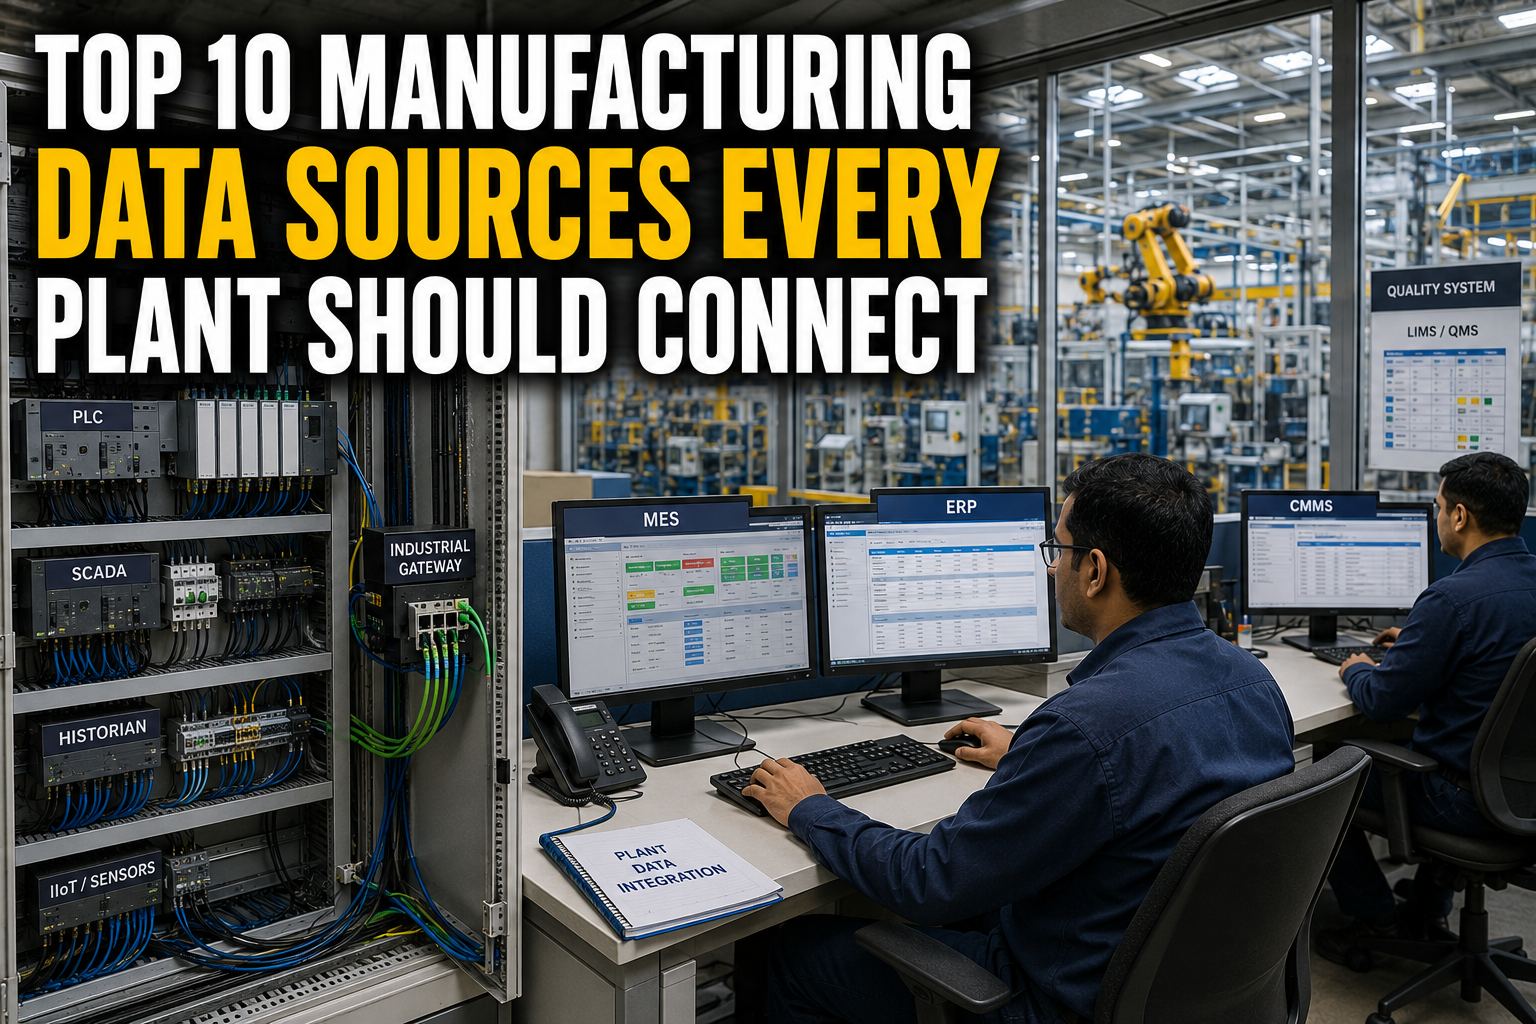
To build a complete, decision-grade analytics foundation for your manufacturing plant, you need the right data sources connected in the right way. PLCs give you real-time machine states, SCADA delivers process...

Electronics manufacturing demands precision at a scale few industries match — over one million component placements per hour on a single SMT line, with solder joints measured against IPC-610 criteria and...

Quality engineers in manufacturing plants do not need more PowerPoint presentations or static PDF reports. They need live analytics — real-time visibility into non-conformance reports, statistical process...

Chief operating officers oversee multiple plants, each generating its own reports and exceptions. The challenge is not a lack of data but the absence of analytics purpose-built for the COO role — analytics...

Operator dashboards are fundamentally different from every other screen in a manufacturing plant. While managers look at trends, supervisors review summaries, and executives analyse benchmarks, an operator looks...

Aerospace and defense manufacturing demands the most stringent quality standards in the industrial world, where every part and process must comply with AS9100D, AS9102 FAIR, AS9103 SPC, ITAR, and DFARS....

Supply chain leaders need real-time plant data to make sourcing, capacity, and fulfilment decisions, not lagging ERP reports that mask today’s production reality. Manufacturing analytics connects plant-floor...

Steel and metal manufacturing demands analytics built for continuous high-temperature processes, extreme energy intensity (15–25% of COGS), and complex phase transitions from molten metal to finished coil....

CFOs in manufacturing operate at the intersection of financial reporting and operational reality. The traditional monthly P&L provides a lagging view of what happened, but it does not explain why margins...
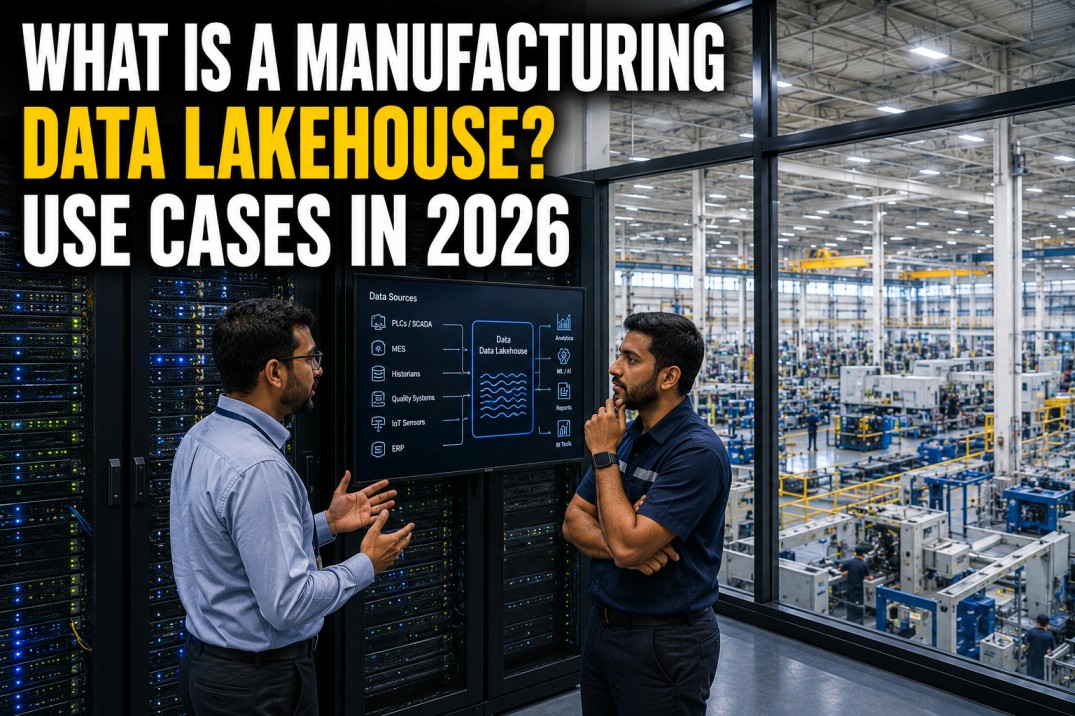
A data lakehouse is an open architecture that combines the flexibility, scalability, and low-cost storage of a data lake with the ACID transaction support, schema enforcement, and high-performance SQL query...

Plant managers need different analytics than executives. Where an executive dashboard serves summary-level strategic context for monthly board reviews and annual planning, a plant manager’s analytics...
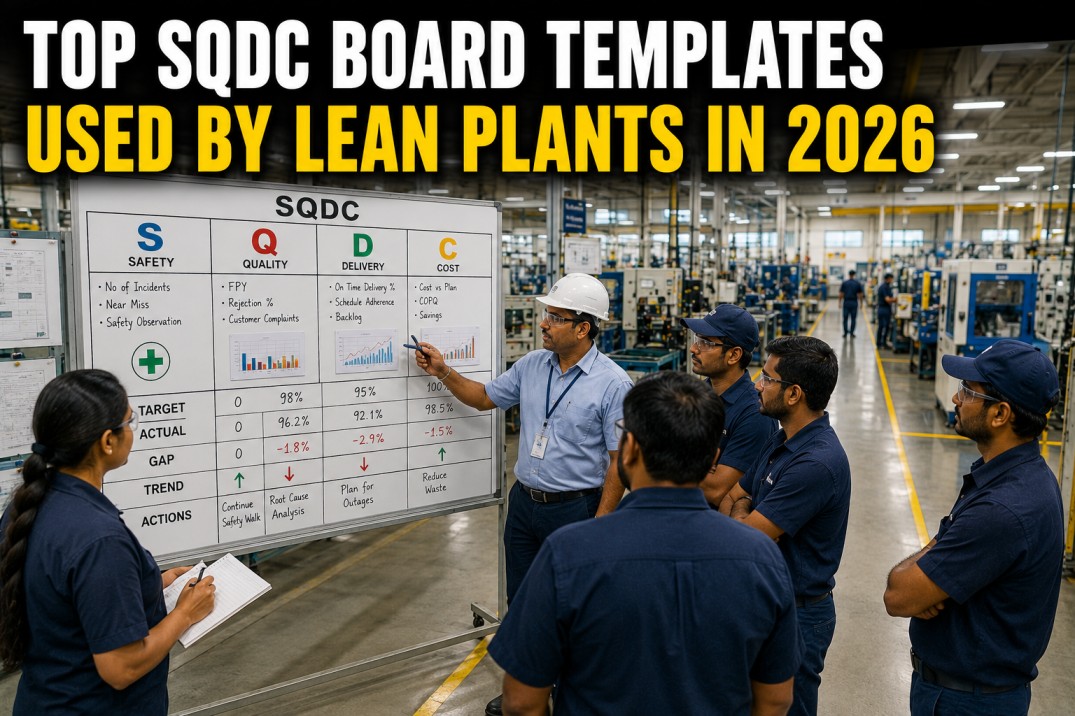
SQDC (Safety, Quality, Delivery, Cost) boards are the backbone of daily lean management in world-class manufacturing plants. These visual management tools bring cross-functional teams together at the gemba each...

Manufacturing report latency is the silent bottleneck that undermines data-driven decision-making. When reports arrive 24 hours late and dashboards refresh once per shift, plant leaders make critical decisions...
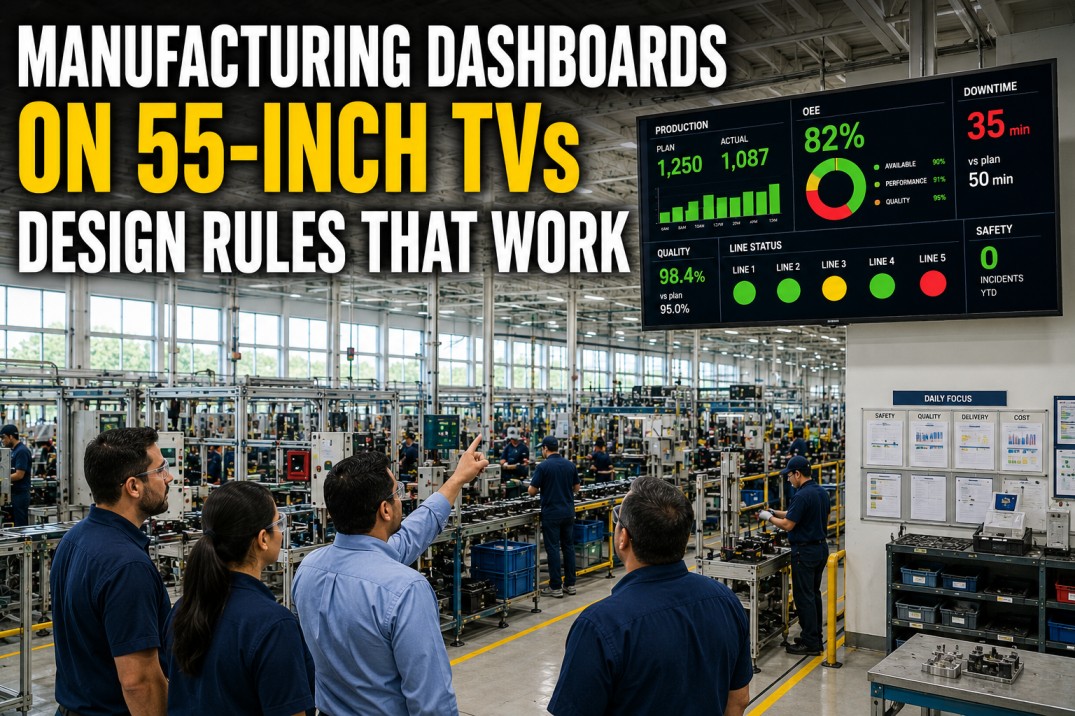
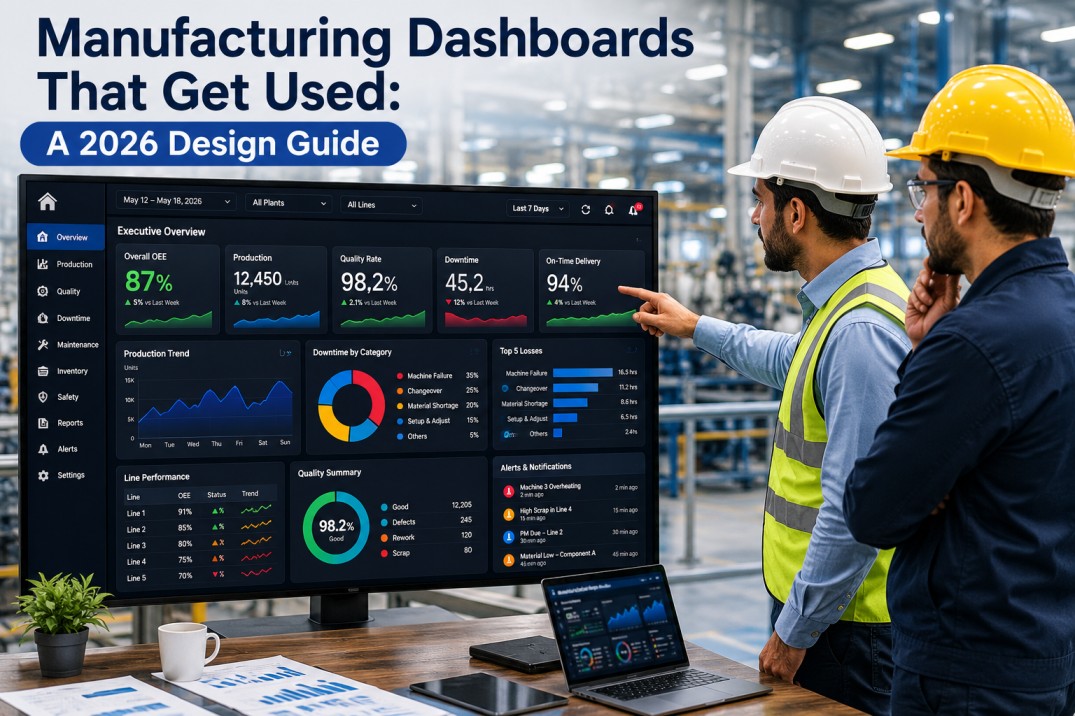
Putting manufacturing dashboards on large TV displays is fundamentally different from designing for desktop monitors or tablets. A 55-inch TV viewed from 15 feet has different legibility requirements, colour...

Manufacturing analytics terminology is the common language that enables plant leaders and operators to communicate clearly about production performance. Without a shared vocabulary, stakeholders interpret yield...

Real-time Statistical Process Control (SPC) on tablets is transforming how operators monitor and control manufacturing quality on the plant floor. Traditional SPC — paper charts filled by hand, spreadsheet...

Every manufacturing plant runs on data. PLCs on the plant floor generate thousands of signals per second — line speed, temperature, pressure, vibration, cycle count, defect status. But raw PLC data, by itself,...

Choosing the right analytics platform for a manufacturing plant is fundamentally different from selecting a general-purpose business intelligence tool. ThoughtSpot pioneered search-driven analytics, allowing...

Manufacturing dashboards are deployed with the best intentions — give operators, supervisors, and managers real-time visibility into production performance. Yet the data tells a sobering story: the average...

Manufacturing reporting in 2026 demands more than static spreadsheets and data dumps. Best practices now centre on KPI clarity, audience-specific dashboards, automated data pipelines, and governance frameworks...

Excel has been the backbone of manufacturing reporting for over three decades. Plant managers, supervisors, and operators rely on spreadsheets to track production output, quality metrics, downtime, and...

An andon escalation matrix is the structured backbone of every effective manufacturing andon system. It defines exactly who responds to each call type, how quickly they must respond, and what happens when...
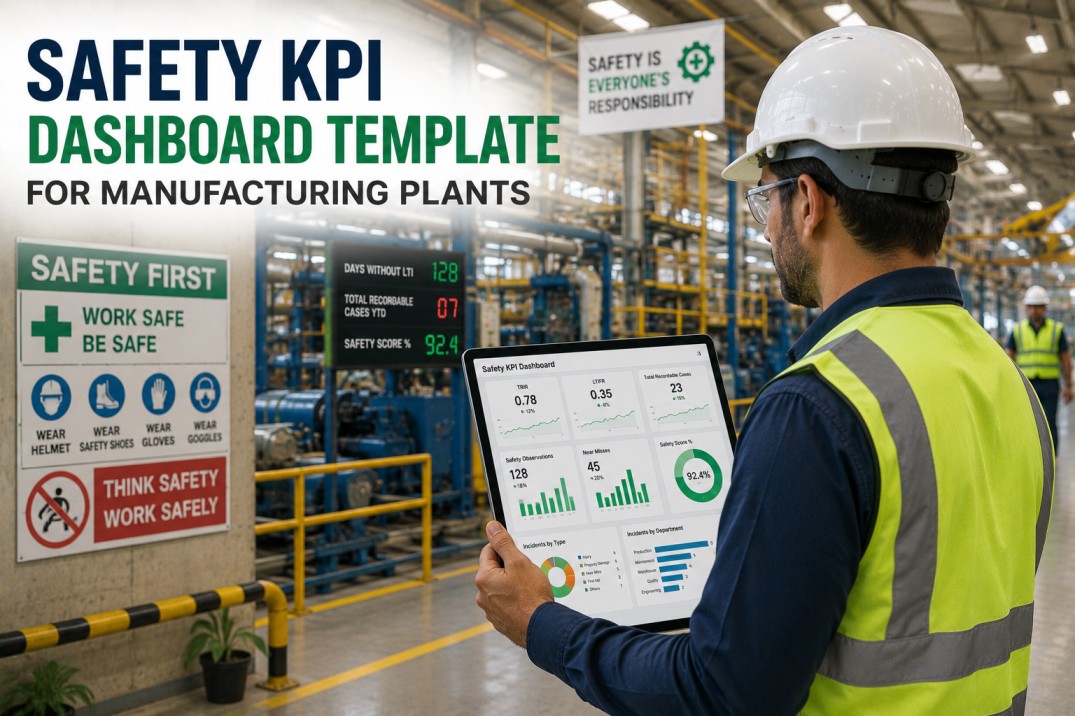
A safety KPI dashboard is the central tool for monitoring, measuring, and improving safety performance across a manufacturing plant. Leading organisations track both lagging indicators — such as Total...
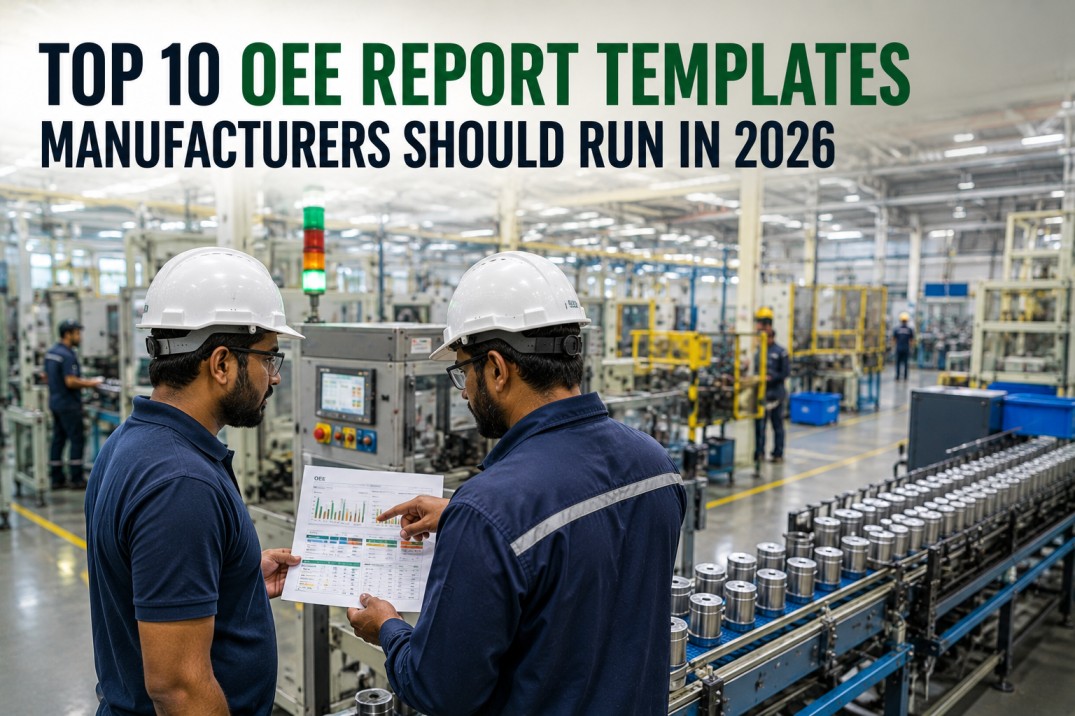
Most plants run one OEE report — usually a single trend chart pulled monthly. That single view answers "is OEE going up or down," but it can't tell you why, which line is dragging the average, or which loss...
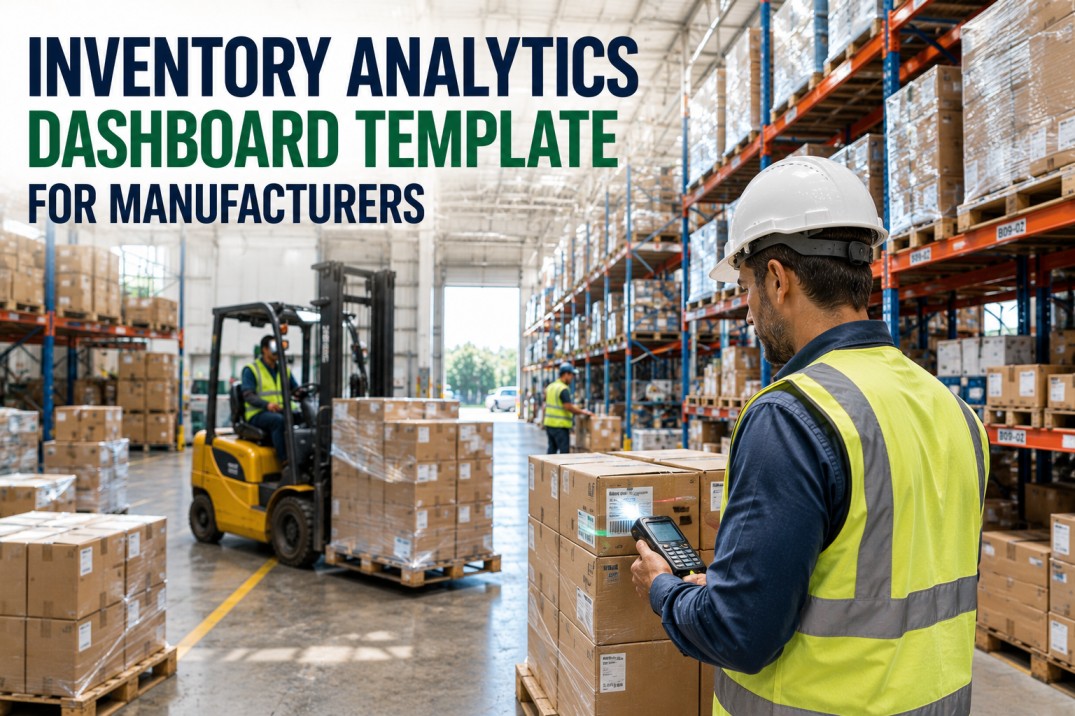
A manufacturing inventory analytics dashboard is the single most effective tool for reducing working capital while improving service levels. This template provides a complete inventory dashboard structure...

An energy KPI dashboard is the primary tool for manufacturing plants to monitor, analyse, and reduce energy consumption. Without a structured dashboard, energy data sits in utility bills and meter logs —...

Manufacturing dashboard templates are not one-size-fits-all — an operator monitoring shift production needs a fundamentally different view than a COO tracking enterprise-wide OEE trends. Yet most analytics...

A manufacturing executive dashboard is not the same as an operational dashboard. Where an operator dashboard shows shift-level detail and a plant manager dashboard shows daily performance, an executive dashboard...
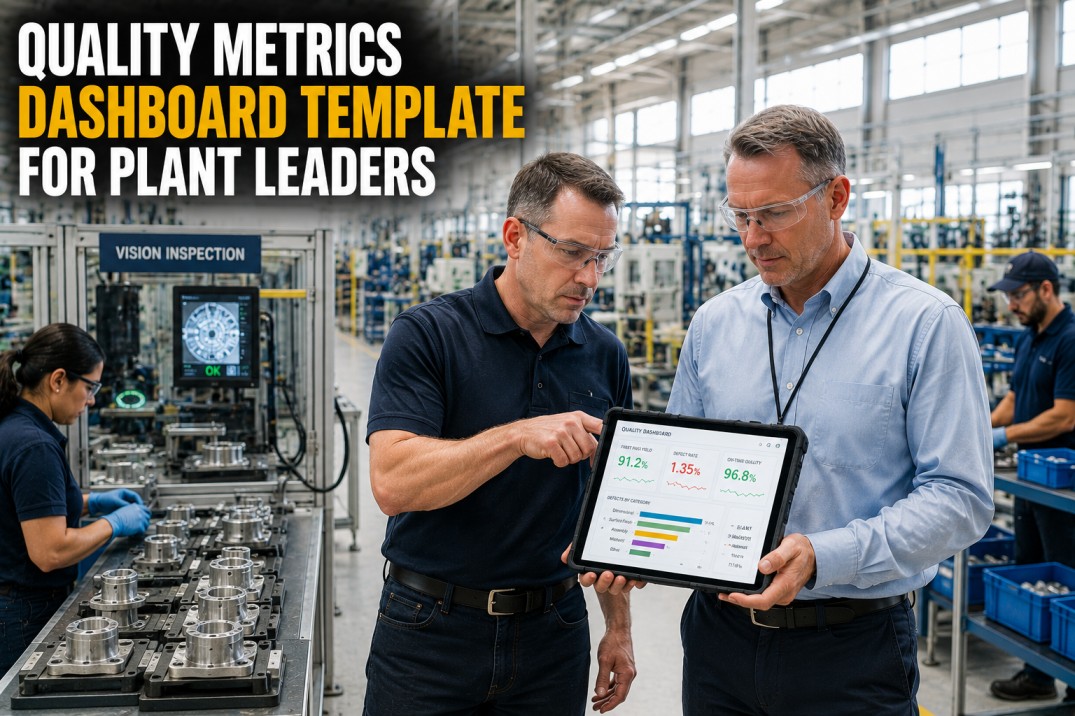
A quality metrics dashboard is the single most important screen for any plant leader who wants to move from reactive quality management — chasing defects after they happen — to proactive quality control...
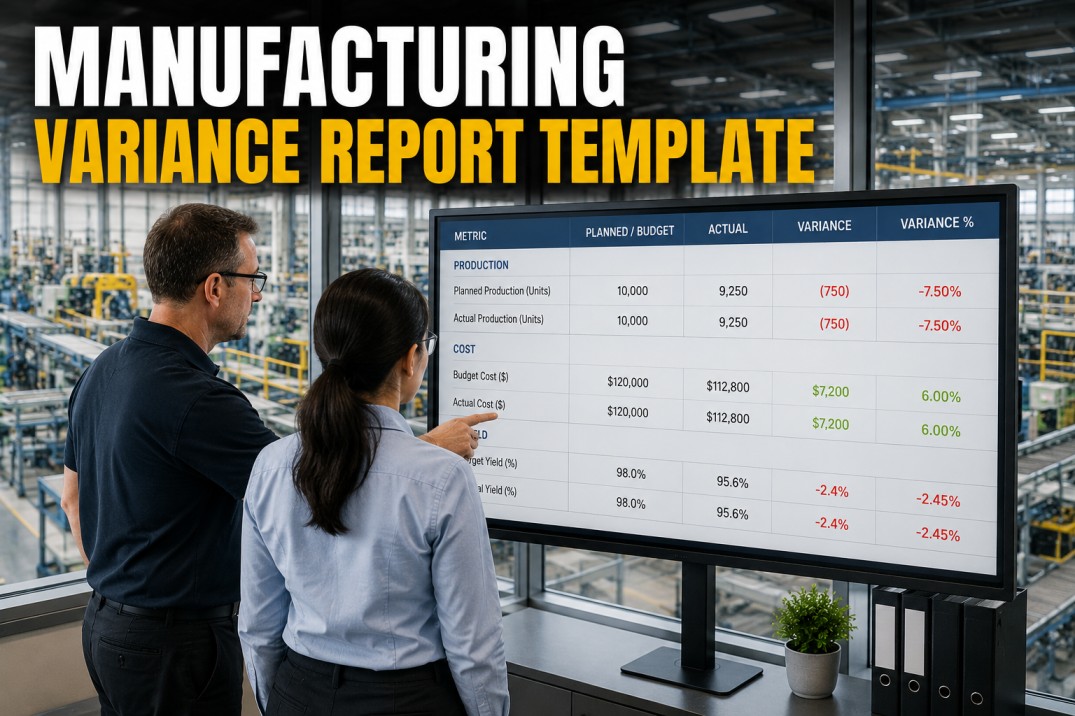
A manufacturing variance report compares actual production costs against standard or budgeted costs, breaking down each difference into actionable categories — volume, mix, price, and efficiency. Without a...
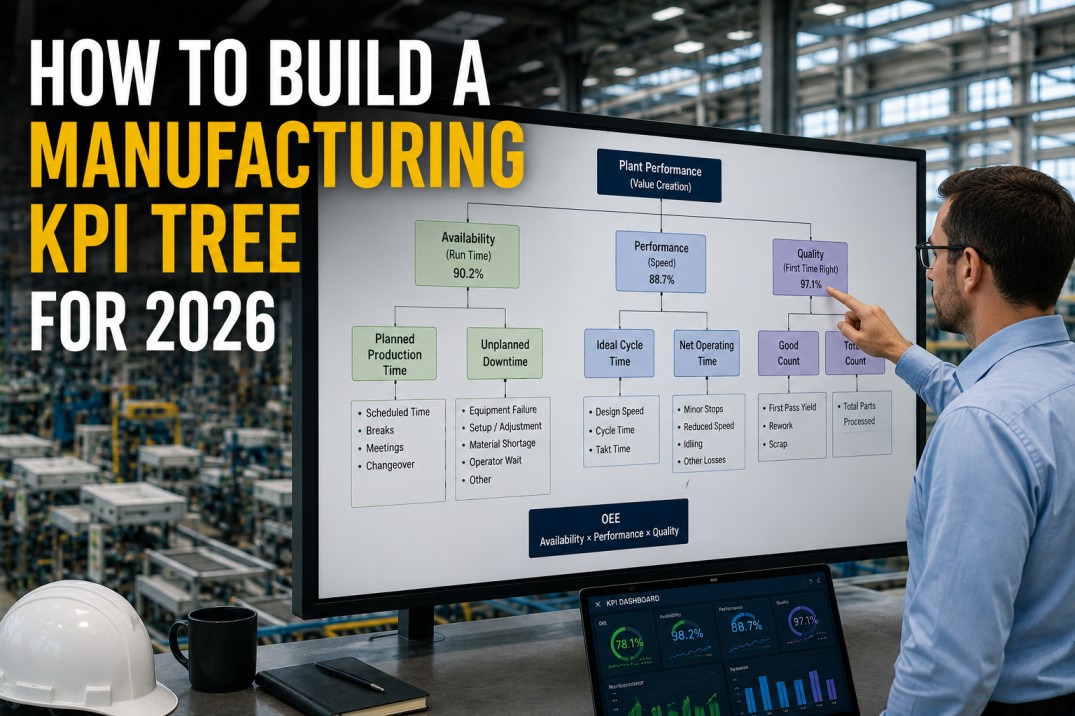
A manufacturing KPI tree — also called a KPI cascade or metric tree — is the single most effective tool for aligning plant-floor activity with financial performance. At its simplest, a KPI tree starts with a...
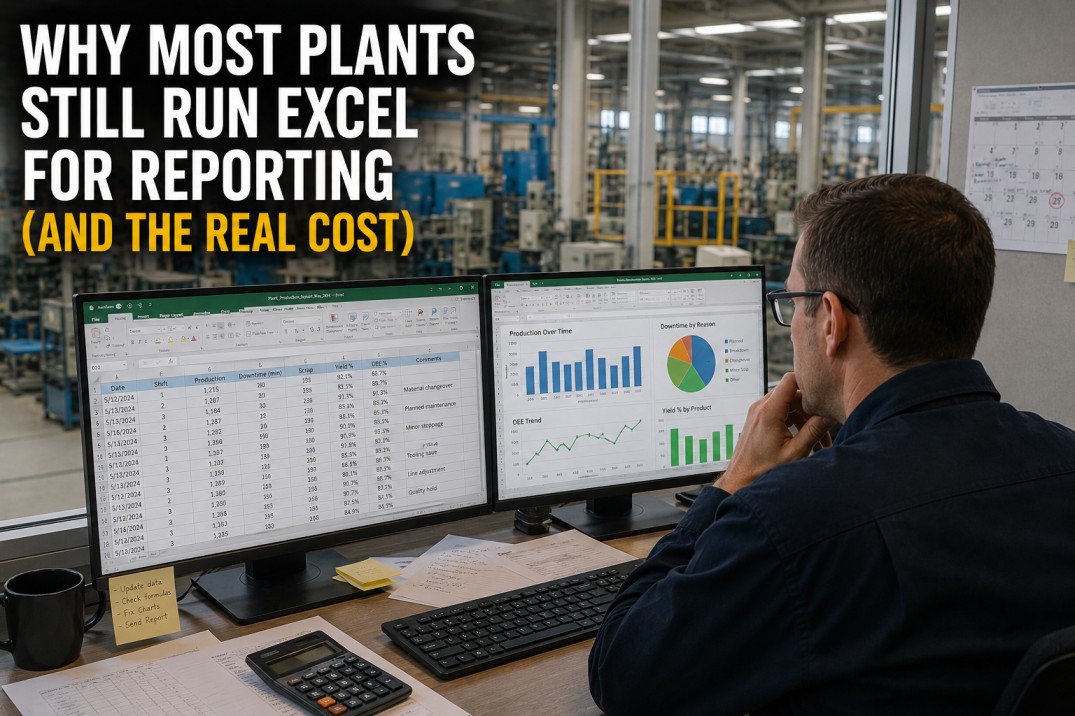
Walk into any manufacturing plant in 2026 and you will find spreadsheets — dozens, often hundreds of them. Production logs in Excel, shift handover notes in CSV files, OEE calculators in shared network folders...

Most manufacturing plants in 2026 are stuck in a reactive analytics cycle. Data is collected passively — historians log OEE after each shift, quality reports land weekly, and downtime is analysed after the...
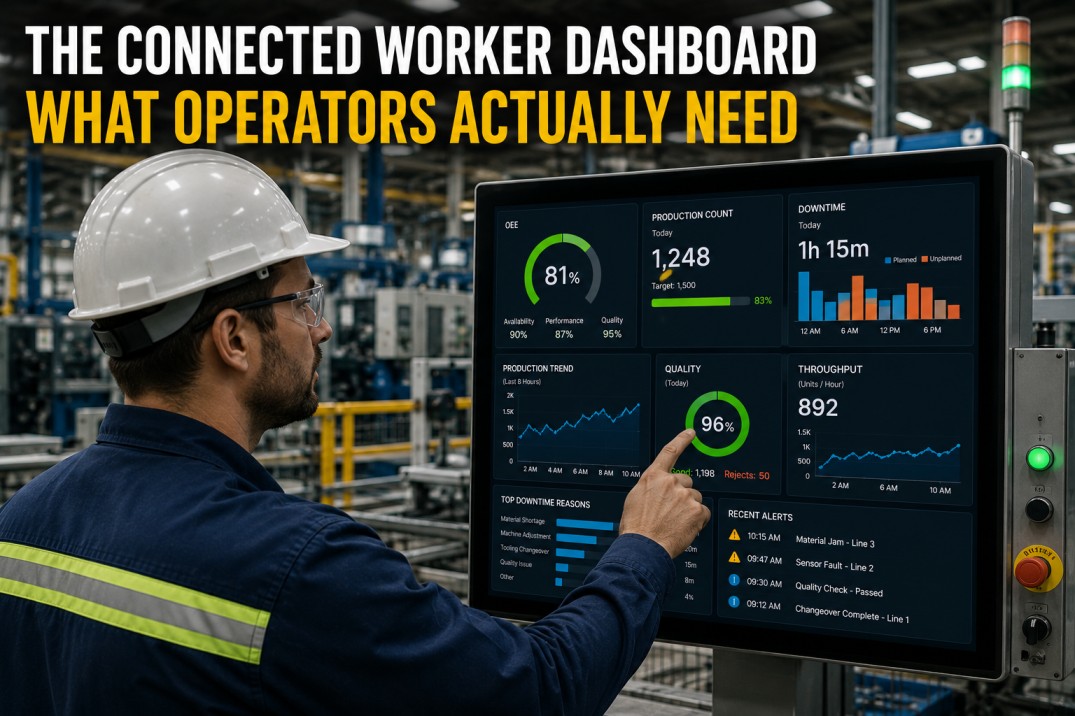
The connected-worker dashboard is not a smaller version of the plant manager's screen. It is a fundamentally different tool designed for the rhythm of the production line — big numbers, one alert at a time,...
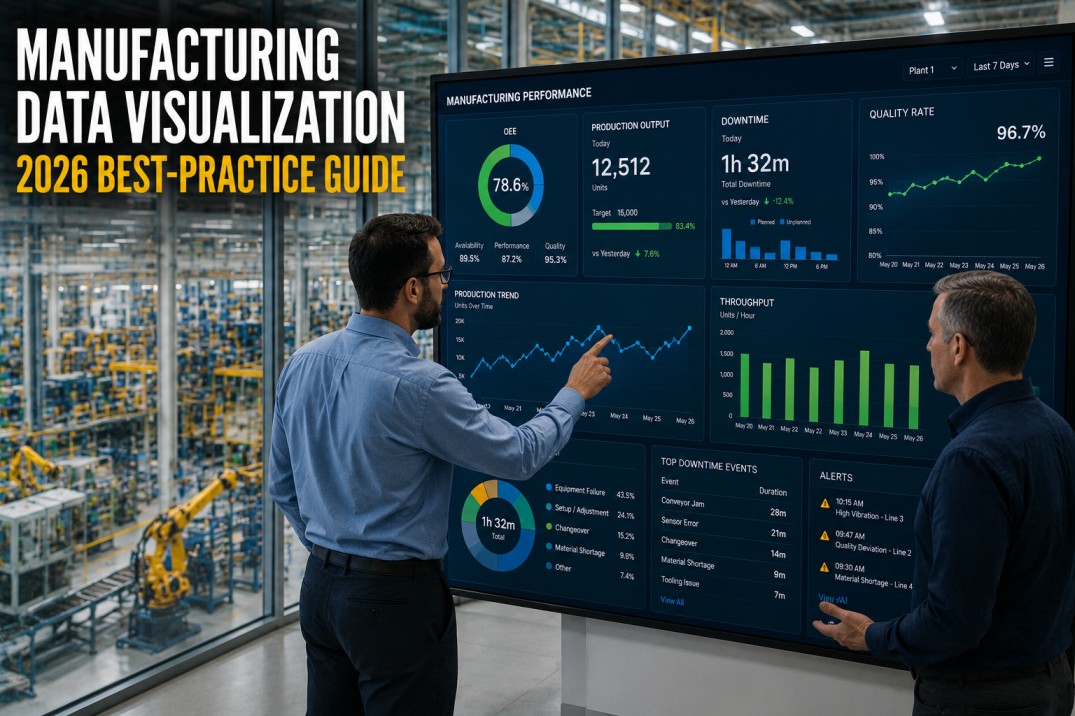
Manufacturing data visualization is the bridge between raw operational data and fast, confident decisions on the plant floor. The difference between a dashboard that operators glance at and act on versus one...
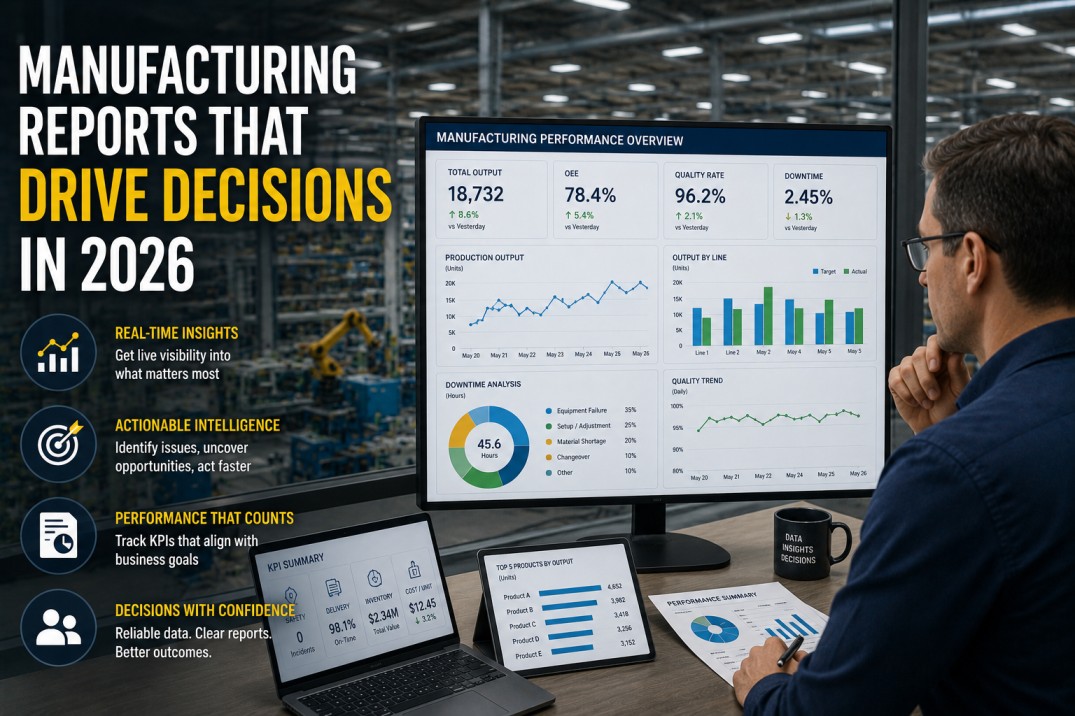
Most manufacturing plants generate 40-50 reports every day. The majority of these — shift summaries, downtime logs, quality spreadsheets, cost sheets, energy reports — are generated because they always have...
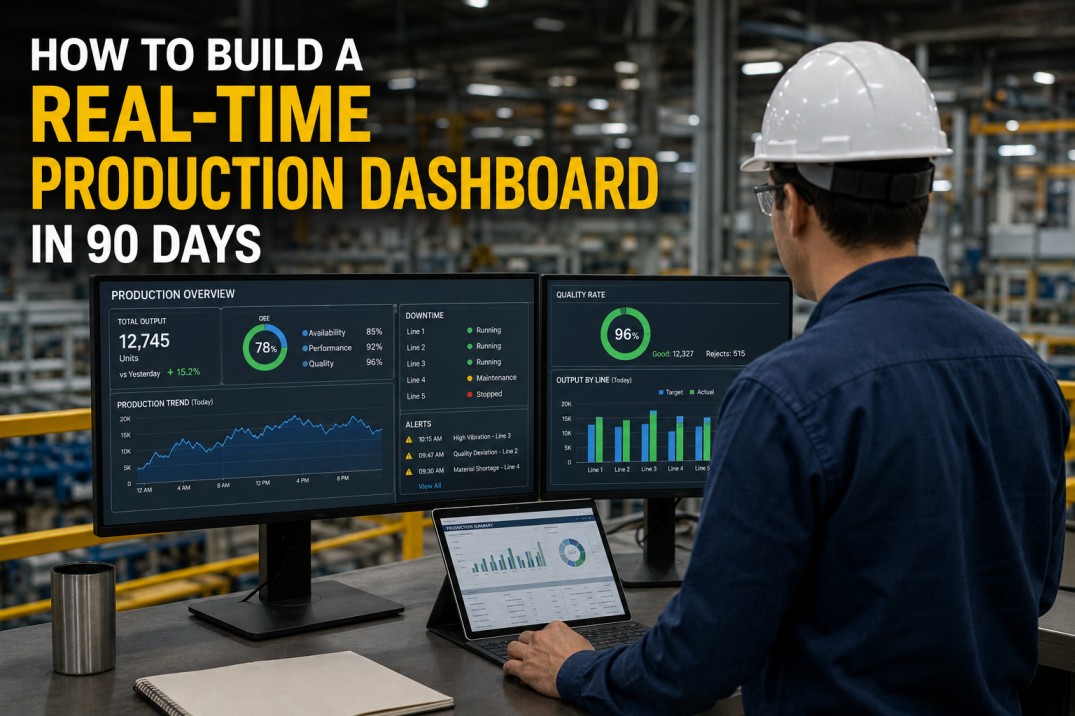
Building a real-time production dashboard in 90 days is an ambitious but achievable goal for most manufacturing plants — provided you follow a structured methodology with clear phase gates, pre-built data...

A manufacturing reporting stakeholder checklist helps plant operations leaders systematically identify every person who consumes reports — from machine operators on the plant floor to the COO in the boardroom...
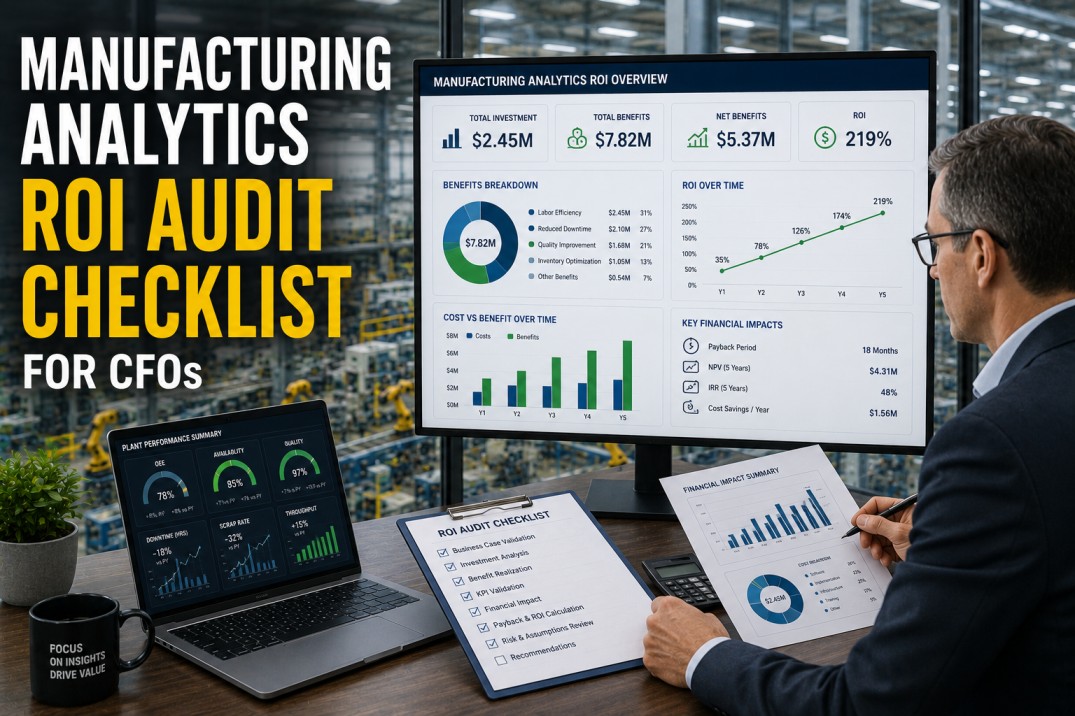
A manufacturing analytics ROI audit gives CFOs a structured framework to verify that analytics investments are delivering the promised financial returns. Without a disciplined audit process, analytics programmes...
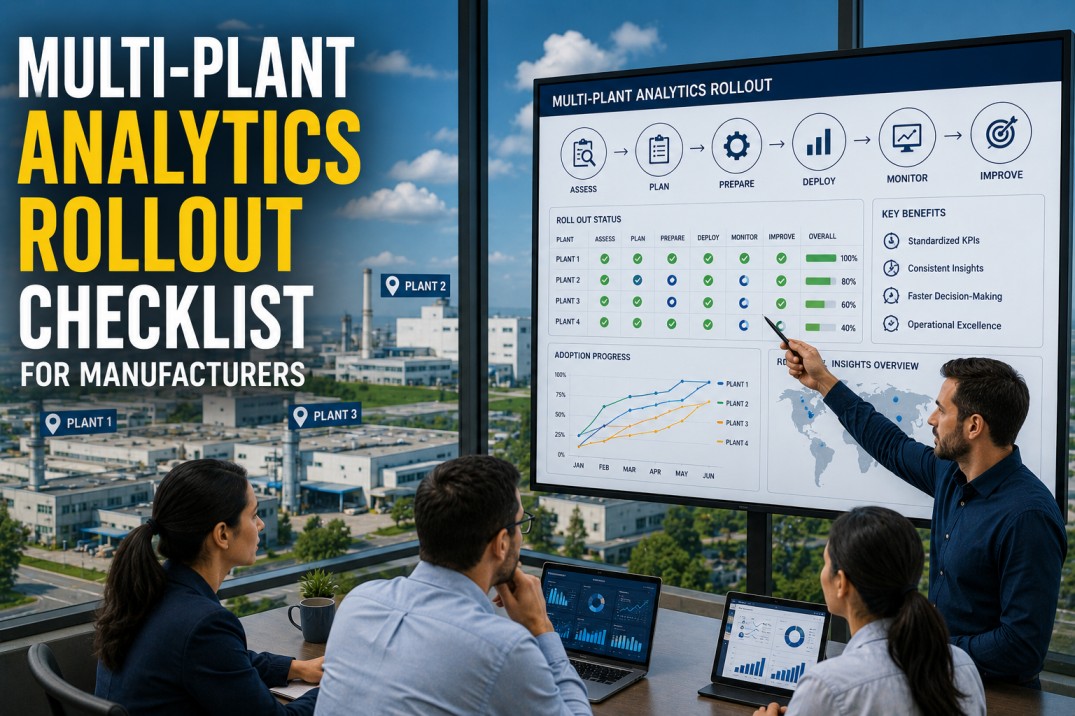
A multi-plant analytics rollout is one of the most complex initiatives a manufacturing organisation can undertake — deploying standardised dashboards, harmonised KPIs, and unified data pipelines across...
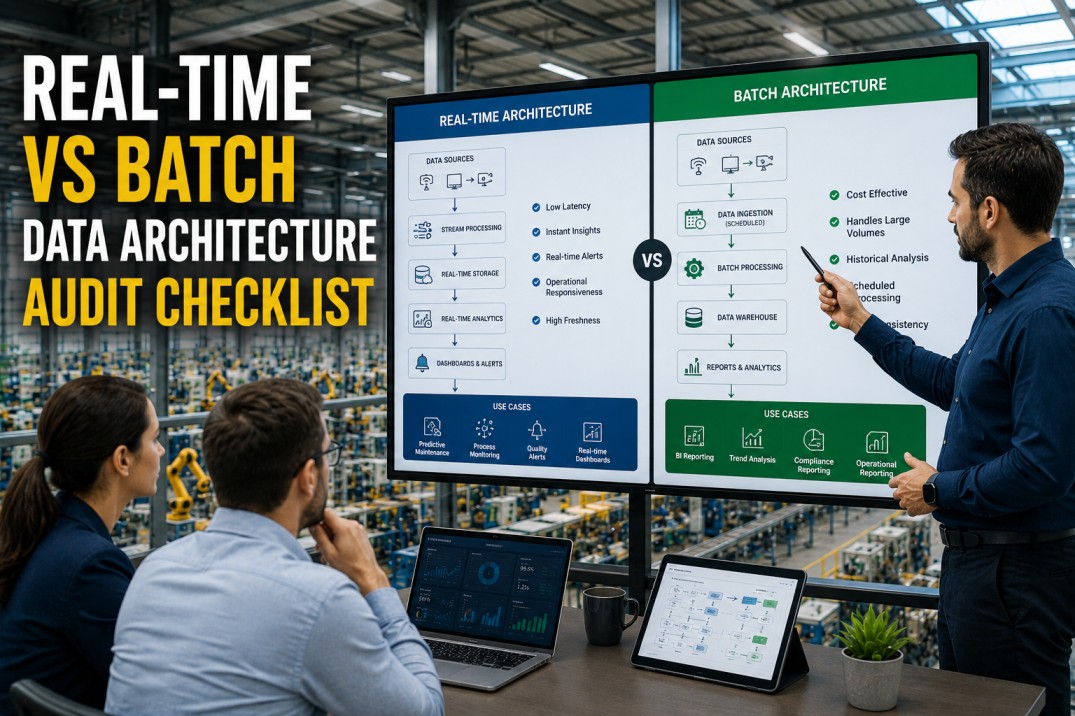
A real-time vs batch data architecture audit systematically evaluates every data source in your manufacturing analytics ecosystem — classifying each source by its latency requirements, assessing current...
.png)
A KPI definitions audit systematically examines every metric in your manufacturing analytics ecosystem — verifying that each KPI has a clearly defined formula, documented data source, assigned owner, and...

Change management is the single most underestimated factor in manufacturing analytics success. Even the most technically robust analytics platform delivers low ROI if operators, supervisors, and plant managers...
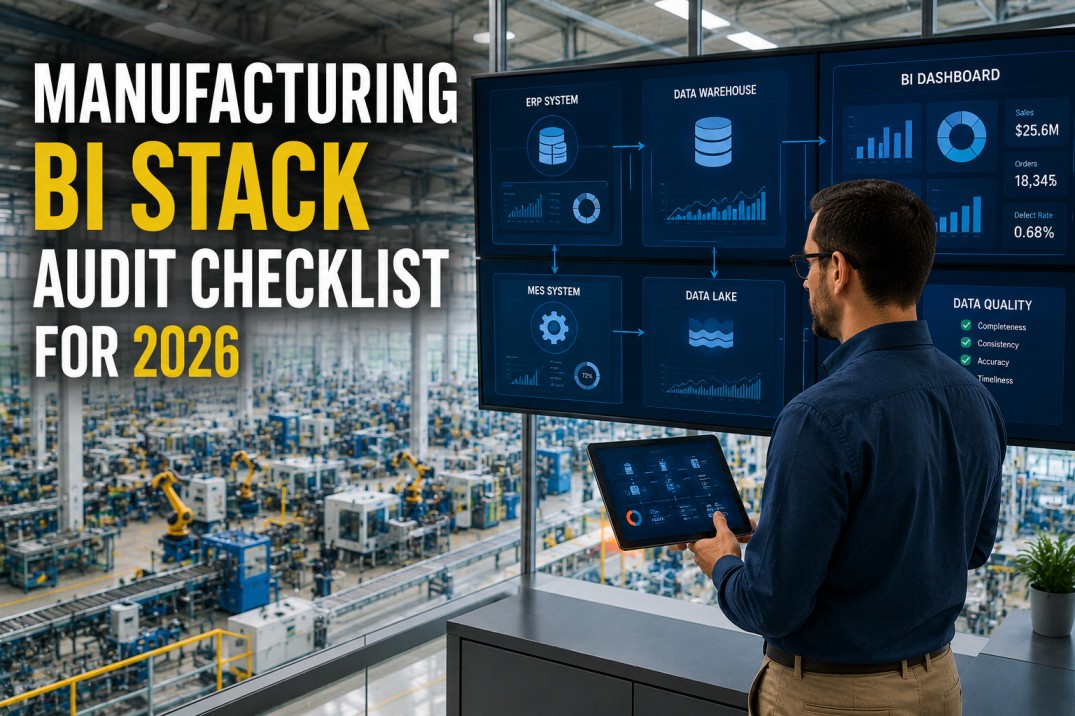
A manufacturing BI stack audit systematically evaluates every layer of the analytics technology stack — from data ingestion through transformation, storage, semantic modeling, and visualization to alerting....
DPPM (Defective Parts Per Million) is the most widely used customer-facing quality metric in manufacturing — it directly measures how many defective units reach customers per million shipped. Tracking DPPM at...
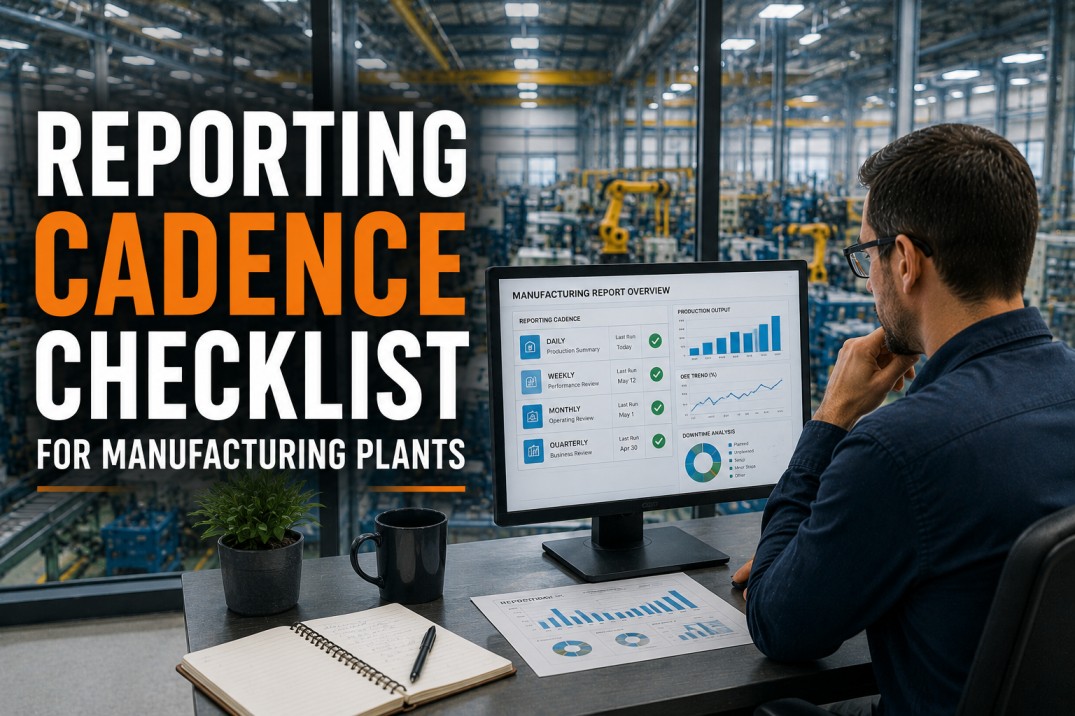
A manufacturing reporting cadence defines which reports run at which frequency — hourly, daily, weekly, monthly, quarterly, or annually — and who receives them. Without a structured cadence,...

A manufacturing analytics pilot is the critical bridge between a technology evaluation and a plant-wide rollout — but most pilots fail not because the technology is wrong, but because the pilot scope, success...
Schedule attainment — the ratio of actual production output to planned production within a defined time period — is the single most visible measure of plant-floor execution effectiveness. Yet most...

Manufacturing analytics investments consume significant capital — yet most CFOs and COOs lack a standard framework to assess whether their plant analytics ecosystem is delivering measurable business impact....

A plant-floor sensor coverage audit is the foundational step before any IIoT, condition monitoring, or predictive maintenance initiative. Without a clear inventory of existing sensors, their types, coverage...

Moving manufacturing analytics to a cloud data warehouse — Snowflake, BigQuery, or Databricks — promises scalability, real-time insights, and lower total cost of ownership. But the journey from on-premise...

Cycle time is the heartbeat of discrete manufacturing — every second of deviation between actual and standard cycle time directly impacts throughput, labour cost, and delivery commitments. Yet many discrete...
.png)
Production loss is the single largest hidden cost in manufacturing — every minute of unplanned downtime, every second of speed loss, every unit of rework represents capacity and margin that can never be...
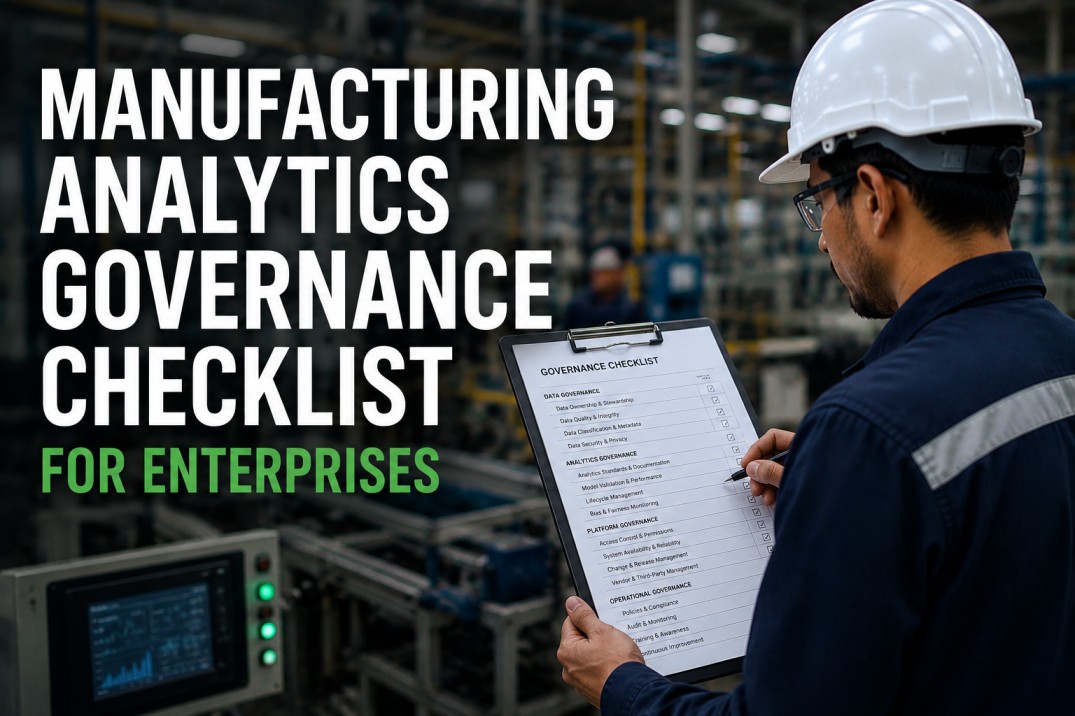
Enterprise analytics governance is the backbone of trustworthy manufacturing data — defining who owns each metric, how it is calculated, who can access it, and how changes are controlled. Without governance,...
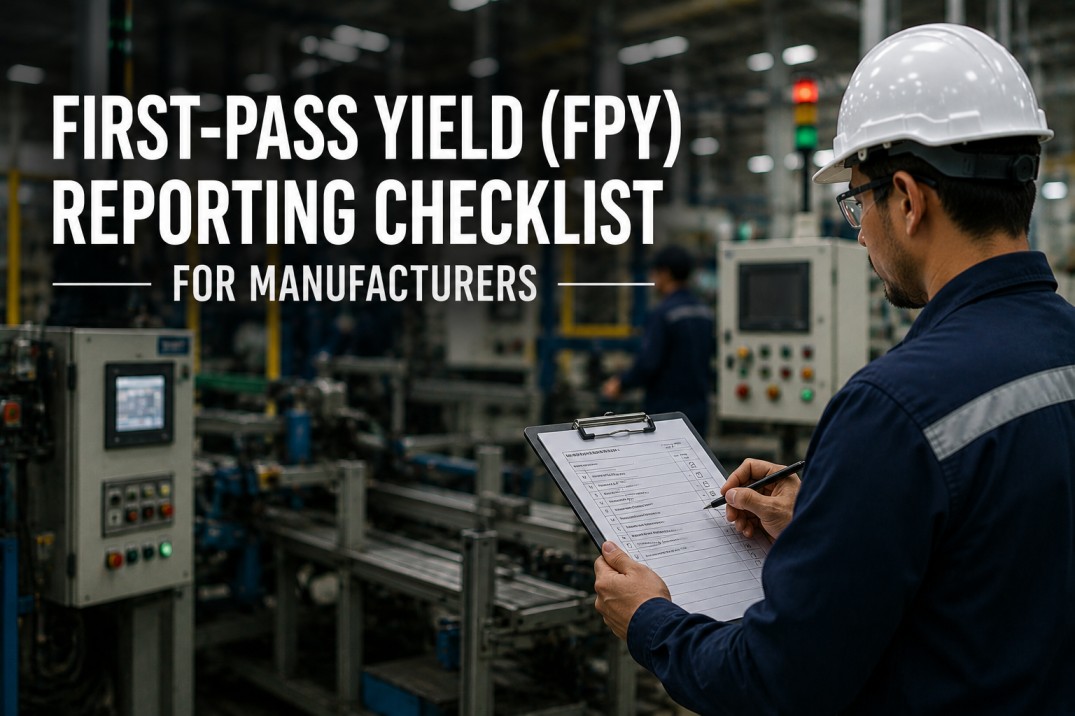
First-pass yield (FPY) is one of the most actionable quality metrics in manufacturing — measuring the percentage of units that pass inspection on the first attempt without rework or scrap. Yet many plants...
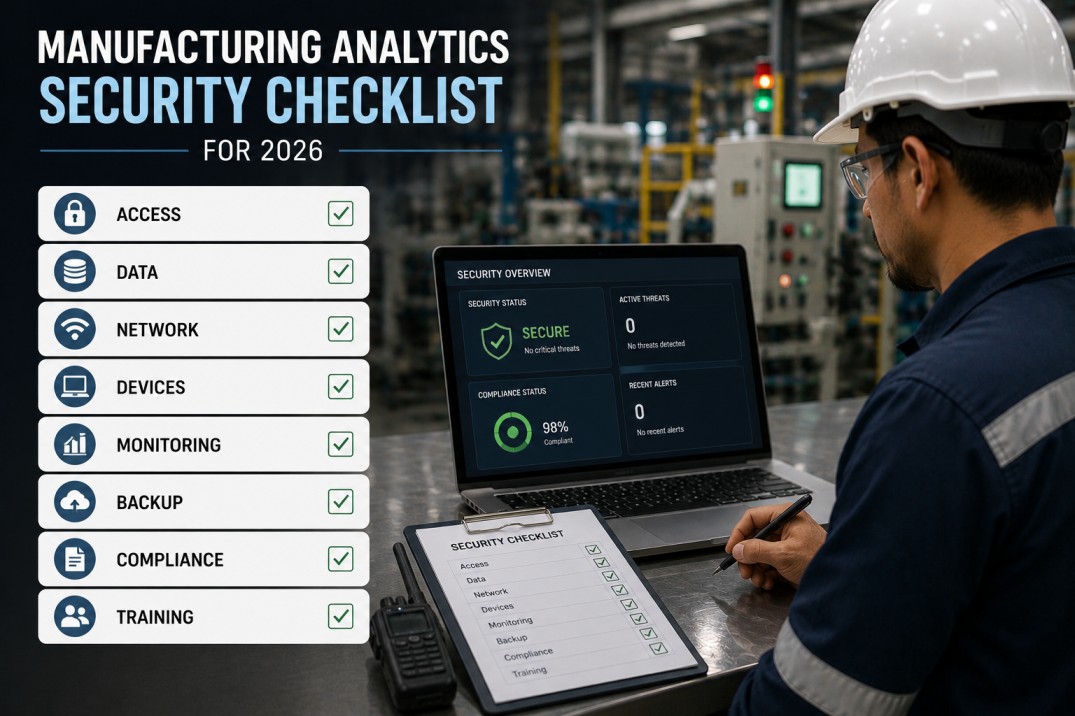
Manufacturing analytics security is no longer optional — as plants connect OT systems to cloud analytics platforms, the attack surface expands across IT/OT boundaries, exposing production data, machine...

OEE loss categorization is the foundation of effective overall equipment effectiveness tracking — yet most operators struggle to classify downtime, speed losses, and quality defects consistently across shifts....
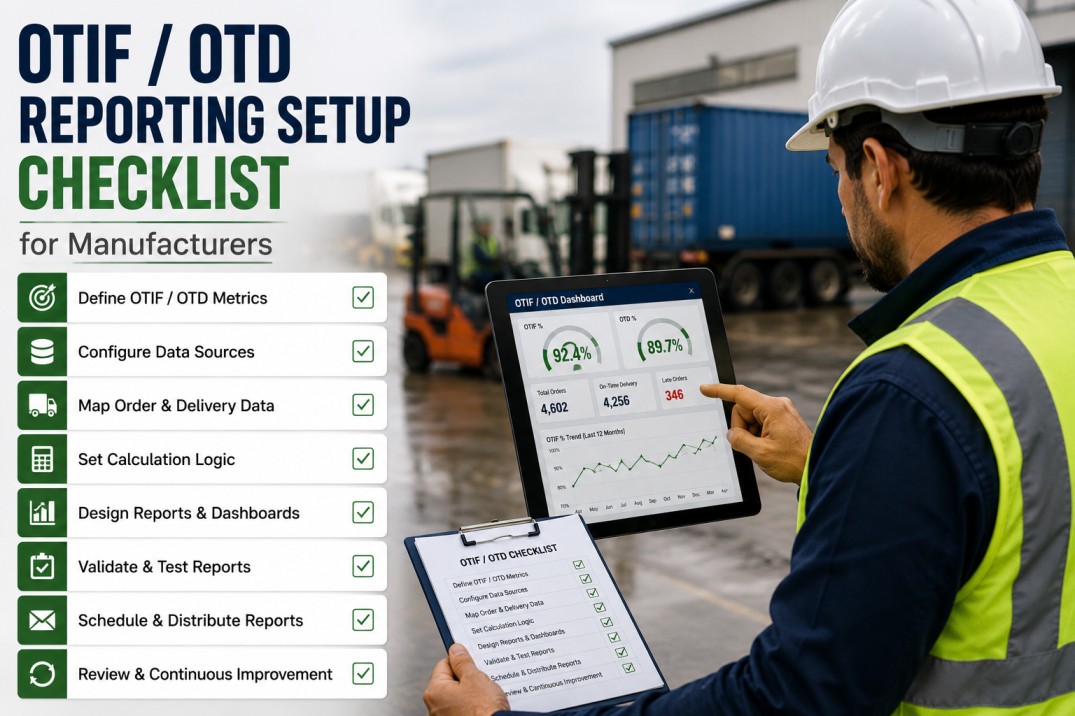
An OTIF (On-Time In-Full) and OTD (On-Time Delivery) reporting setup checklist helps manufacturing plants configure accurate, customer-specific fulfilment tracking across their ERP, logistics, and warehouse...
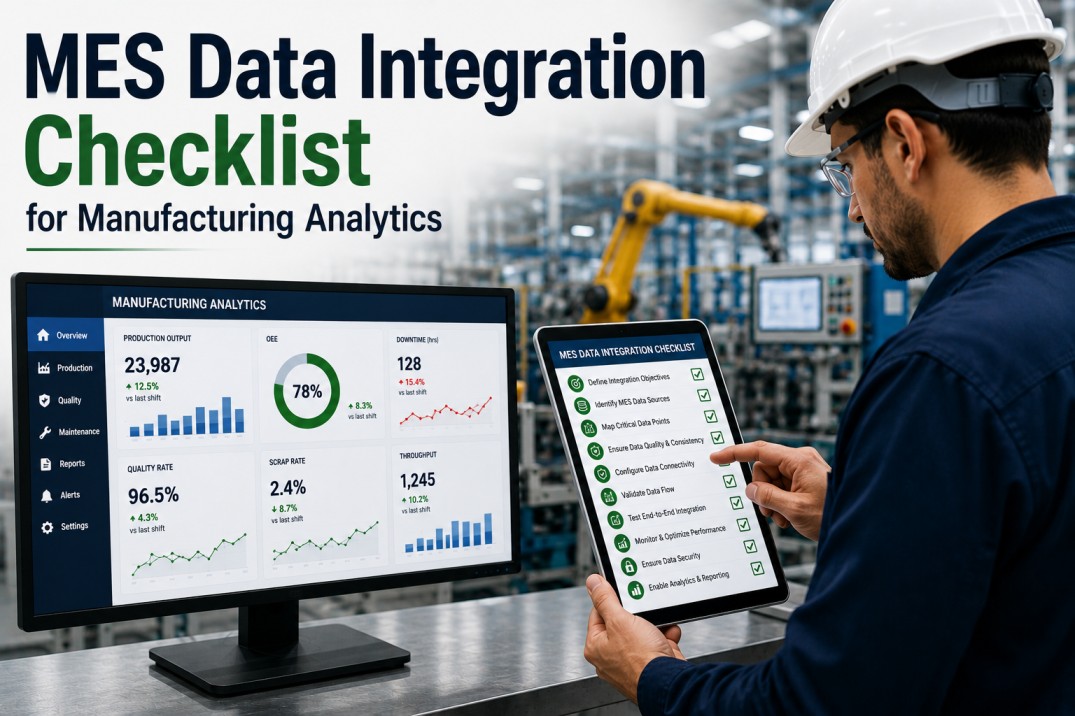
A MES data integration checklist helps manufacturing analytics teams systematically connect manufacturing execution systems — Siemens OPC UA, Rockwell FactoryTalk, Wonderware InTouch, GE Proficy, AVEVA MES,...
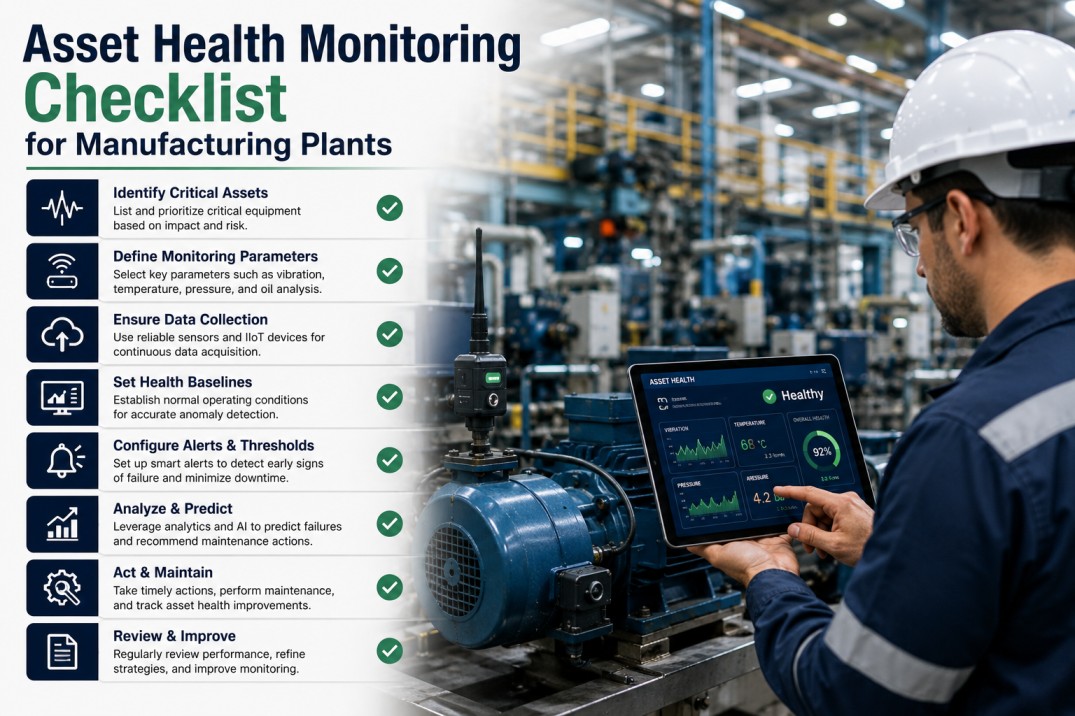
An asset health monitoring checklist helps manufacturing plants systematically track the condition, performance, and risk profile of critical production equipment. Without a structured approach to asset health...

An ERP integration checklist helps manufacturing analytics teams systematically connect enterprise resource planning systems — SAP, Oracle, Microsoft Dynamics, Infor, IFS, and QAD — to their analytics...

A sustainability reporting checklist helps manufacturing plants systematically track environmental, social, and governance metrics — covering carbon emissions (Scope 1, 2, and 3), energy consumption, water...
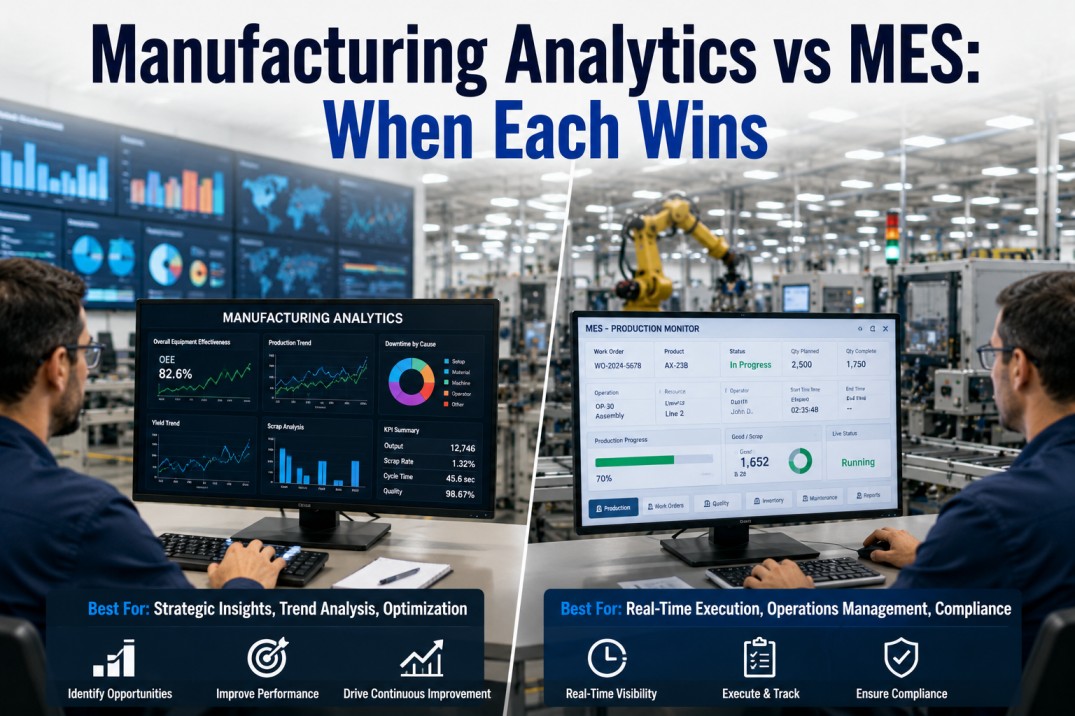
Manufacturing Execution Systems (MES) and manufacturing analytics platforms are often confused — and sometimes conflated — by plant teams evaluating their technology stack. Both systems operate on the plant...
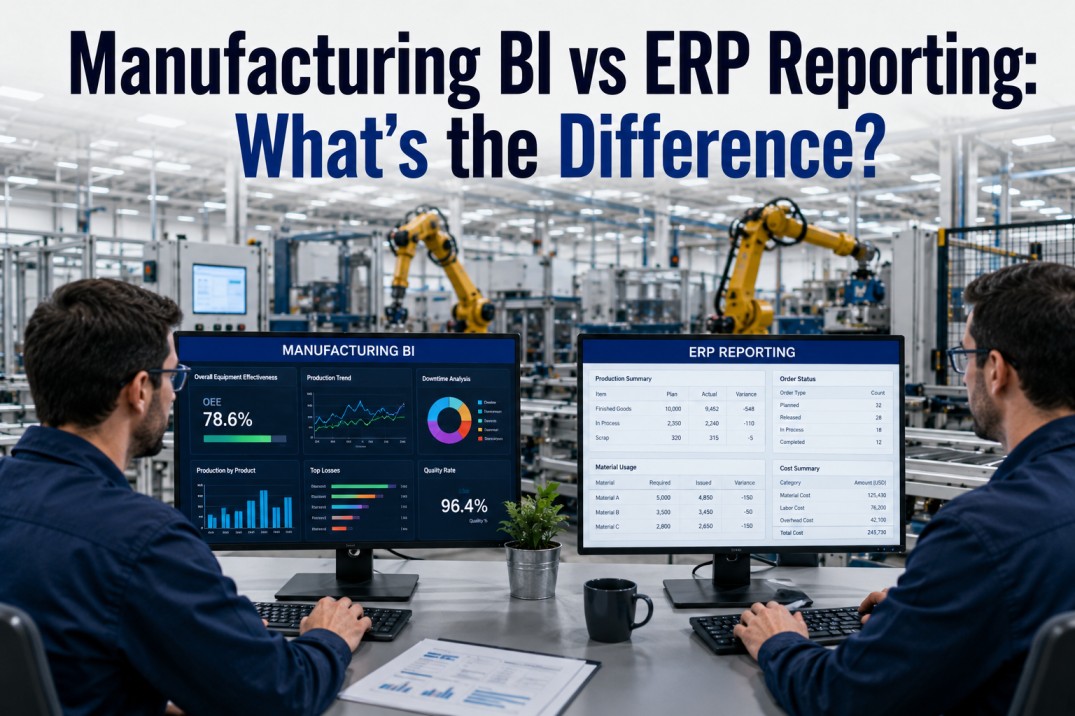
Manufacturing organisations rely on two distinct but overlapping reporting layers — ERP reporting for transactional accuracy and compliance, and BI reporting for cross-source analytics and decision support....

Manufacturing plants generate massive volumes of time-series data from hundreds of sensors, PLCs, SCADA systems, MES platforms, and quality stations every second. Buried in that data are the early signatures of...
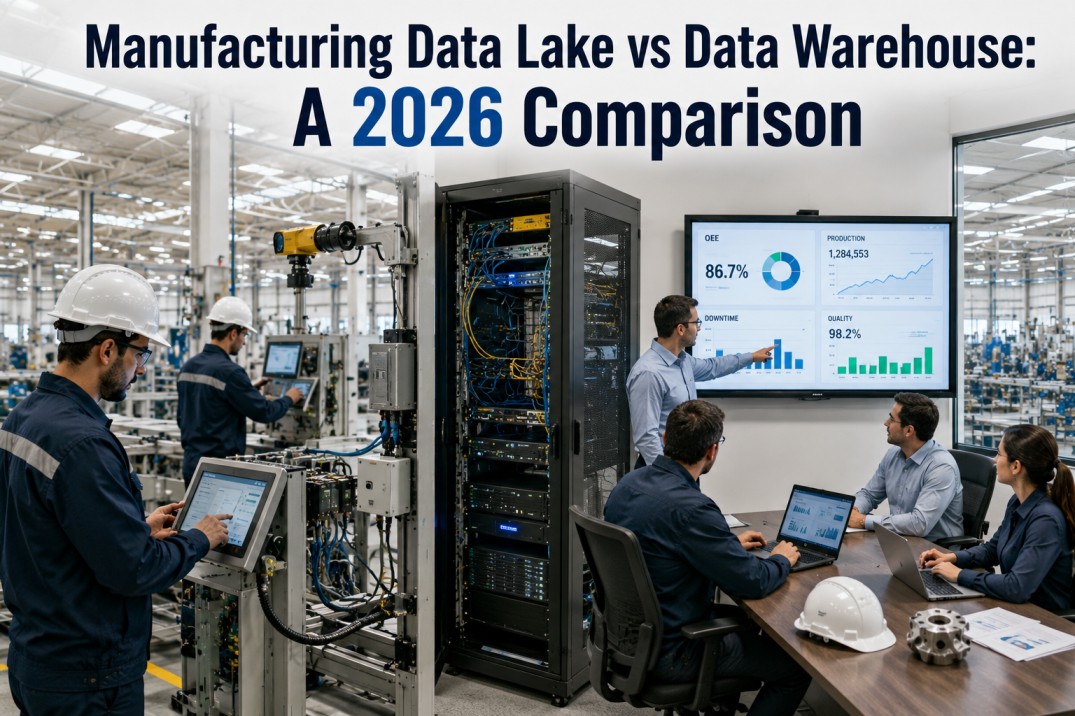
Manufacturers today generate more data than ever — from PLCs and SCADA systems on the plant floor to ERP, MES, CMMS, and quality systems at the operations layer. The question of where to store and process this...
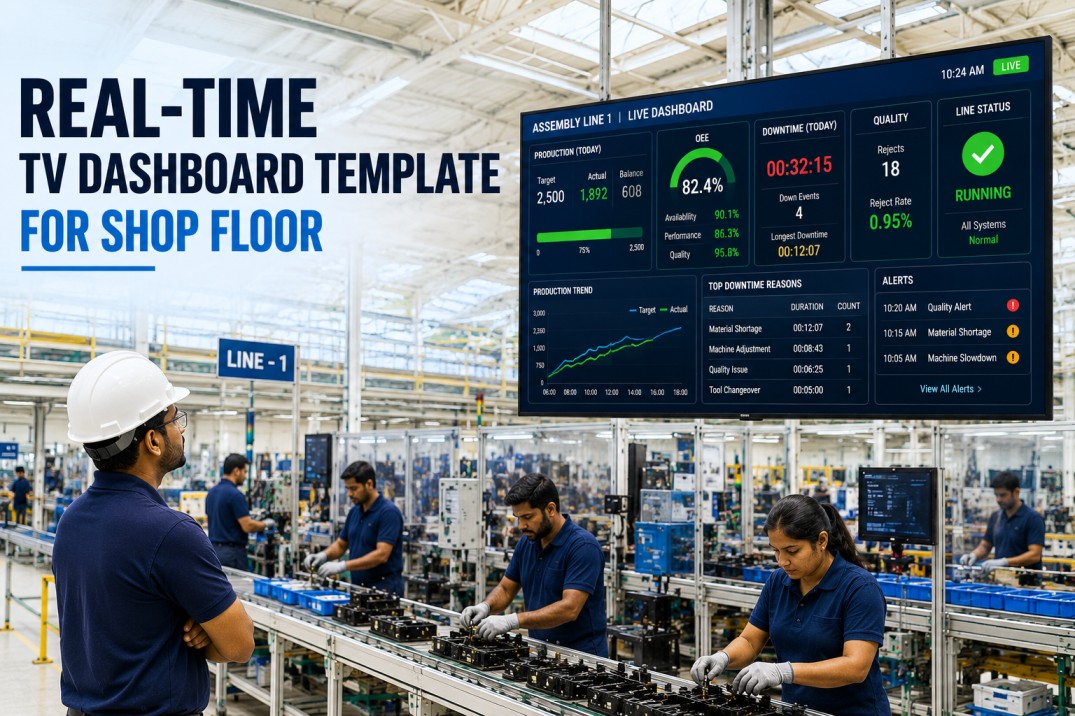
A shop floor TV dashboard template is purpose-built for the unique demands of the manufacturing environment: it must be readable from across a production cell, understood in under three seconds, and updated in...

A manufacturing KPI tree template is the single most effective tool for aligning plant-floor metrics with strategic business objectives. Instead of a flat list of disconnected KPIs — the kind that clutters...
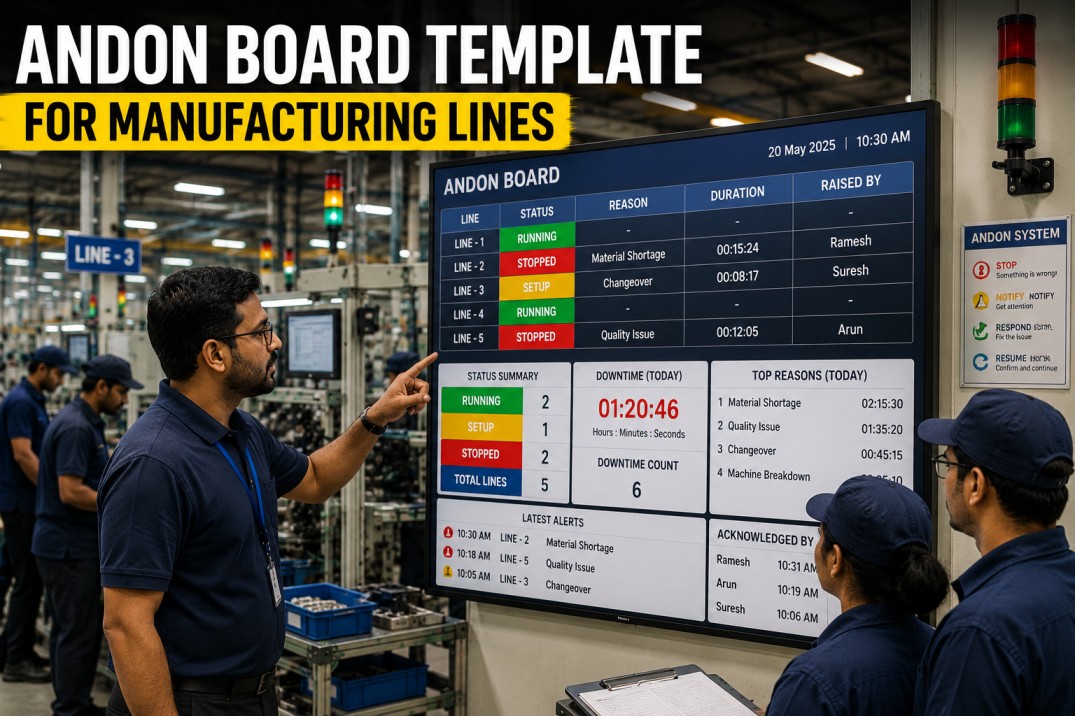
An andon board template is the operational nerve centre of any lean manufacturing line. Originating from the Toyota Production System, the andon system gives every operator the authority to stop the line when a...
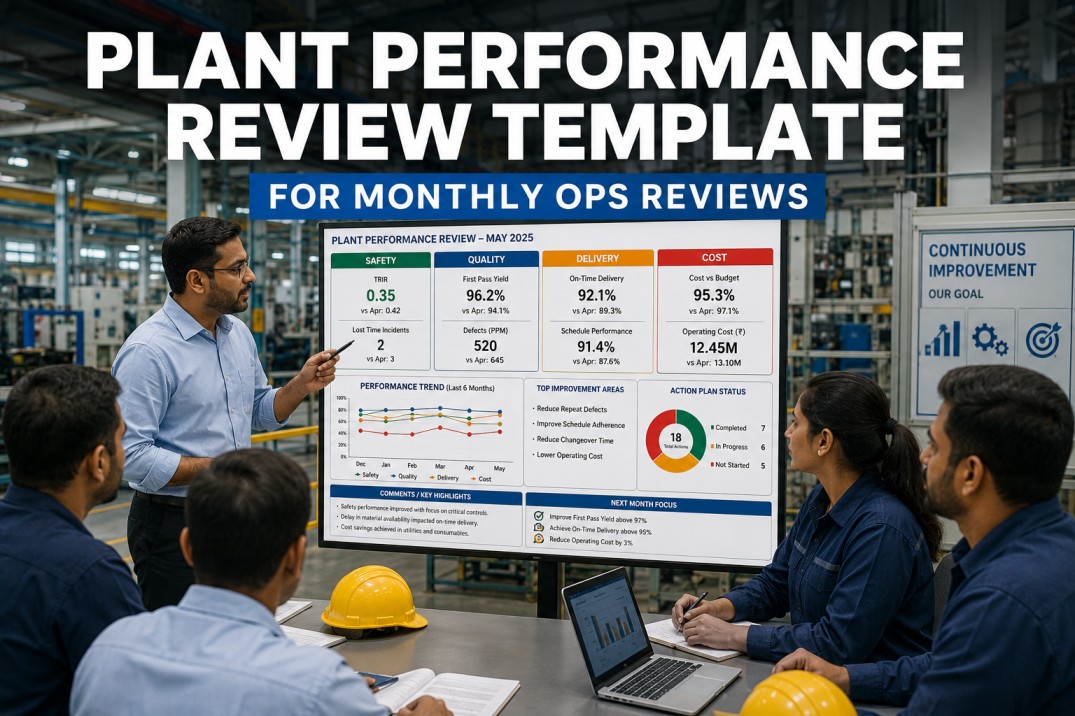
Every plant manager knows the feeling: it's the last week of the month, and someone's pulling together the ops review from five different spreadsheets, three email threads, and a production log that hasn't been...
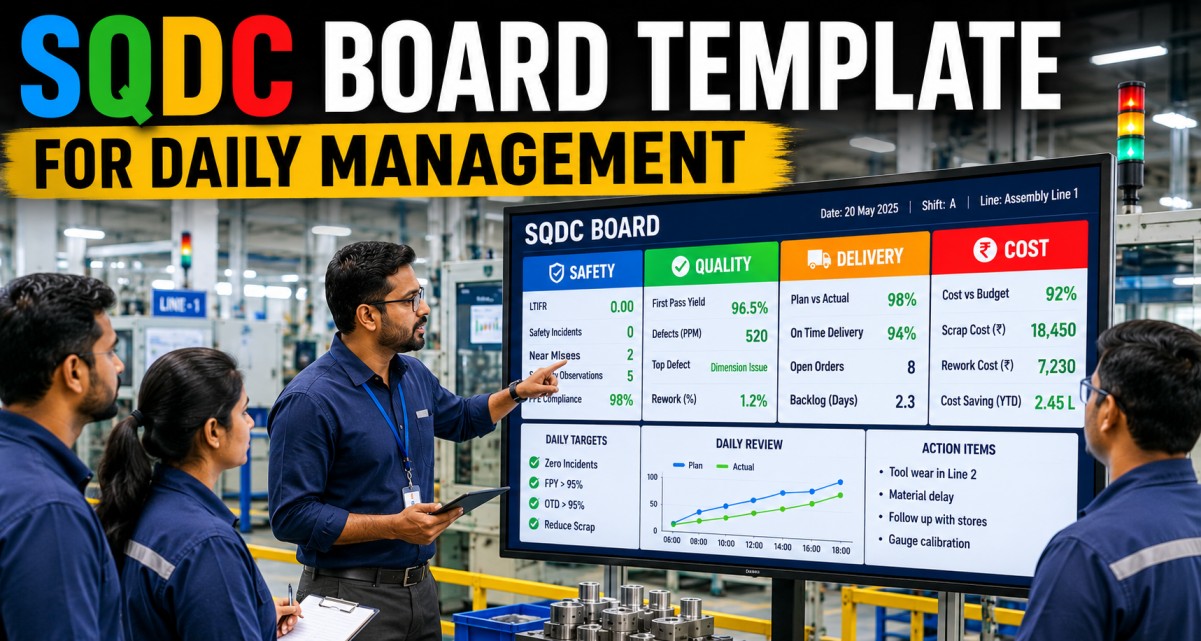
An SQDC (Safety, Quality, Delivery, Cost) board is the cornerstone of lean daily management in manufacturing. Originating from the Toyota Production System, the SQDC board provides a single visual summary of how...
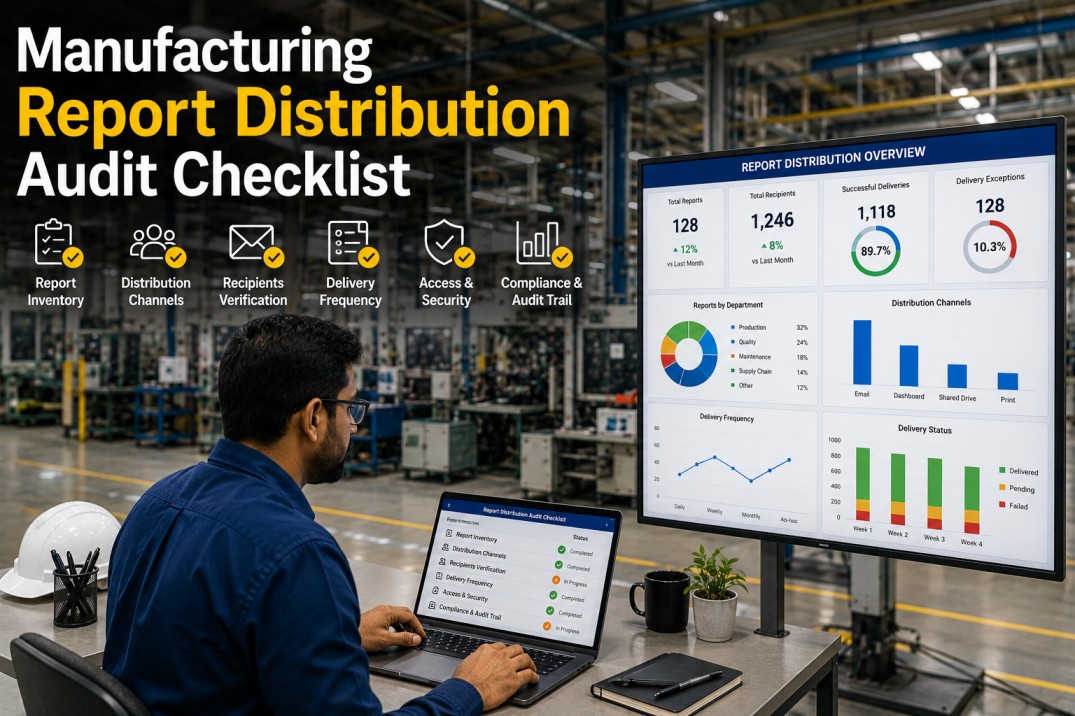
A manufacturing report distribution audit checklist helps plant operations, IT, and analytics teams systematically assess how production reports are delivered across the organisation — covering channels,...
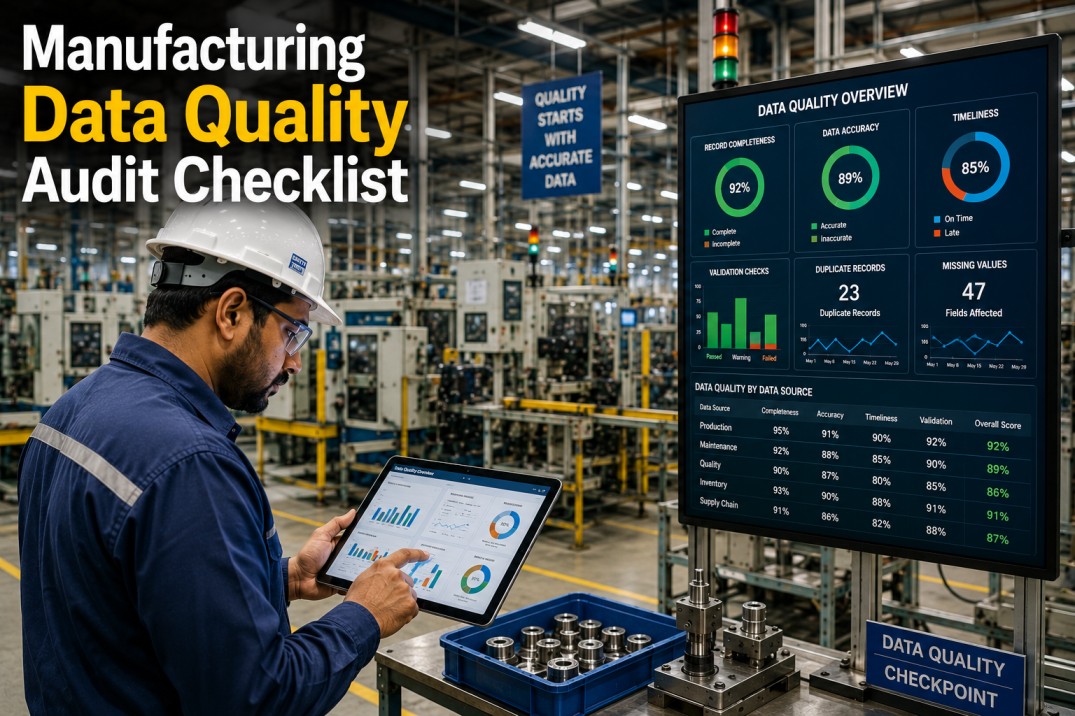
A manufacturing data quality audit checklist helps operations and IT teams systematically assess the completeness, accuracy, timeliness, consistency, validity, and uniqueness of production data across all source...
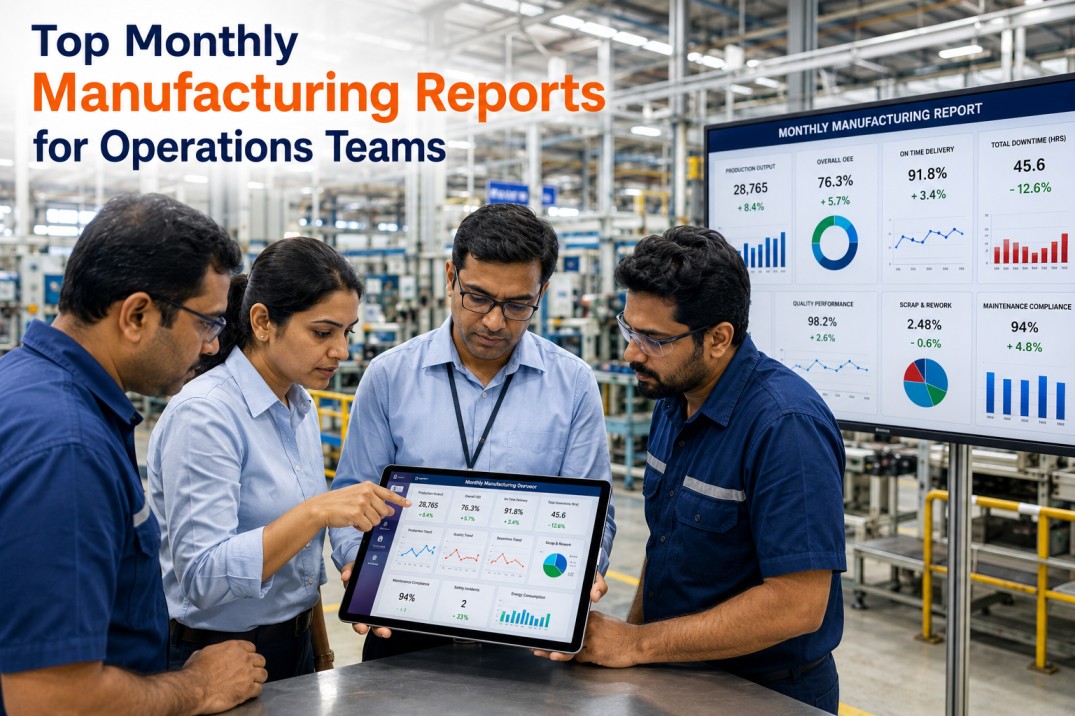
A structured monthly manufacturing report strategy ensures operations teams have timely visibility into OEE, production volume, scrap costs, energy consumption, and quality metrics — without drowning in ad-hoc...
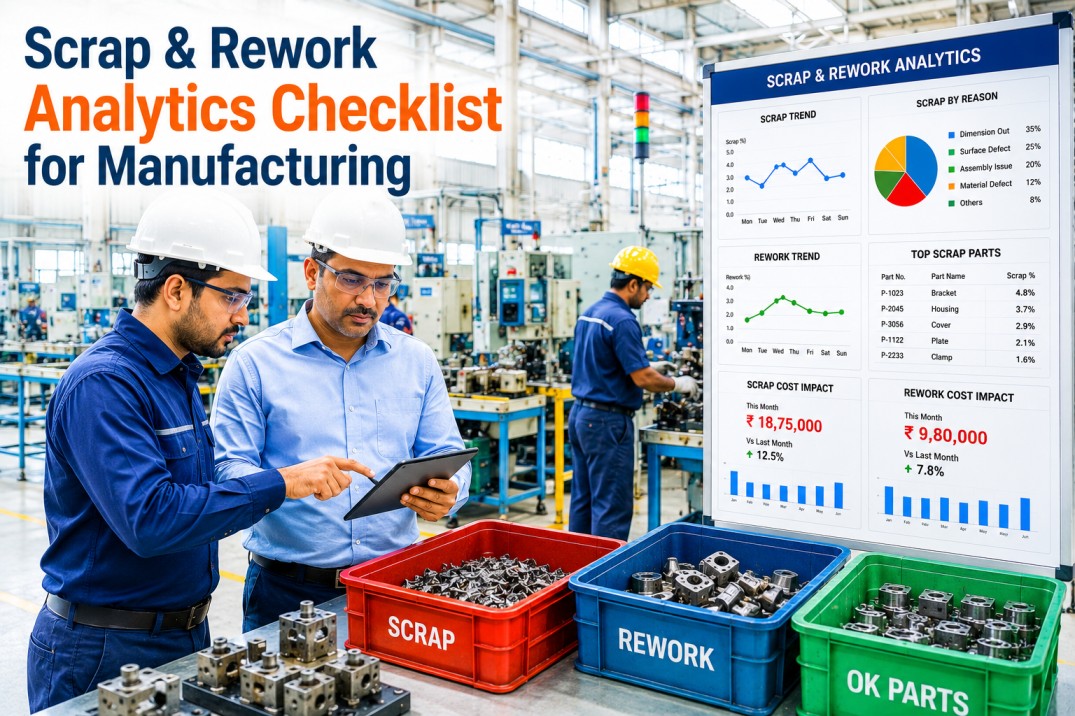
A scrap and rework analytics checklist helps manufacturing teams systematically track, categorise, and reduce material waste and rework labour across production lines. Without dedicated scrap reason codes, cost...
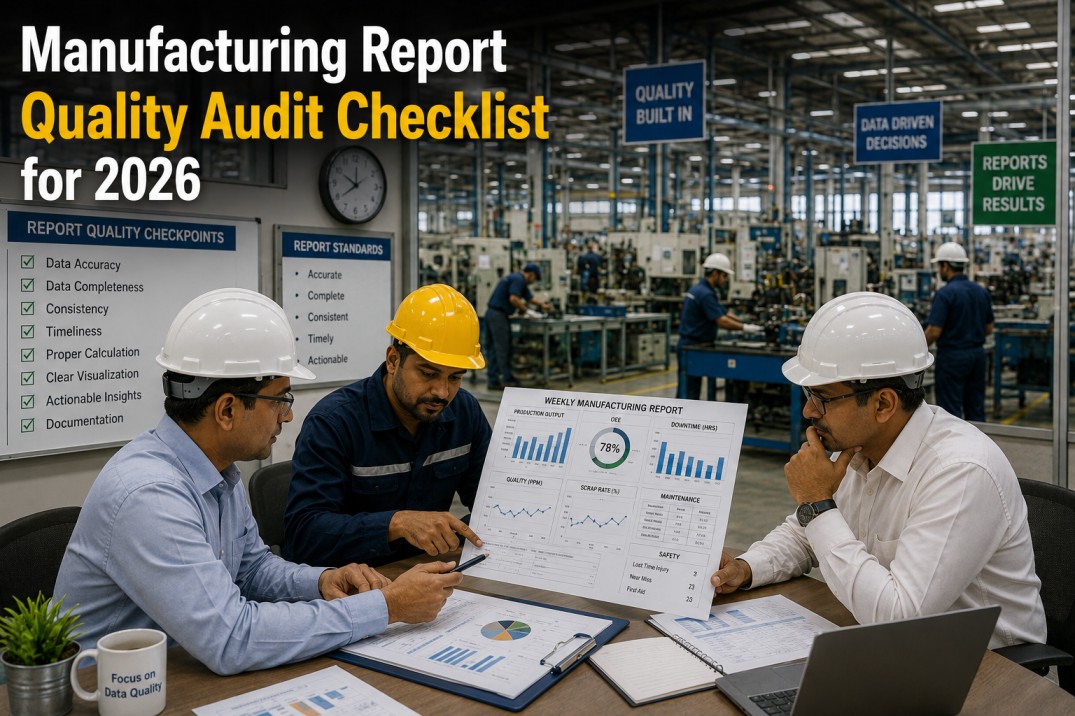
Manufacturing reports are only valuable when decision-makers trust the data they contain. But trust erodes quickly when reports contain calculation errors, stale data, missing context, or conflicting metrics...
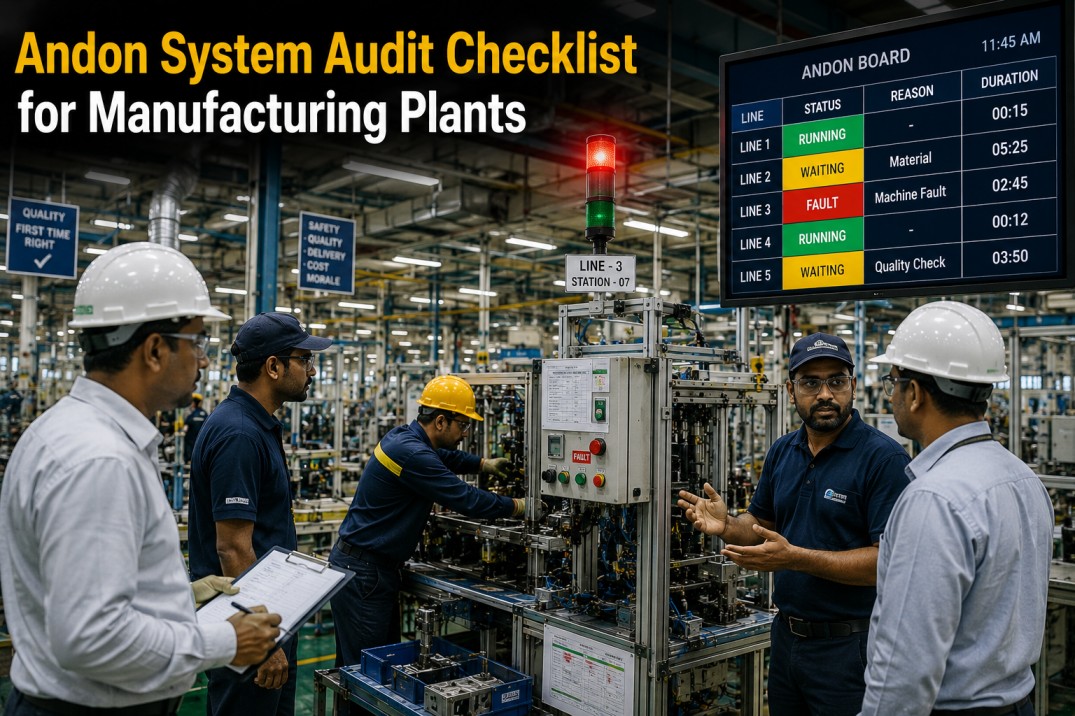
An andon system is the nervous system of a manufacturing plant — connecting operators, supervisors, and support teams through visual alerts and structured escalation. But an andon system that isn't audited...
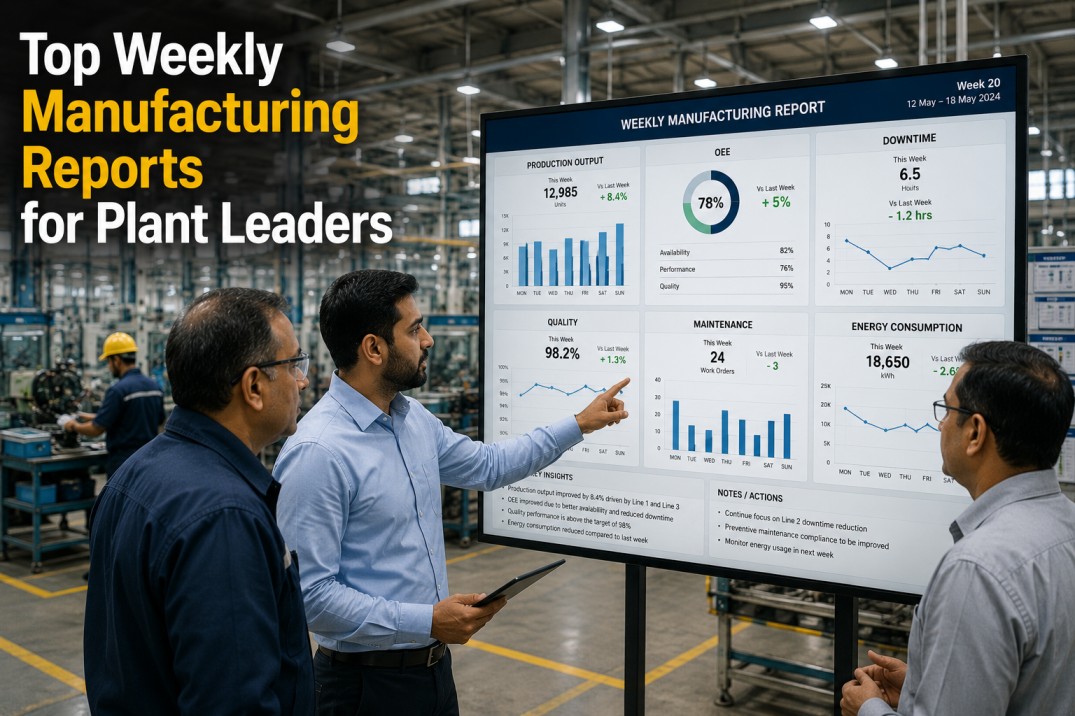
Plant leaders rely on weekly manufacturing reports to track performance, spot trends, and make decisions before small problems become costly issues. But with dozens of possible reports, which ones actually drive...
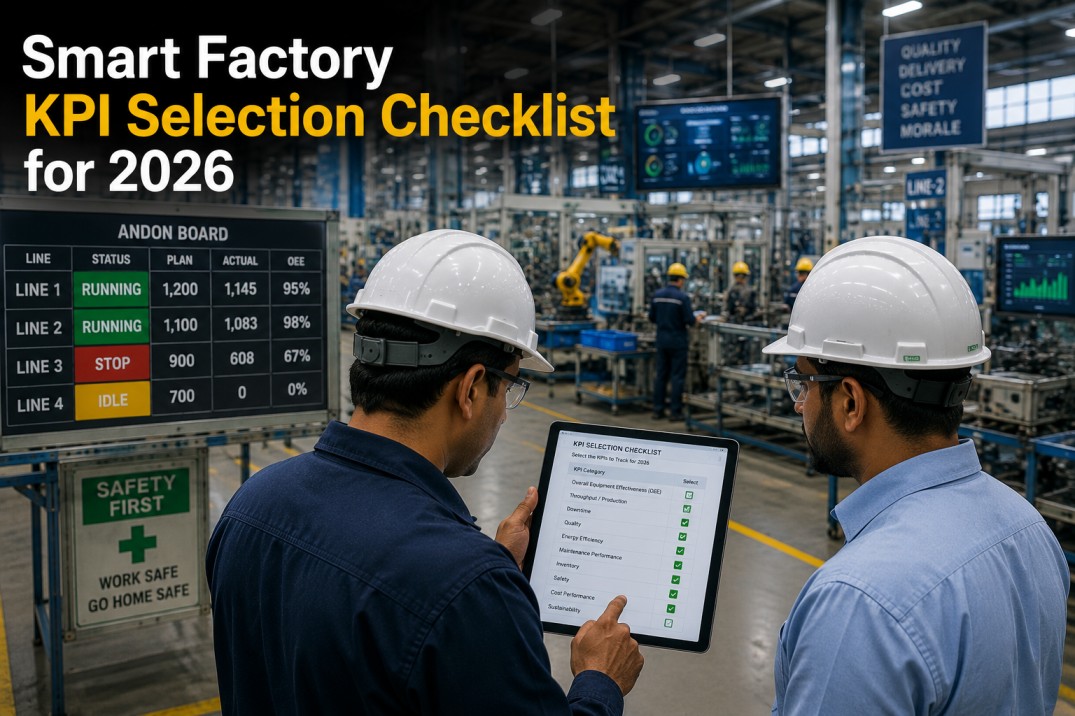
Selecting the right KPIs for a smart factory is harder than collecting data. Most plants deploy 40+ metrics but only use 6–8 for decisions. The rest become dashboard wallpaper — consuming screen space...

Most manufacturing plants have invested in visual management — whiteboards, digital displays, andon lights — but few have a structured process to audit whether those tools actually drive performance. Boards...
.jpg)
Most U.S. manufacturers review energy costs monthly — on an invoice. By then, the waste has already happened.
If your plant runs energy-intensive processes — metal fabrication, food processing,...

A shift performance report checklist helps manufacturing supervisors capture every critical metric at shift end — production output, OEE, scrap rates, quality incidents, and safety events. Without a...
A yield tracking checklist helps production teams monitor first-pass yield, rolled throughput yield, and scrap rates across every manufacturing stage. Without systematic yield tracking, plants lose visibility...

Quality reporting in manufacturing goes beyond collecting defect counts — it requires a structured framework that tracks first-pass yield (FPY), defective parts per million (DPPM), non-conformance reports...

Sisense has long been a popular choice for business intelligence across industries, but manufacturers evaluating analytics platforms in 2026 are increasingly looking for alternatives that offer deeper...

Manufacturing analytics platforms are increasingly available in both cloud and on-premise deployment models, and the choice between them has become one of the most consequential decisions plant IT and operations...

Electric vehicle and battery gigafactories operate at a scale that demands a fundamentally different approach to manufacturing analytics. With production lines pushing millions of cells per year, yield losses...

Automotive Tier 1 and Tier 2 suppliers operate under the most demanding quality and delivery expectations in manufacturing. With IATF 16949 certification as a baseline, customers require flawless PPAP...

Pharmaceutical manufacturers operate under the most stringent regulatory framework in industrial production — cGMP, 21 CFR Part 11, data integrity requirements, and evolving serialization mandates. While most...

Maintenance teams in manufacturing are caught between two pressures — production demands for maximum uptime and management expectations for cost control. Yet most maintenance departments still rely on...

Food and beverage manufacturers face a unique convergence of pressures in 2026: FSMA 204 traceability mandates, wafer-thin margins averaging 3–5%, and the operational complexity of managing perishable goods...

Manufacturing dashboard templates are not one-size-fits-all — an operator monitoring shift production needs a fundamentally different view than a COO tracking enterprise-wide OEE trends. Yet most analytics...

A 5-why root cause template is the most effective tool a maintenance team can use to prevent recurring downtime. Without a structured template, root cause analysis is inconsistent — one shift supervisor asks...
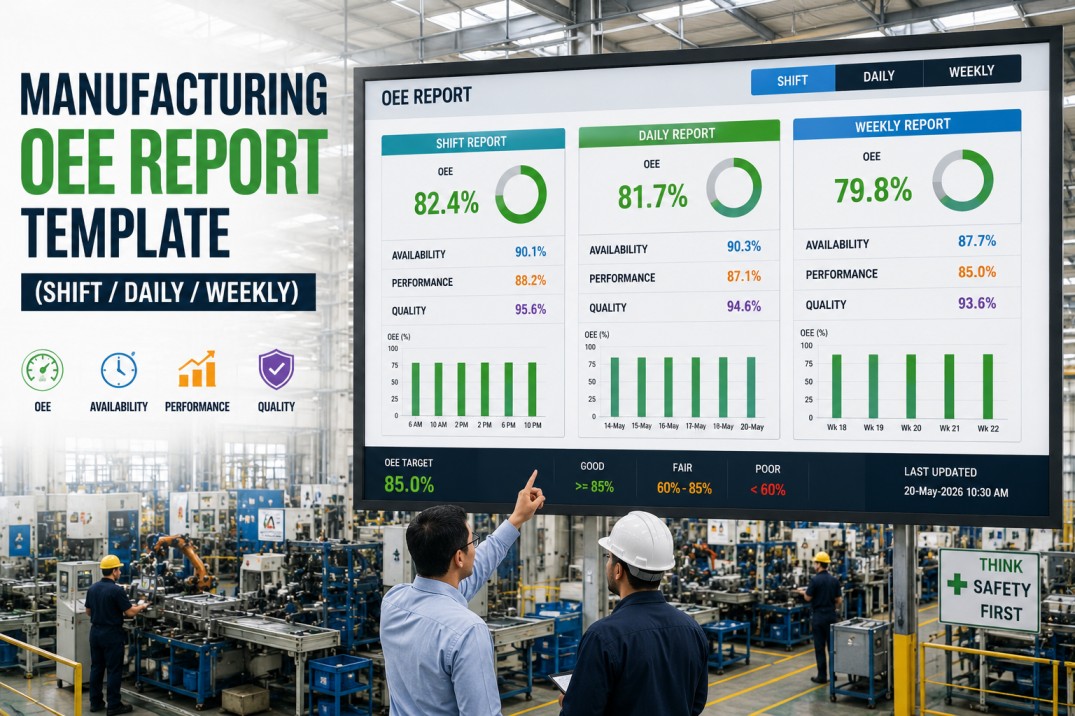
An OEE report template is the most requested analytics deliverable in any manufacturing plant — yet most plants still build theirs from scratch every shift. The shift supervisor copies numbers from the...
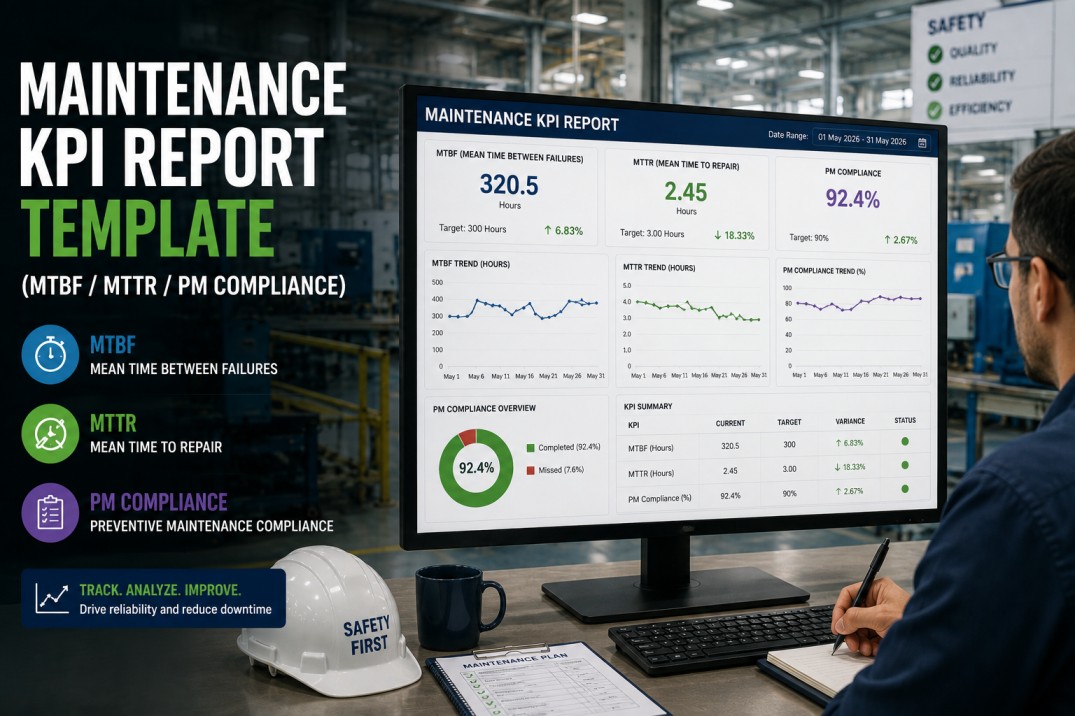
A maintenance KPI report template is the foundation of every world-class reliability program. Without a standardized template that tracks MTBF, MTTR, PM compliance, and backlog in one place, maintenance leaders...
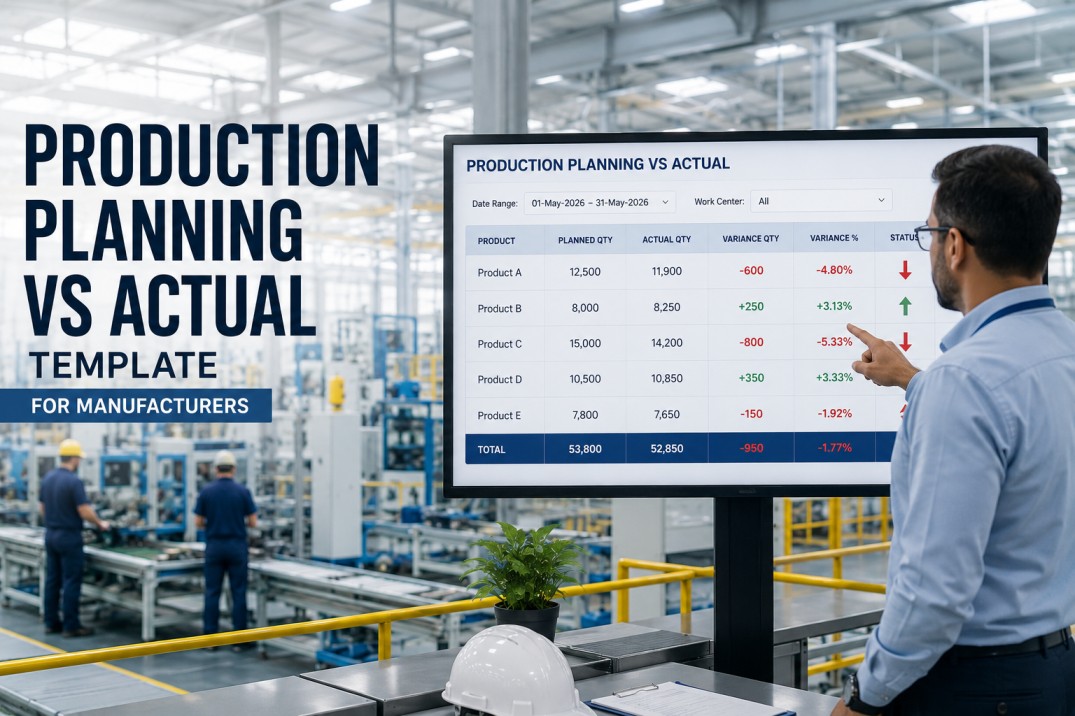
A production planning vs actual template is the most essential tool in a plant manager's analytics stack. It answers the single question that every production review meeting starts with: did we make what we...
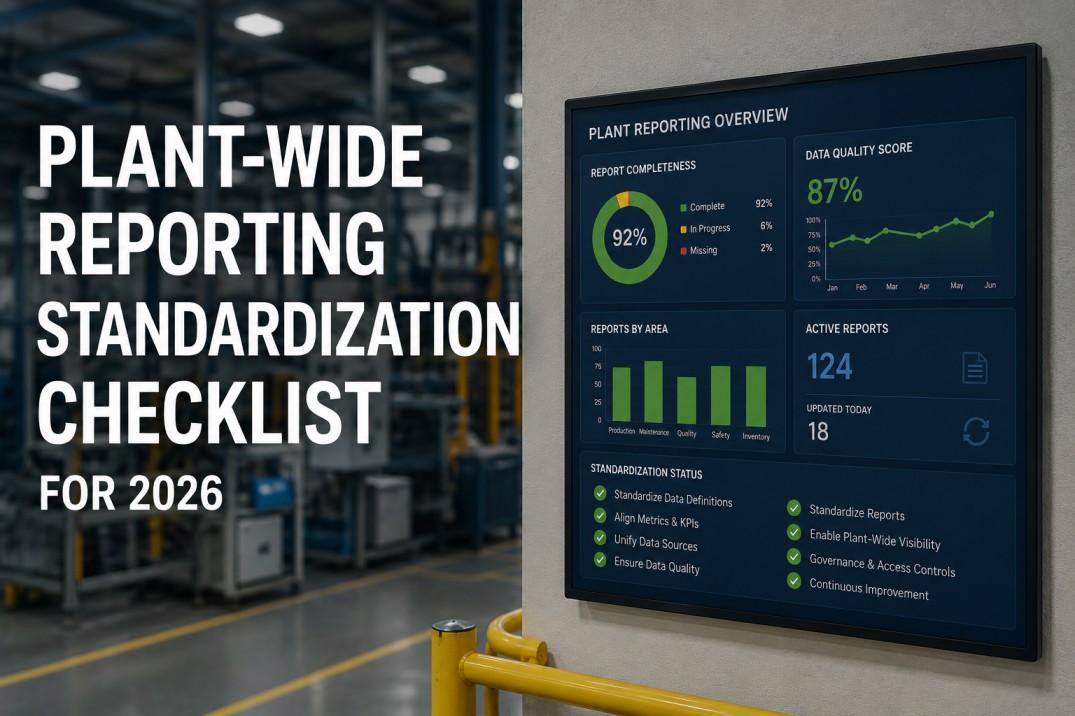
Plant-wide reporting standardization is the single highest-leverage initiative a multi-plant manufacturer can undertake in 2026. When every site reports OEE, downtime, and quality using the same KPI definitions,...
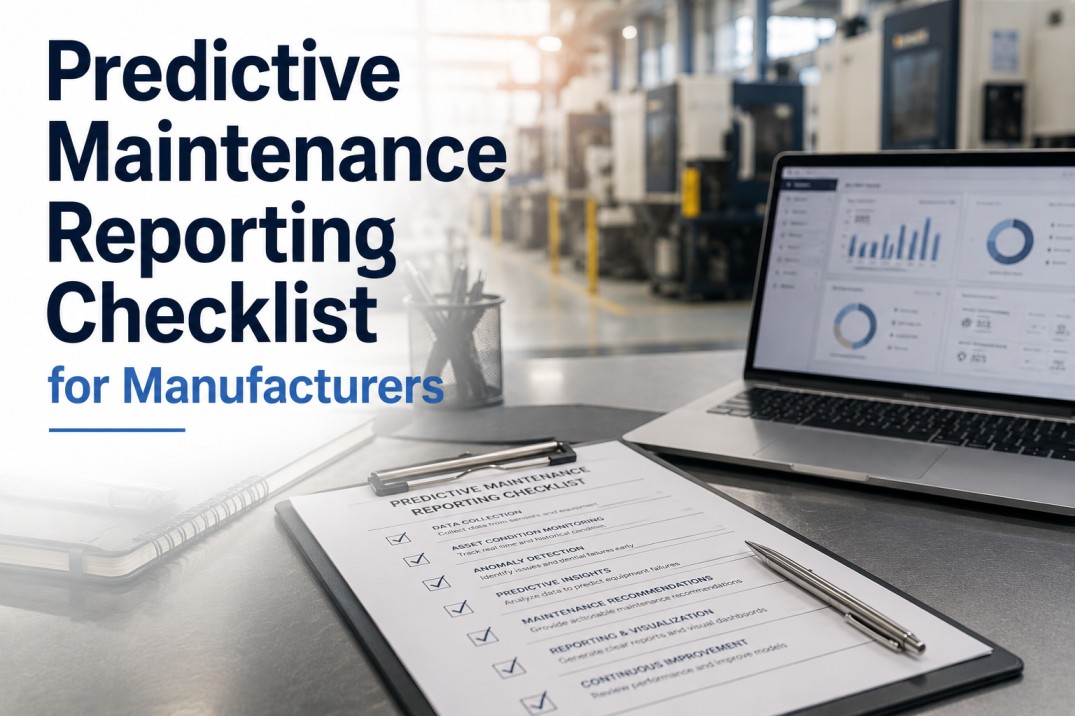
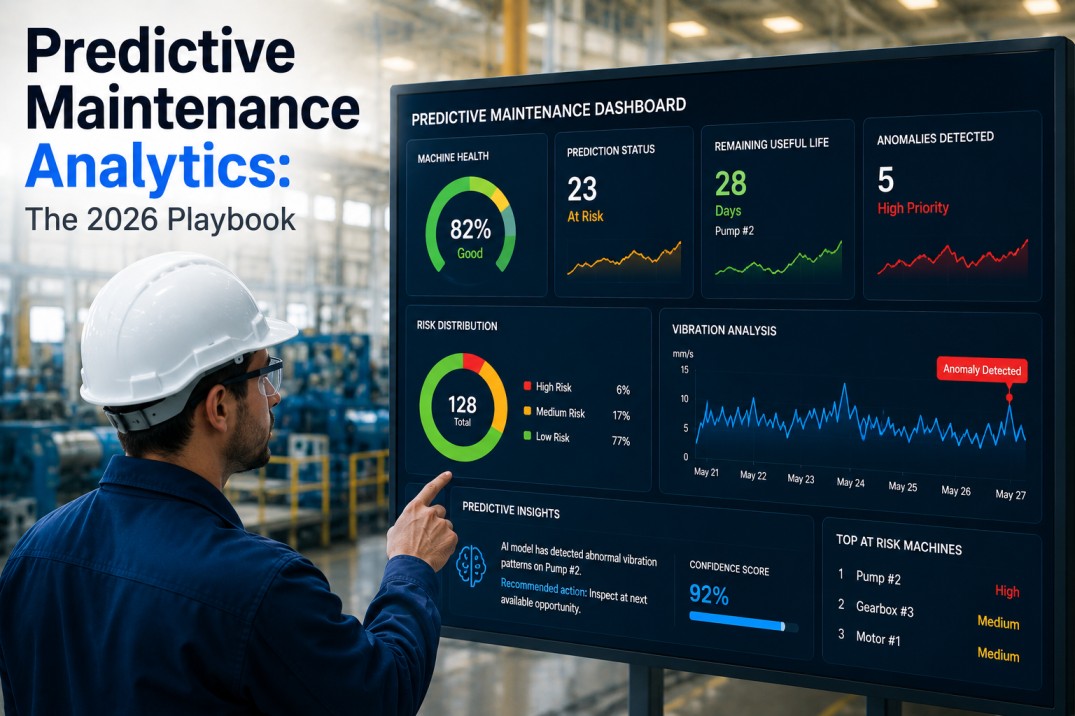
A predictive maintenance reporting checklist helps maintenance and operations teams ensure their PdM program captures the right data, delivers actionable insights, and demonstrates measurable ROI. Without a...
.jpg)
Since Toyota introduced the concept in the 1960s, andon has been the backbone of lean manufacturing — a real-time alert system that signals problems the moment they occur. But the traditional physical andon...
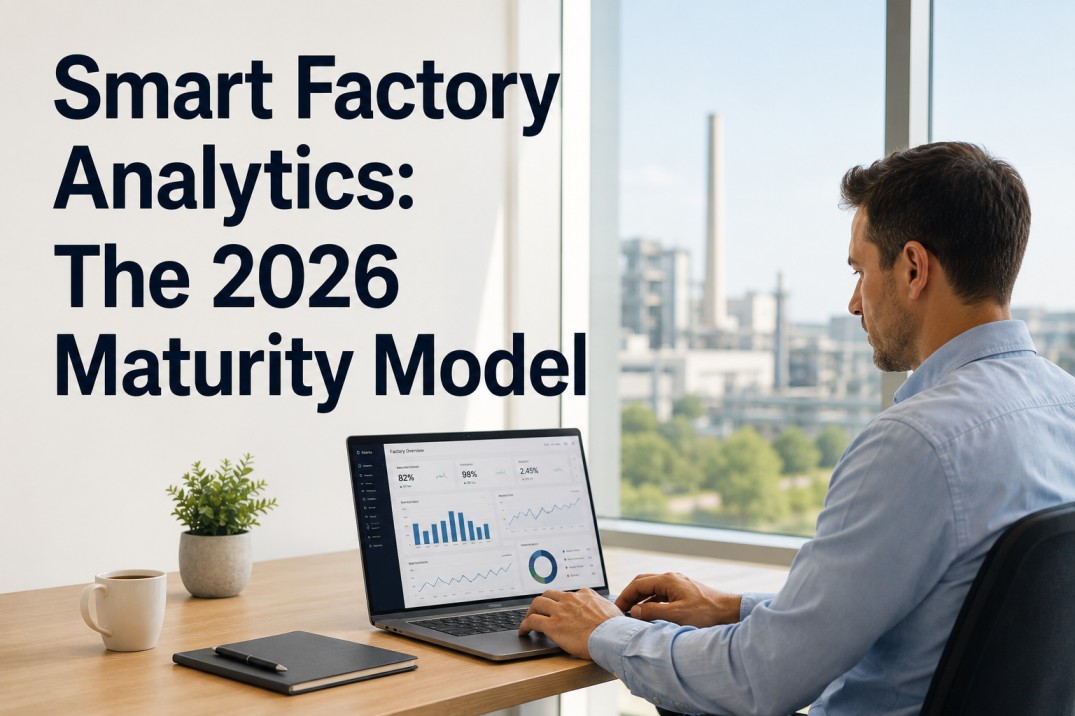
The term "smart factory" gets used broadly, but the reality is that analytics maturity varies enormously across US manufacturing plants. Some facilities run real-time dashboards with machine learning alerts;...
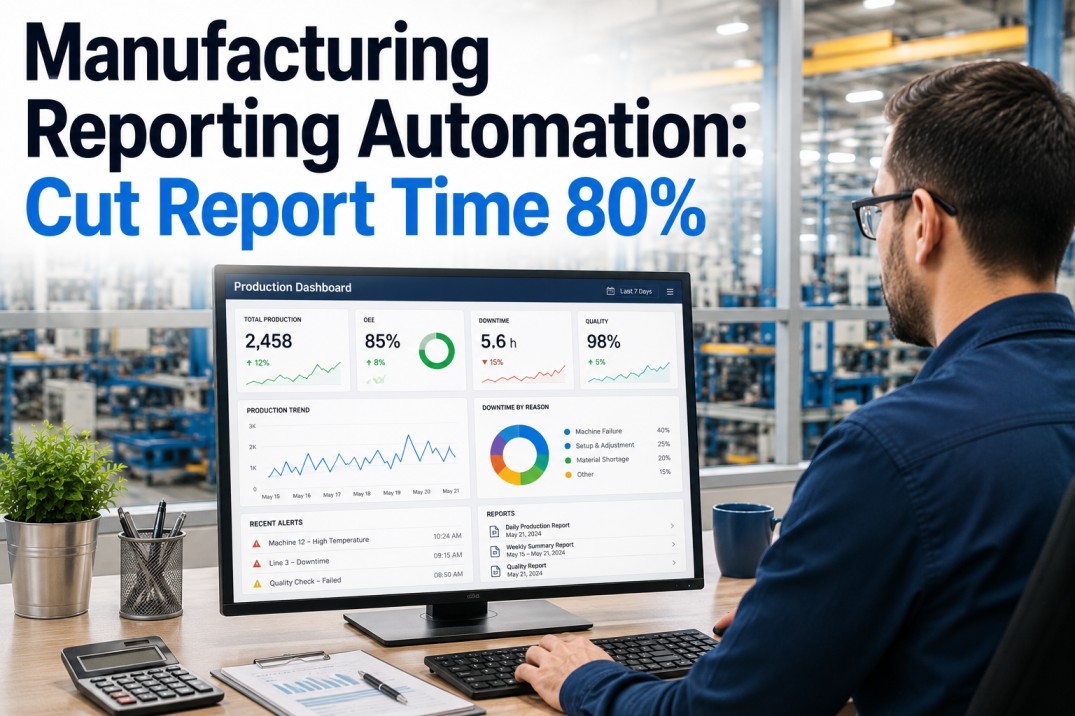
Manufacturing teams spend an estimated 30–40% of their week creating, formatting, and distributing reports instead of analyzing them. The data is already in your MES, ERP, and SCADA systems — but pulling it...
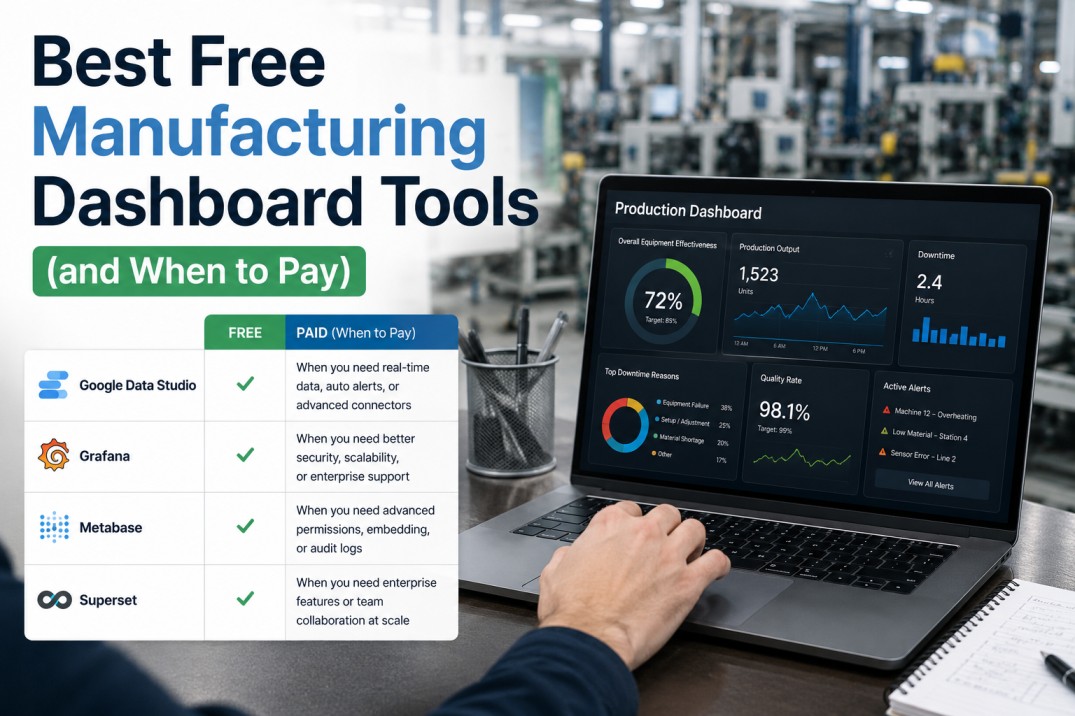
Free manufacturing dashboard tools look irresistible on paper: zero license cost, full code access, no vendor lock-in. GitHub hosts dozens of open-source OEE dashboards, Grafana stacks, and lightweight MES...

Every plant floor generates data every second — machine states, OEE scores, stop events, cycle times. The question isn't whether to capture it. It's how often the right person should see it, in what form, and...

Edge analytics processes data on the plant floor instead of sending it to the cloud. The shift is driven by latency requirements for real-time quality control, bandwidth costs for high-frequency sensor data, and...

Manufacturing analytics is evolving faster than at any point in the past decade. Five trends are reshaping how plants collect, process, and act on data: generative AI moves from experimentation to structured...

Industrial IoT analytics is the pipeline that turns raw sensor voltages into plant-floor decisions. A vibration sensor on a motor generates 86,400 data points per day. A single production line with 200 sensors...

The best plant managers scan a consistent set of KPIs every morning before the first production meeting. The numbers that matter most fall into five categories — safety, production, quality, cost, and people...

Generative AI in manufacturing analytics generated intense hype through 2024 and 2025. By mid-2026, the picture is clearer: large language models are not replacing traditional analytics, but they are adding...

Predictive analytics in manufacturing has moved from theoretical to operational. Factory teams are using machine learning models — pre-trained on thousands of production hours — to forecast equipment...
Manufacturing teams generate dozens of reports every week — production summaries, shift handovers, OEE scorecards, scrap analysis, maintenance compliance, energy consumption, and more. In most plants, these...

Every dollar of quality cost in a manufacturing plant follows one of four paths: prevention, appraisal, internal failure, or external failure. The difference between plants that control quality costs and those...

A manufacturing scorecard template that tracks safety, quality, delivery, and cost in a single operational view is the difference between managing a plant by instinct and leading it with data. The SQDC framework...
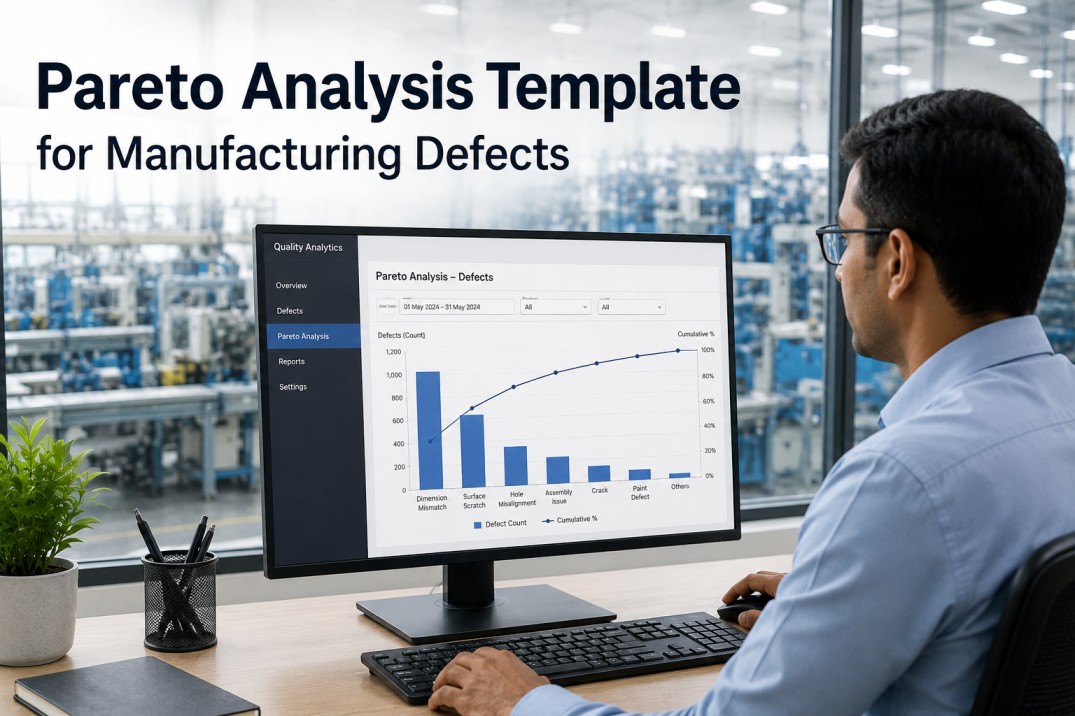
A Pareto analysis template for manufacturing defects transforms raw inspection and downtime data into a ranked priority list that directly answers the question every plant manager asks: which defects should we...

A maintenance report template that consolidates MTBF, MTTR, PM compliance, and backlog into a single operational view is the difference between guessing what happened on the plant floor and knowing exactly where...

Most manufacturing dashboards fail. Not because the data is wrong — but because the design, layout, and KPI selection don't match how plant teams actually make decisions. A dashboard that looks great in a...

A plant manager's daily dashboard is the single most important screen in a manufacturing plant — yet most plant managers spend the first hour of their day hunting for data across email, spreadsheets, and...

Energy and utility costs represent 5–15% of total manufacturing operating expenses, yet most plants lack a structured approach to energy analytics. Without metering-grade data at the process level, energy...
Energy and utility costs represent 5–15% of total manufacturing operating expenses, yet most plants lack a structured approach to energy analytics. Without metering-grade data at the process level, energy...
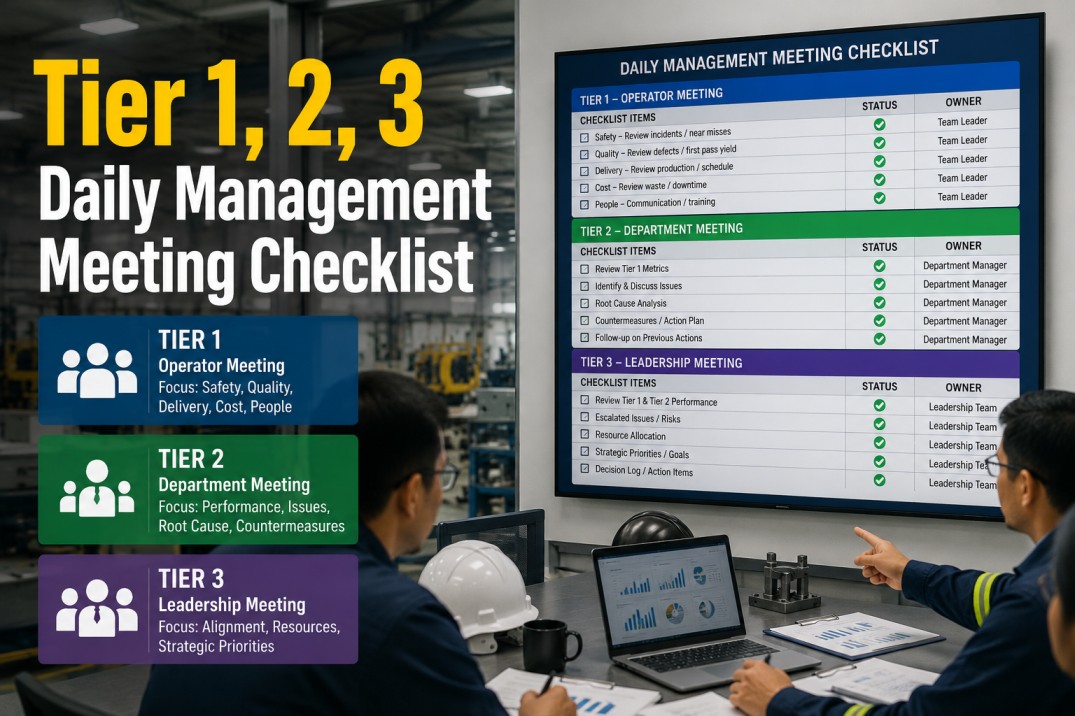
Tier 1, 2, and 3 daily management meetings are the backbone of operational control in manufacturing plants — yet most plants lack a structured checklist for what each tier should cover. Tier 1 meetings focus...

A real-time dashboard audit is the difference between a shop floor that acts on data and a shop floor that ignores the screens on the wall. Most manufacturing plants have invested in dashboard displays — TVs...
Cycle time tracking is the single most actionable metric on a production line, yet most plants track it wrong — or don't track it at all. Operators record cycle times on paper clipboards. Spreadsheets...
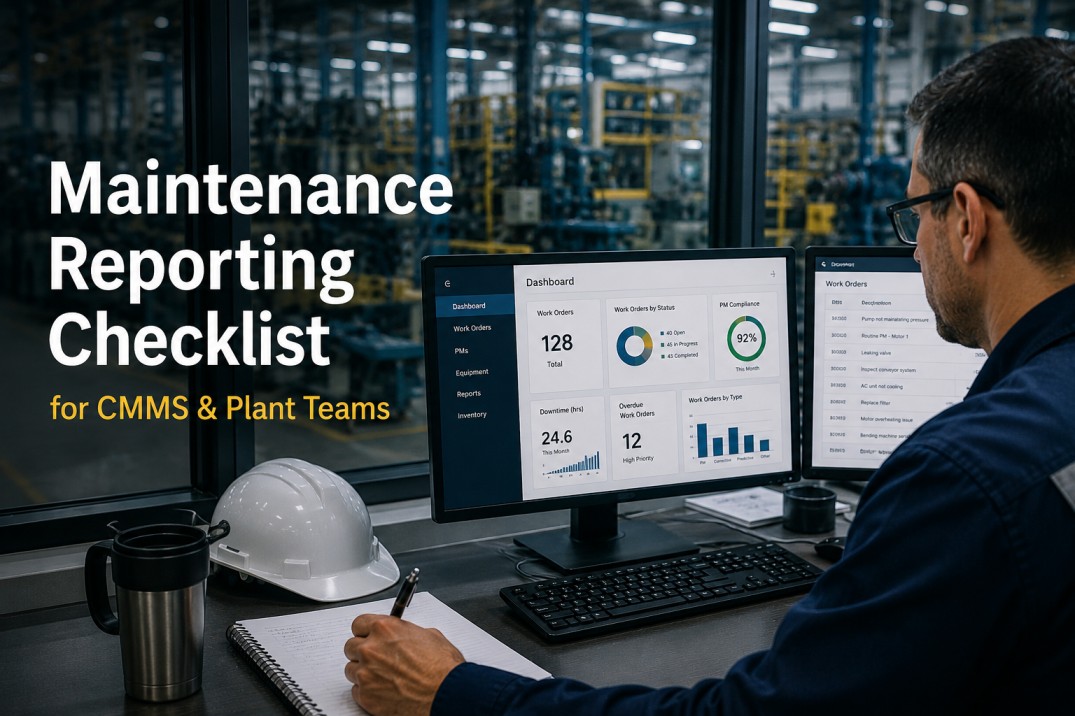
Maintenance reporting is the difference between a reactive firefighting culture and a reliability-driven organisation — yet most plant maintenance teams report only what broke and what was fixed. A complete...

Data collection is the foundation of manufacturing analytics, yet most plants collect less than 40% of the data they could be using. PLCs stream cycle times but not energy consumption. MES tracks work orders but...

An SPC dashboard checklist is the difference between control charts that catch shifts before they create scrap and charts that just decorate a monitor. Most plants attempt to deploy SPC dashboards using Excel...

Predictive maintenance depends on data quality, not data quantity. A plant with three well-placed vibration sensors and clean historical failure records will outperform a plant with fifty uncalibrated sensors...

Industry 4.0 analytics readiness is not about installing software. It is about whether your plant's operational technology, information technology, security posture, and workforce can support connected,...
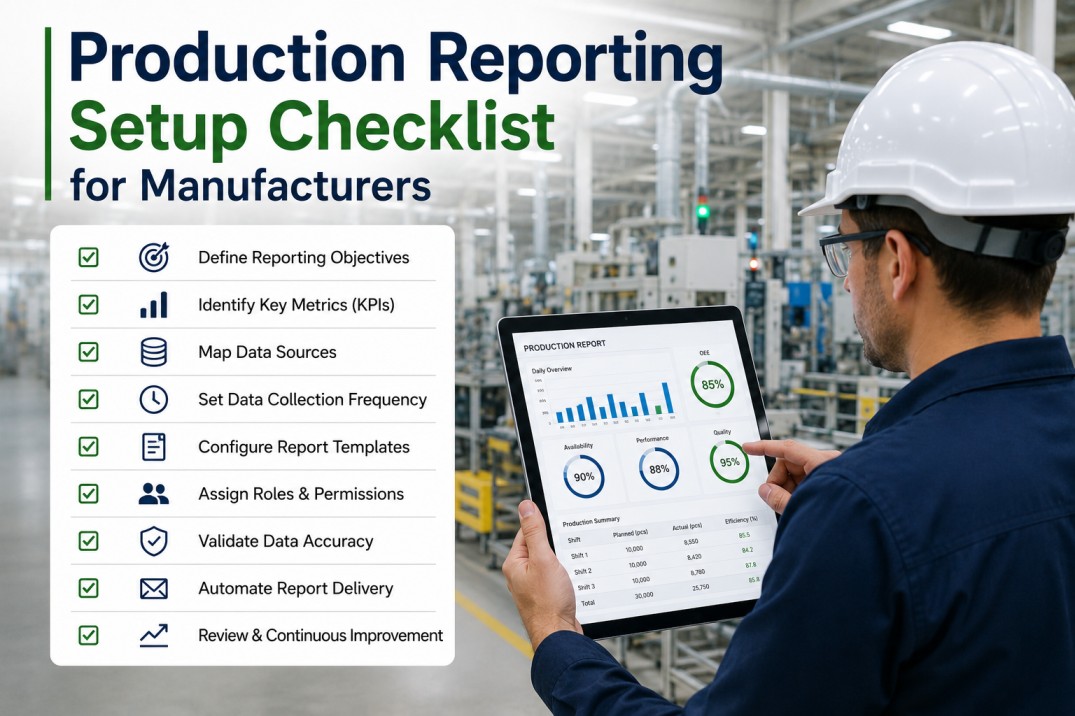
A production reporting setup checklist is the difference between reports that drive action and reports that get ignored. Most manufacturing plants attempt to build reports in Excel, BI tools, or ERP modules...

Choosing a manufacturing analytics platform in 2026 means choosing between three fundamentally different architectures: iFactory's full-stack AI-native platform, Tulip's no-code app-builder approach, and Seeq's...
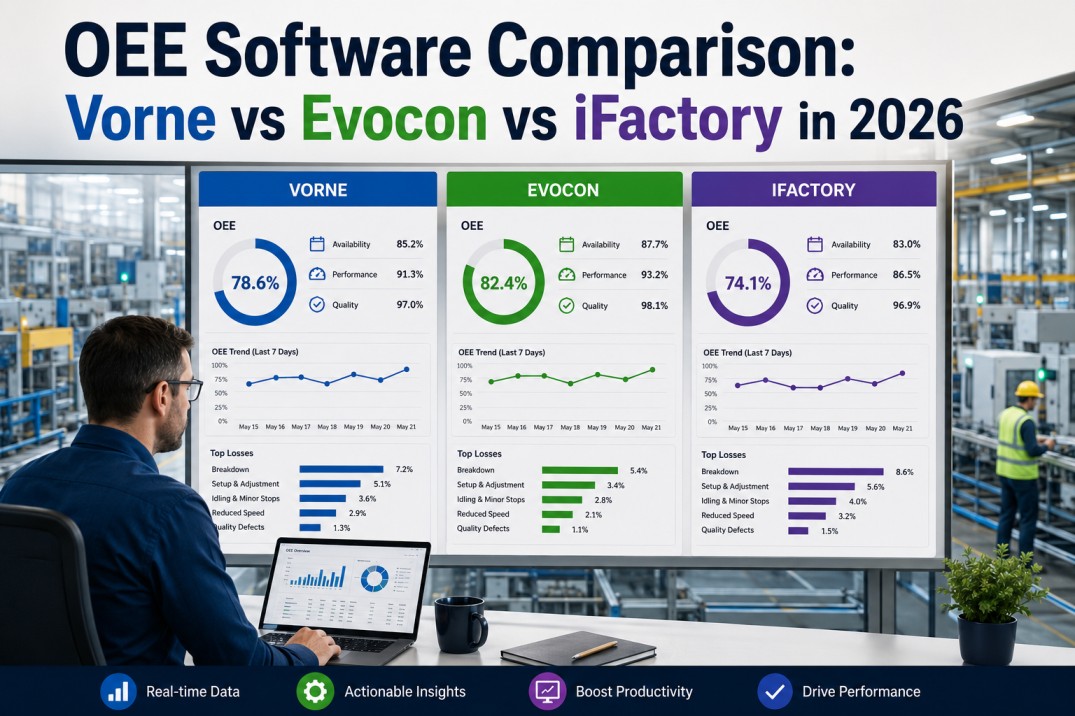
Choosing the right OEE software for your manufacturing plant comes down to matching each platform's strengths to your specific operational needs. Vorne, Evocon, and iFactory are three of the most frequently...
The question every manufacturer asks before investing in analytics is simple: what return will I actually get? Spreadsheet ROI models built on generic assumptions are not trustworthy because every plant's...
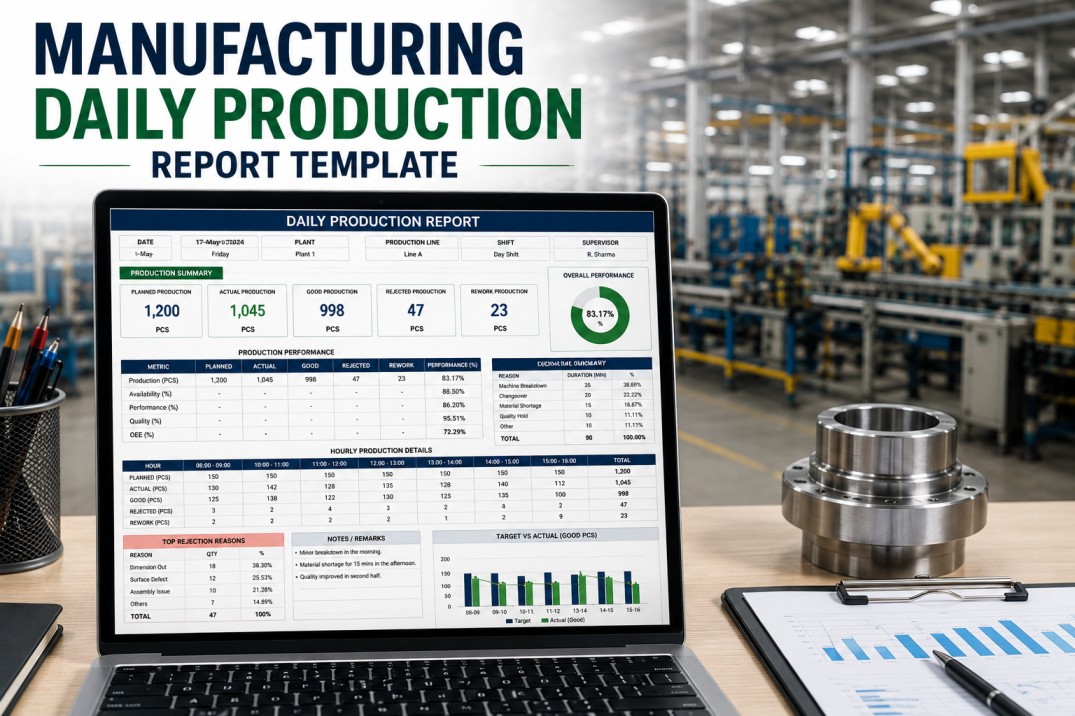
The daily production report is the single most reviewed document in any manufacturing plant. The morning stand-up starts with it. The plant manager relies on it to track shift performance. The supervisor uses it...
OEE is the one metric that tells you exactly how efficient your manufacturing operation really is. Unlike output alone — which can hide downtime, quality losses, and speed reductions — Overall Equipment...
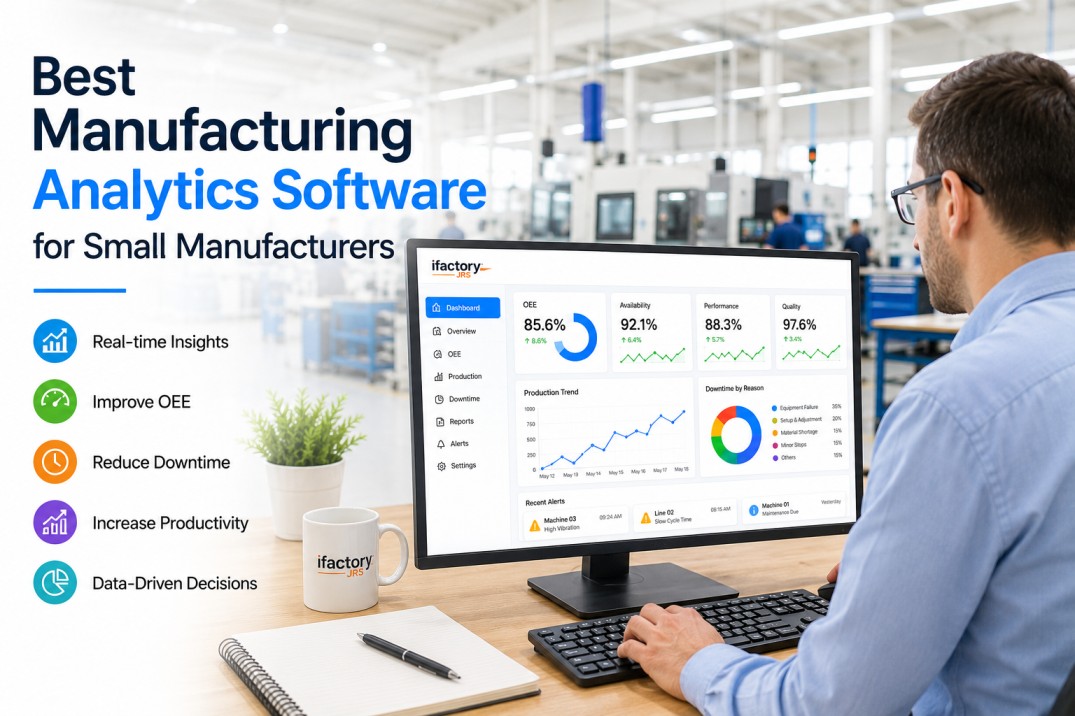
Small manufacturers face a software paradox. The enterprise analytics platforms that dominate the market require dedicated IT teams, six-figure annual contracts, and deployment timelines measured in quarters....
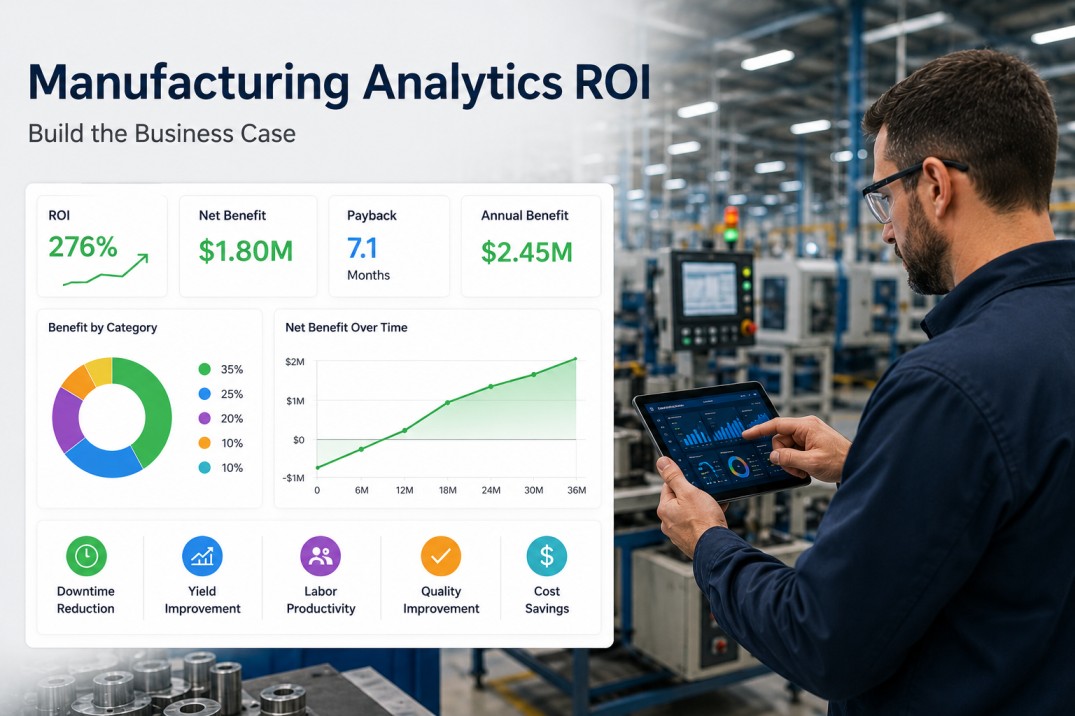
Every manufacturing analytics investment faces the same question in the approval meeting: where is the payback? The plant manager knows downtime is expensive. The operations director knows scrap rates erode...
Manufacturing dashboards have a shelf life problem. A plant deploys a new dashboard—pinned to the wall in the production office, visible during the morning stand-up, celebrated as a step toward digital...

3 min read Most plants track OEE, but most plants cannot tell you exactly where the 40 to 60 percent of planned production time goes. The Six Big Losses framework — developed by the...
Every hour of unplanned downtime costs manufacturers an average of $260,000 across discrete industries and up to $2.3 million in automotive production. Yet 82% of plants still rely on calendar-based preventive...
The manufacturing analytics market has reached an inflection point. In 2025, the global market crossed $12.1 billion and is projected to hit $62 billion by 2035, growing at 17.8% CAGR. But here is what the...
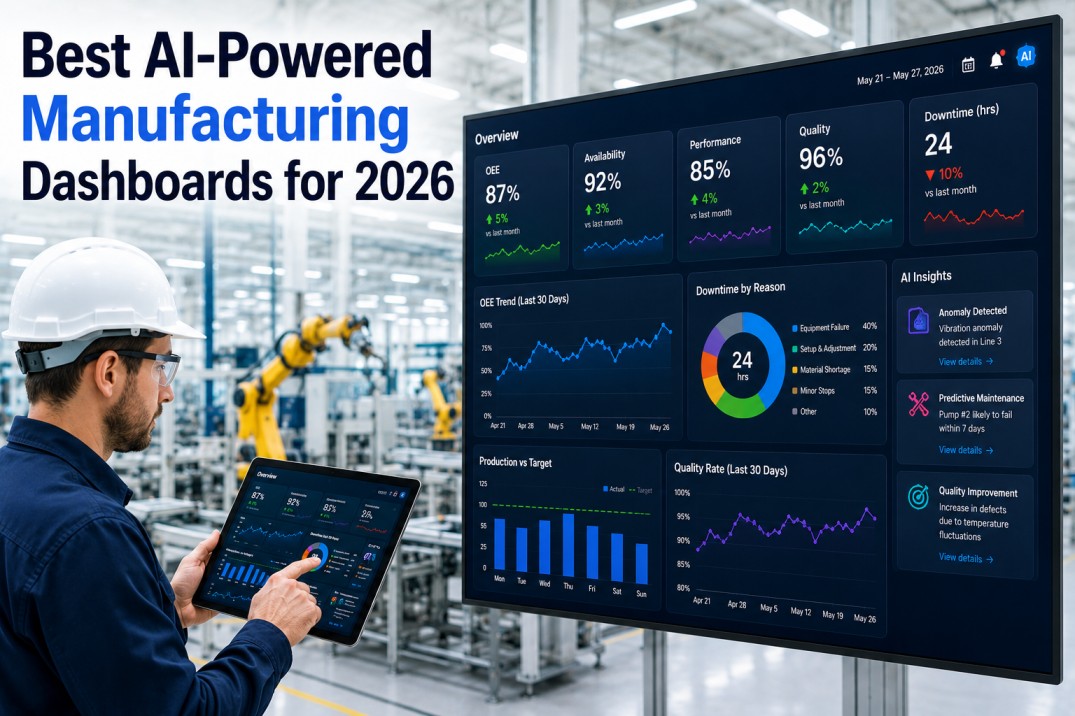
AI-powered manufacturing dashboards in 2026 are a new category of decision-support tool — they combine natural-language querying, real-time anomaly detection, and root-cause analysis in a single interface....
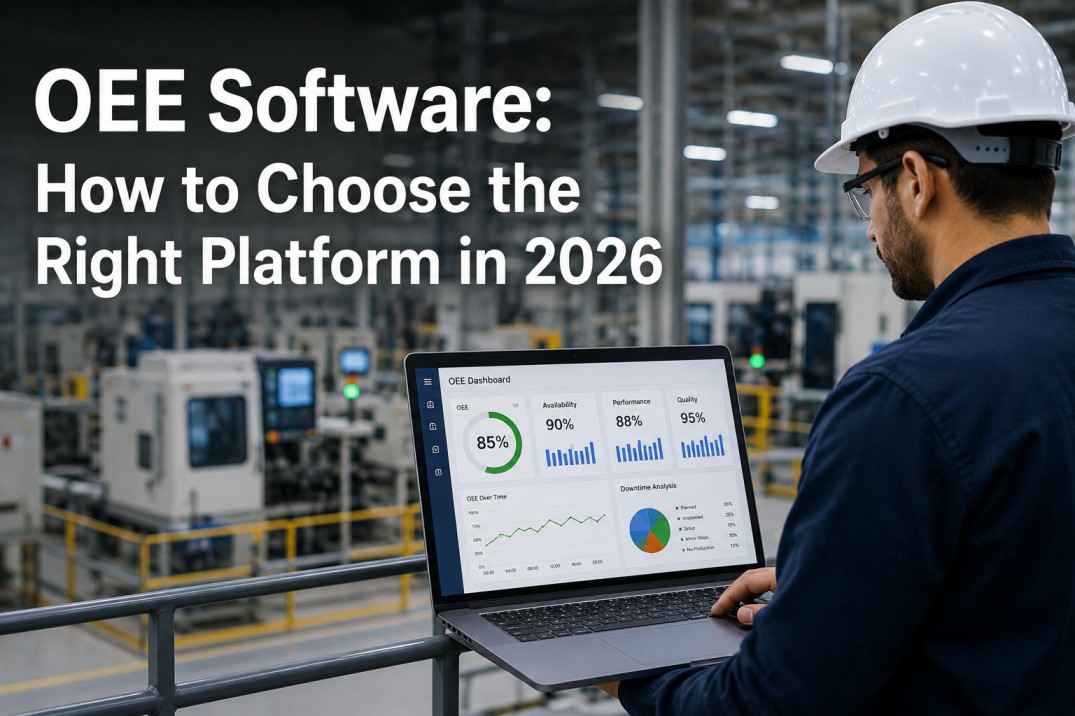
OEE (Overall Equipment Effectiveness) has been the manufacturing benchmark for decades, but most plants still calculate it with spreadsheets, manual stopwatch studies, or disconnected point solutions. In 2026,...
Manufacturing analytics has become the deciding factor between plants that continuously improve and plants that repeat the same problems shift after shift. In 2026, the gap is no longer about data availability...
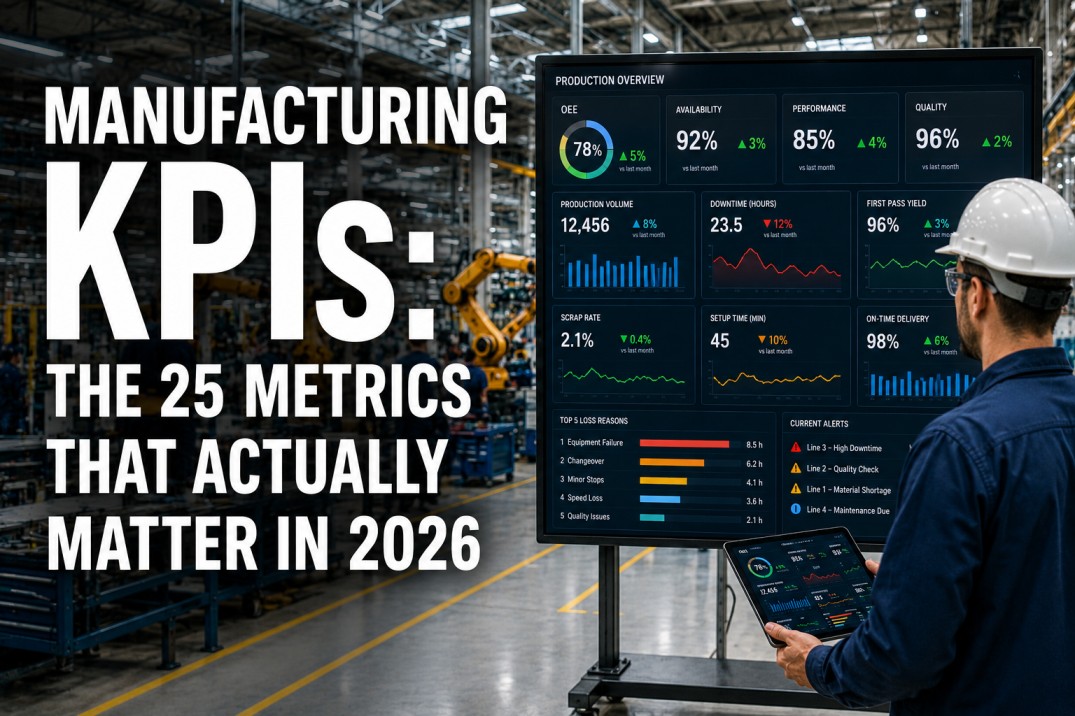
Manufacturing KPIs are the metrics that separate high-performing plants from the rest. In 2026, with smart sensors, edge computing, and real-time dashboards becoming standard, the challenge is no longer...

The control room at a 300,000-unit-per-year automotive plant. Three operators watch six different screens — one for the paint shop PLC, another for the body shop OEE, a third for energy management, a fourth...

Overall Equipment Effectiveness is the single metric that tells you whether your manufacturing equipment is actually producing what it should — at the speed it should — with the quality it should. Every...
A downtime tracker template is the structured log that captures every production stop with the timestamp, duration, equipment identification, and reason code needed to calculate OEE...
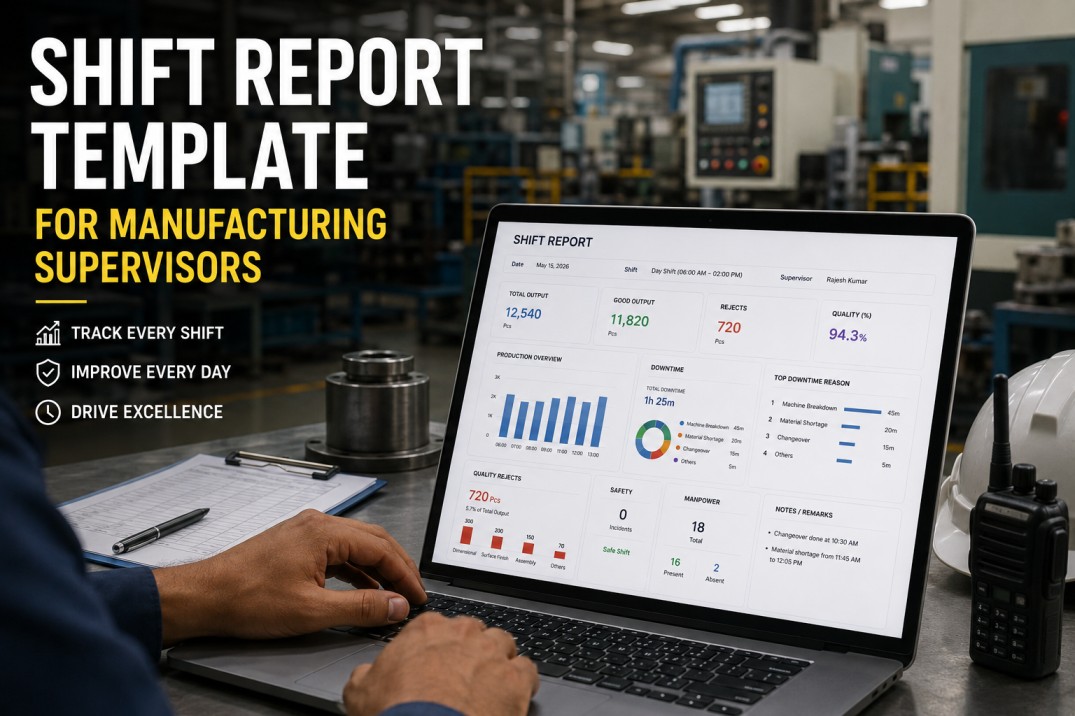
A shift report template is the operational handover document that transfers production state, equipment status, quality findings, and open actions from one shift team to the next. Its purpose is not primarily...
A manufacturing KPI dashboard template that actually gets used solves a specific problem for a specific audience at a specific tier of the organisation — not a single screen that attempts to display every...
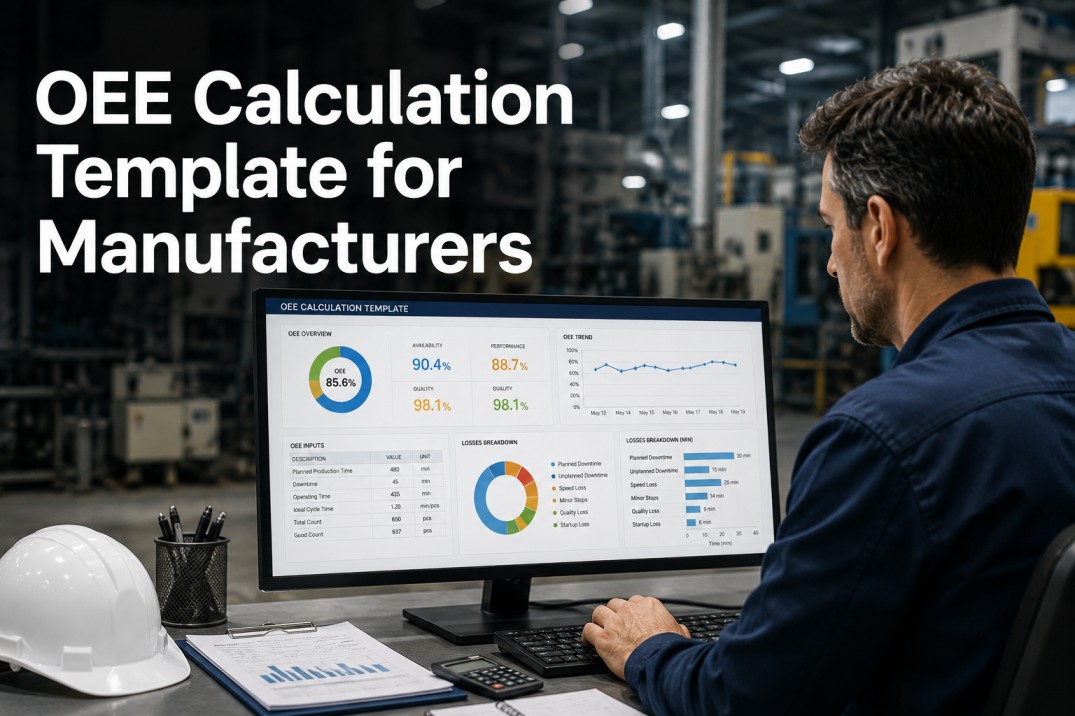
An OEE calculation template gives manufacturers a structured worksheet for computing Overall Equipment Effectiveness from the three component metrics — Availability, Performance, and Quality — and...
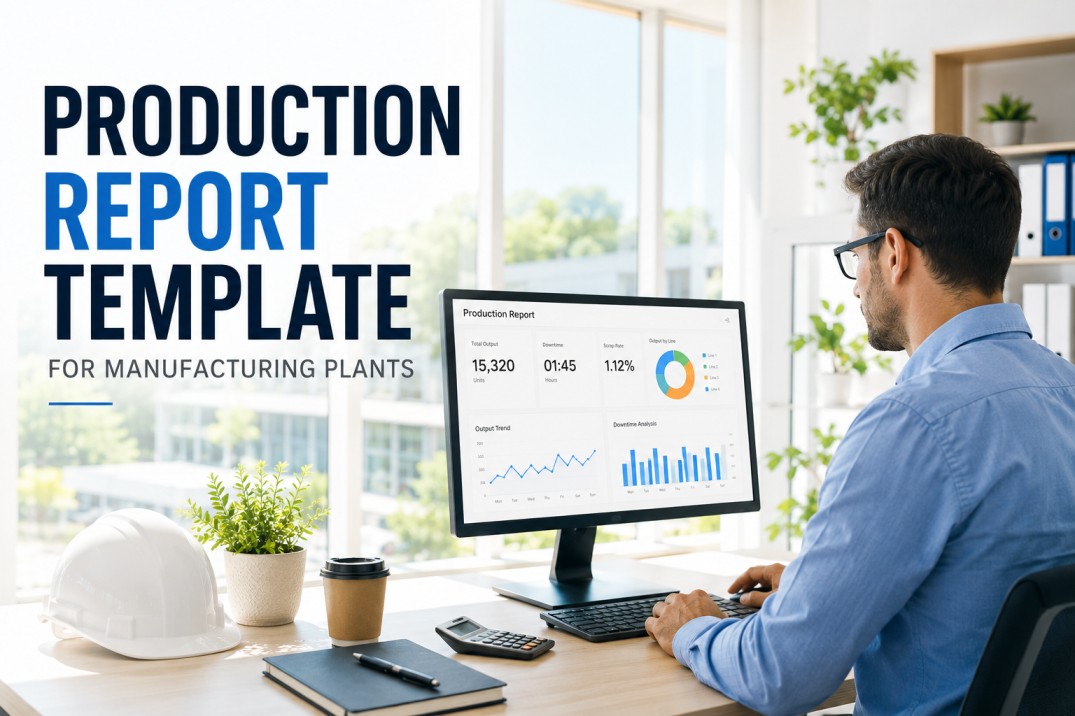
A production report template is the daily operational record that closes the loop between what the production schedule required and what the factory actually delivered — capturing output, downtime, scrap,...

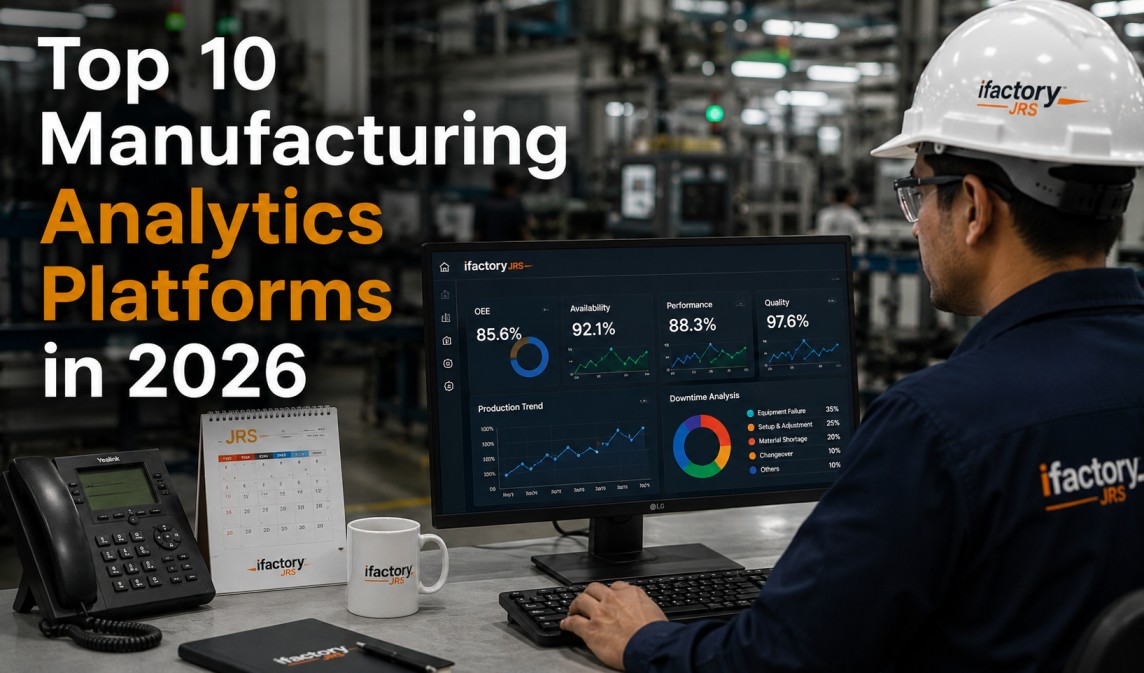
Selecting a manufacturing analytics platform in 2026 is a more consequential decision than it was three years ago. The market now includes purpose-built manufacturing intelligence platforms, general-purpose BI...
Manufacturing analytics implementations fail at a higher rate than they succeed — not because the technology does not work, but because the implementation does not start with a clear problem, does not involve...
Downtime tracking is the data discipline that converts unplanned production stops from operational anecdotes into an improvement-driving dataset. The difference between a plant that reduces downtime...
A manufacturing KPI dashboard that nobody looks at is not a dashboard — it is a screen saver. The failure mode of most factory dashboard implementations is not technical; it is design. Dashboards get built for...
OEE — Overall Equipment Effectiveness — is the industry-standard metric for measuring manufacturing productivity, defined as the product of Availability, Performance, and Quality. A world-class OEE of 85%...

The average manufacturing plant generates 50-100+ reports every week — shift summaries, production logs, downtime reports, quality records, maintenance logs, safety reports, energy reports, and compliance...

Manufacturing plants generate terabytes of data every week from sensors, PLCs, SCADA systems, MES platforms, and ERP databases — yet 73% of that data goes completely unused. The problem isn't collection, it's...
Automated dashboards and scheduled delivery eliminate spreadsheet work.
Data-driven maintenance decisions deliver measurable cost savings.
Proactive insights prevent costly unplanned equipment failures.
Real-time reliability metrics keep your operations running.
Everything you need to know about iFactory's Analytics & Reporting capabilities.
iFactory includes pre-built reports for Work Order Summary (by status, priority, technician, location), PM Compliance (on-time completion rates, overdue PMs), Asset Performance (downtime, MTTR, MTBF, health scores), Maintenance Costs (by asset, location, labor vs parts), Technician Performance (WOs completed, response times), Inventory Usage (parts consumption, stock levels), and Inspection Results. All reports can be customized and filtered by date range, location, asset category, and more.
Yes, iFactory allows you to create fully customized dashboards with drag-and-drop widgets. You can choose from charts, gauges, KPI cards, tables, and graphs. Each widget can be configured to show specific metrics, filtered by location, asset, or date range. You can create different dashboards for different roles – technician view vs manager view vs executive view – and save them for quick access.
Reports can be exported in multiple formats: PDF (formatted, print-ready reports with your company logo), Excel (raw data with pivot table support for further analysis), and CSV (universal format for importing into other systems). You can export on-demand with a single click, or schedule automatic exports to be emailed to stakeholders daily, weekly, or monthly at the time you specify.
MTTR (Mean Time To Repair) measures the average time it takes to fix equipment after a failure – lower is better. MTBF (Mean Time Between Failures) measures the average time between equipment breakdowns – higher is better. Together, these metrics help you understand equipment reliability and maintenance efficiency. iFactory automatically calculates these metrics for each asset based on work order history, helping you identify which equipment needs attention or potential replacement.
Yes, iFactory tracks all costs associated with each asset including labor costs (based on technician time logged), parts and materials used, and contractor/vendor costs. You can view total cost of ownership for any asset, compare maintenance costs across similar equipment, and identify assets that are becoming too expensive to maintain. This data is invaluable for making repair vs. replace decisions and justifying capital expenditures.
Yes, iFactory supports consolidated reporting across multiple facilities and locations. You can view all sites in a single dashboard or drill down to specific locations. Compare KPIs side-by-side across plants, identify best-performing facilities, and share best practices. Role-based access ensures each team sees only the locations relevant to them while executives get the full picture.
iFactory's AI engine automatically detects anomalies, predicts equipment failures before they happen, identifies cost-saving opportunities, and recommends optimal PM schedules based on actual usage patterns. AI-powered alerts notify you when metrics drift outside normal ranges, so you can take action before problems escalate. The system continuously learns from your data to improve accuracy over time.
Dashboards go live immediately once data starts flowing from work orders, assets, and inspections. Pre-built report templates are available from day one. Within 2–4 weeks of active use, you'll have enough historical data for meaningful trend analysis and KPI benchmarks. Most customers see measurable ROI within 90 days as data-driven decisions start reducing downtime and optimizing maintenance spend.
Customizable dashboards, real-time KPIs, and comprehensive reports help you make data-driven decisions that reduce downtime and cut costs. Schedule a free 30-minute demo.