A manufacturing data quality audit checklist helps operations and IT teams systematically assess the completeness, accuracy, timeliness, consistency, validity, and uniqueness of production data across all source systems. Without regular data quality audits, plants risk making decisions based on incomplete or misleading data, leading to incorrect OEE calculations, missed quality issues, and unreliable cost reporting. This checklist covers seven essential dimensions of data quality management — from scorecards and source inventories to issue tracking and governance crosswalks — enabling plants to build trust in their manufacturing analytics.
Data Quality Scoreboard: Overall Health at a Glance
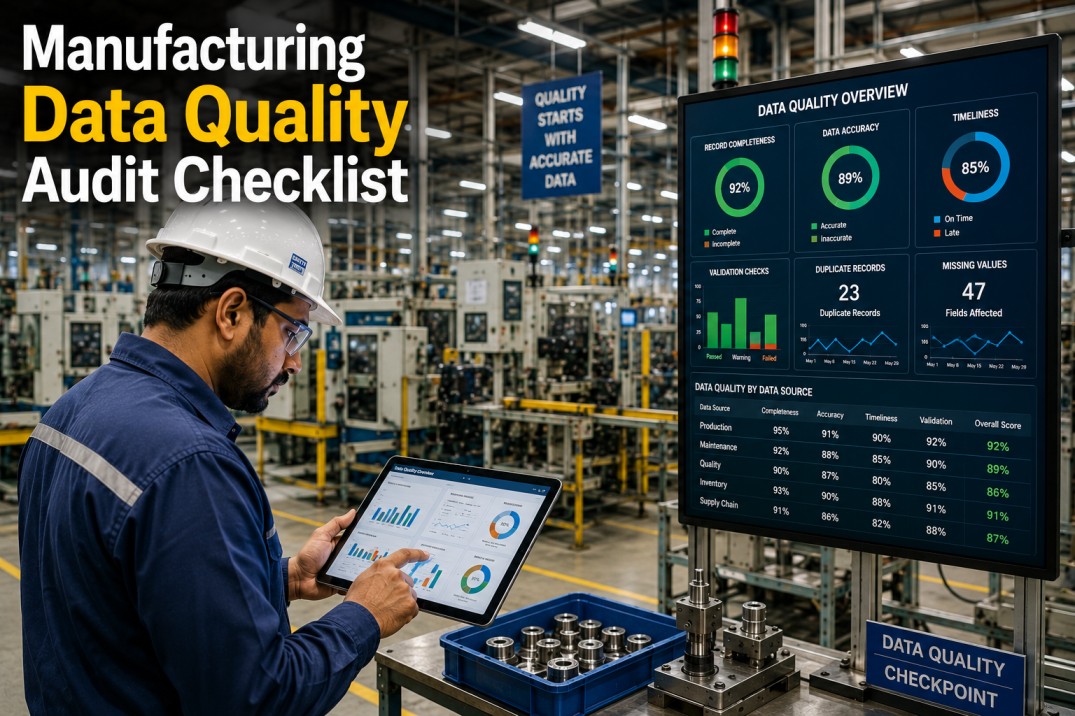
Monitor the health of your plant's data quality across four core dimensions. Each gauge shows the current score with an inline donut ring indicating progress toward the 100% target.
Trust Your Data
Enforce Data Quality at Ingest with iFactory
iFactory's manufacturing analytics platform validates data at the point of capture — checking completeness, accuracy, timeliness, and consistency before any metric is calculated. Built-in validation rules, real-time quality dashboards, and automated alerting ensure your OEE, scrap, and yield numbers are always trustworthy.
Data Quality Dimension Assessment: Six Dimensions Detailed
The six data quality dimensions provide a comprehensive framework for evaluating your manufacturing data. Each dimension addresses a specific aspect of data fitness-for-use, with scores indicating current performance levels.
Assess Your Data
Get a Comprehensive Data Quality Assessment in Minutes
iFactory's data quality module automatically scores every incoming data stream across completeness, accuracy, timeliness, consistency, validity, and uniqueness — surfacing issues before they affect your KPIs. No manual sampling, no spreadsheets, no guesswork.
Data Source Quality: Score by Source System
Each source system in your manufacturing IT landscape contributes data to analytics dashboards. The table below evaluates eight common manufacturing source systems on data quality, recency, and business criticality.
| Source | Type | Score | Bar | Refresh | Issues | Criticality |
|---|---|---|---|---|---|---|
| ERP | Transactional | 92% | Daily | 12 | Critical | |
| MES | Operational | 88% | Real-time | 8 | Critical | |
| SCADA | Operational | 85% | Real-time | 15 | Critical | |
| CMMS | Operational | 78% | Daily | 6 | High | |
| QMS | Operational | 91% | Daily | 4 | Critical | |
| LIMS | Operational | 87% | Daily | 7 | High | |
| WMS | Transactional | 83% | Real-time | 5 | Medium | |
| HRIS | Reference | 95% | Weekly | 2 | Low |
Data Quality Issue Registry: Tracking Open & Resolved Items
Maintaining a central registry of data quality issues ensures accountability and provides visibility into resolution progress. Each issue is tagged by source system and quality dimension for targeted remediation.
| ID | Source | Dimension | Description | Severity | Owner | Status |
|---|---|---|---|---|---|---|
| DQ-001 | ERP | Completeness | Missing BOM records for 12% of active part numbers | Critical | Data Team | Open |
| DQ-002 | MES | Accuracy | Production count mismatch between MES and ERP (avg 3.2% variance) | Critical | Ops Team | In Progress |
| DQ-003 | SCADA | Timeliness | Sensor data gaps of up to 15 minutes during shift transitions | High | Eng Team | Open |
| DQ-004 | CMMS | Consistency | MTBF calculation discrepancy between CMMS and analytics platform | Critical | Maintenance | Resolved |
| DQ-005 | QMS | Validity | Defect codes do not match approved reference list (8% non-compliant) | High | Quality | In Progress |
| DQ-006 | LIMS | Accuracy | Test result rounding errors at 4 decimal places cause yield misreporting | Medium | Lab | Open |
| DQ-007 | WMS | Consistency | Inventory count discrepancy of 5.4% between WMS and physical stock | High | Warehouse | Resolved |
| DQ-008 | ERP | Completeness | Vendor master records missing tax ID for 22% of active suppliers | Medium | Procurement | Open |
| DQ-009 | MES | Timeliness | Shift production reports delayed by an average of 4 hours | High | Production | In Progress |
| DQ-010 | SCADA | Uniqueness | Duplicate tag readings on redundant sensor channels | Low | Eng Team | Open |
Resolve Issues Faster
Automate Data Quality Issue Detection and Assignment
iFactory continuously monitors data streams for quality issues — flagging missing fields, value mismatches, delayed updates, and duplicate records — and automatically assigns remediation tasks to the appropriate team. No more manual issue log maintenance.
Data Validation Rules Reference: Automated Checks Reference
Data validation rules enforce quality at the point of data entry or ingestion. The table below catalogues eight common validation rules used in manufacturing environments with their rule type, condition, and error handling action.
| Rule Name | Field | Type | Condition | Error Action | Category |
|---|---|---|---|---|---|
| BOM Completeness | BOM_ID | Completeness | EXISTS(component_list) | Block | Data Integrity |
| Production Count Range | output_qty | Accuracy | output_qty ≥ 0 AND ≤ capacity | Warn | Range |
| Timestamp Freshness | event_ts | Timeliness | event_ts ≤ CURRENT_TS - 1min | Alert | Freshness |
| Defect Code Validity | defect_code | Validity | defect_code IN (ref_codes) | Block | Reference |
| UoM Consistency | uom | Consistency | uom = base_uom OR convertible | Warn | Conversion |
| Employee ID Format | emp_id | Validity | REGEXP '^[A-Z]{3}\\d{4}$' | Block | Format |
| PO Reference Check | po_number | Consistency | po_number EXISTS (purch_orders) | Warn | Reference |
| Stock Level Tolerance | stock_level | Accuracy | ABS(stock_level - p_count) ≤ 5% | Alert | Tolerance |
Data Quality Governance Crosswalk: Dimensions Across the Data Lifecycle
Understanding which data quality dimensions are most critical at each stage of the data lifecycle helps prioritise governance investments. The matrix below maps six quality dimensions across four lifecycle stages with priority ratings.
| Dimension | Capture | Process | Store | Report |
|---|---|---|---|---|
| Completeness | Critical | Low | High | Critical |
| Accuracy | Critical | Critical | High | Critical |
| Timeliness | High | High | Low | Critical |
| Consistency | Low | High | Critical | High |
| Validity | Critical | High | High | Low |
| Uniqueness | High | High | Critical | Low |
Data Quality Improvement Action Plan
Use this action plan to systematically improve data quality across your manufacturing IT landscape. Each action includes the responsible department, owner, recommended frequency, and expected impact.
| # | Action Item | Department | Owner | Frequency | Impact |
|---|---|---|---|---|---|
| 1 | Implement automated data validation at source | Data Eng. | Engineer | Weekly | Critical |
| 2 | Establish data quality scorecards per source | Governance | Manager | Monthly | High |
| 3 | Conduct root cause analysis for critical issues | Quality | Analyst | Weekly | Critical |
| 4 | Define data quality SLAs with business owners | Management | Director | Quarterly | High |
| 5 | Deploy real-time data quality monitoring | IT | Engineer | Monthly | High |
| 6 | Train operators on correct data entry practices | Training | Trainer | Quarterly | Medium |
| 7 | Review data quality metrics in monthly ops review | Operations | Plant Manager | Monthly | Medium |
| 8 | Update data governance policies and rules annually | Governance | DPO | Annually | Low |
Frequently Asked Questions
What are the six dimensions of data quality?
The six standard data quality dimensions are completeness (all required fields populated), accuracy (values reflect real-world conditions), timeliness (data available when needed), consistency (values agree across systems), validity (data conforms to defined formats and rules), and uniqueness (no duplicate records). These dimensions provide a comprehensive framework for evaluating manufacturing data quality.
How often should a data quality audit be conducted?
Real-time data quality monitoring should run continuously for operational systems (MES, SCADA, QMS), with automated alerts for threshold violations. A formal comprehensive audit covering all six dimensions across all source systems should be conducted quarterly, with targeted mini-audits monthly for critical data domains like production counts and quality metrics.
What is an acceptable data quality score?
For manufacturing analytics, a score above 90% is considered excellent, 80–90% is acceptable with targeted remediation, and below 80% requires immediate corrective action. Critical data domains such as production counts, OEE inputs, and quality metrics should target 95% or higher. Non-critical reference data like vendor addresses can tolerate 85% or higher.
How do validation rules improve data quality?
Validation rules prevent poor-quality data from entering your analytics pipeline by checking each record against predefined conditions at the point of ingestion. Rules can block invalid data entirely (e.g., missing BOM IDs), warn operators of suspicious values (e.g., unusually high production counts), or generate alerts for manual review (e.g., inventory tolerance checks).
Start Your Audit Today
Get Complete Data Quality Visibility Across Your Plant
iFactory's data quality module continuously monitors completeness, accuracy, timeliness, consistency, validity, and uniqueness across every data source — from ERP and MES to SCADA and QMS. Automated validation, real-time scoring, and intelligent issue routing ensure your analytics are always built on trusted data.