A manufacturing KPI tree template is the single most effective tool for aligning plant-floor metrics with strategic business objectives. Instead of a flat list of disconnected KPIs — the kind that clutters most manufacturing dashboards — a KPI tree organises metrics into a hierarchical structure: strategic outcomes at the top, tactical drivers in the middle, and operational metrics at the base. Every measurement on the plant floor rolls up into a higher-level objective, and every strategic goal decomposes into actionable metrics that operators, supervisors, and plant managers can influence daily. This page breaks down the seven essential components of a production-grade KPI tree template, the same framework iFactory uses to build clickable, drill-down KPI trees that connect every operator screen to the boardroom.
Get Started
Build a Clickable KPI Tree That Connects the Plant Floor to the Boardroom
iFactory's KPI tree template turns your metrics into a live, hierarchical structure — every node is clickable, every leaf drills down to its source data, and every strategic goal is backed by real operational performance.
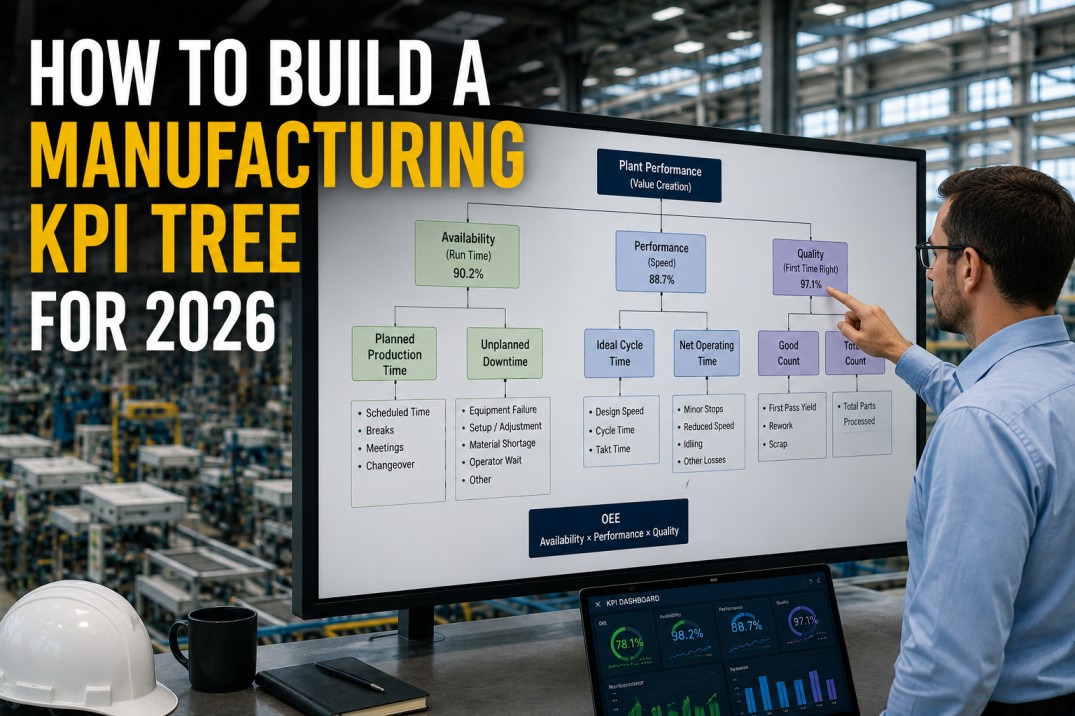
Hierarchical KPI Tree Diagram
The KPI tree diagram is the centrepiece of the template. It maps the complete metric hierarchy from the strategic root — plant performance — through the five SQDCP dimensions into individual operational KPIs. Every node in the tree is connected by a parent-child relationship: changes at the operational leaf level propagate upward to the dimension level, and dimension performance rolls up into the overall plant score. The tree should be read top-down for strategic decomposition and bottom-up for root-cause analysis.
KPI Cascade Breakdown Cards
The KPI cascade shows how a single high-level metric decomposes into its component drivers — turning an aggregate number into actionable sub-metrics that different teams own. Each cascade card below takes one strategic KPI and breaks it into its tactical and operational components. The cascade is the primary tool for translating a plant manager's target into specific actions for each shift and cell.
Live Cascade
See How Every KPI Breaks Down into Actionable Drivers
iFactory's KPI cascade view lets you click any metric to see its full decomposition tree — from the plant-level aggregate all the way down to the shift-level operational data that drives it.
KPI Driver Impact Matrix
Not every operational metric has the same influence on strategic outcomes. The driver impact matrix scores each operational driver against the five SQDCP dimensions, using filled dots to indicate high impact and empty dots for low impact. This matrix helps the plant leadership team prioritise which metrics to focus improvement efforts on — a driver that strongly affects multiple strategic dimensions deserves more attention than one that affects only a single dimension weakly.
| Operational Driver | Safety | Quality | Delivery | Cost | People | Impact Score |
|---|---|---|---|---|---|---|
| OEE | 4.0 | |||||
| First Pass Yield | 3.5 | |||||
| On-Time Delivery | 3.0 | |||||
| Downtime % | 3.5 | |||||
| Scrap Rate | 2.5 | |||||
| Attendance Rate | 3.0 | |||||
| Training Completion | 3.5 |
KPI Ownership by Organisation Level
Every node in the KPI tree must have a clear owner who is accountable for its performance. The ownership cards below map each organisation level — from the plant VP down to the line operator — to the part of the KPI tree they own. This ensures that every metric has a named individual who can explain variances, initiate corrective actions, and report status during reviews. Without clear ownership, even the best KPI tree becomes a passive reference document rather than an active management tool.
Clear Ownership
Assign Every Metric to a Named Owner in the KPI Tree
iFactory's KPI tree template lets you assign ownership at every node — from the VP down to the operator — so every metric has a clear accountable person. Ownership data flows into automated review notifications and action assignment.
Strategic Alignment Reference Cards
The strategic alignment cards map each high-level plant objective to the operational KPIs in the tree that drive it. This view answers the question every plant leader should ask: which metrics on my dashboard actually move the needle on my strategic priorities? Each card lists a strategic objective, the operational KPIs that influence it most strongly, and a current alignment score that measures how well the operational performance supports the strategic goal.
Cross-KPI Relationship Cards
KPIs in a manufacturing plant do not exist in isolation — improving one metric often affects others, either positively or negatively. The relationship cards below document the known interactions between key metrics in the KPI tree. Understanding these relationships prevents the team from optimising one metric at the expense of another and helps identify leverage points where a single improvement drives multiple dimensions simultaneously.
Understand Relationships
Map How Your KPIs Influence Each Other
iFactory's KPI tree template includes a built-in relationship registry that documents known correlations, trade-offs, and leading indicators — so your team makes decisions that optimise the whole system, not individual metrics.
KPI Tree Maturity Cards
The KPI tree is not a static document — it should mature as the plant's analytics capability grows. The maturity cards below define five levels of KPI tree sophistication, from a basic static spreadsheet to a fully automated, clickable tree with live data at every node. Each level describes the data sources, update frequency, ownership clarity, and analytical depth available at that stage. Most plants start at Level 2 and progress one level per year as their data infrastructure and analytics culture mature.
Frequently Asked Questions
What is a KPI tree in manufacturing?
A manufacturing KPI tree is a hierarchical visual framework that organises plant metrics from strategic outcomes at the top down to operational metrics at the base. The tree structure makes explicit how lower-level operational metrics (like cycle time, scrap count, or andon response time) roll up into tactical drivers (OEE, cost per unit, on-time delivery) and ultimately into strategic objectives (profitability, customer satisfaction, safety performance). Unlike a flat KPI list, the tree shows the causal and contributory relationships between metrics.
How do I build a KPI tree for my plant?
Building a KPI tree starts with defining the strategic objectives at the top level — typically using the SQDCP framework (Safety, Quality, Delivery, Cost, People). For each dimension, identify the 2-3 tactical KPIs that best represent performance (e.g., for Quality: First Pass Yield, Scrap Rate, Cpk). Then decompose each tactical KPI into the operational metrics that drive it (e.g., FPY is driven by defect rate per station, rework loops, and first-time-through rate). The tree should be 3-4 levels deep and contain no more than 25-30 total nodes to remain useful for daily decision-making.
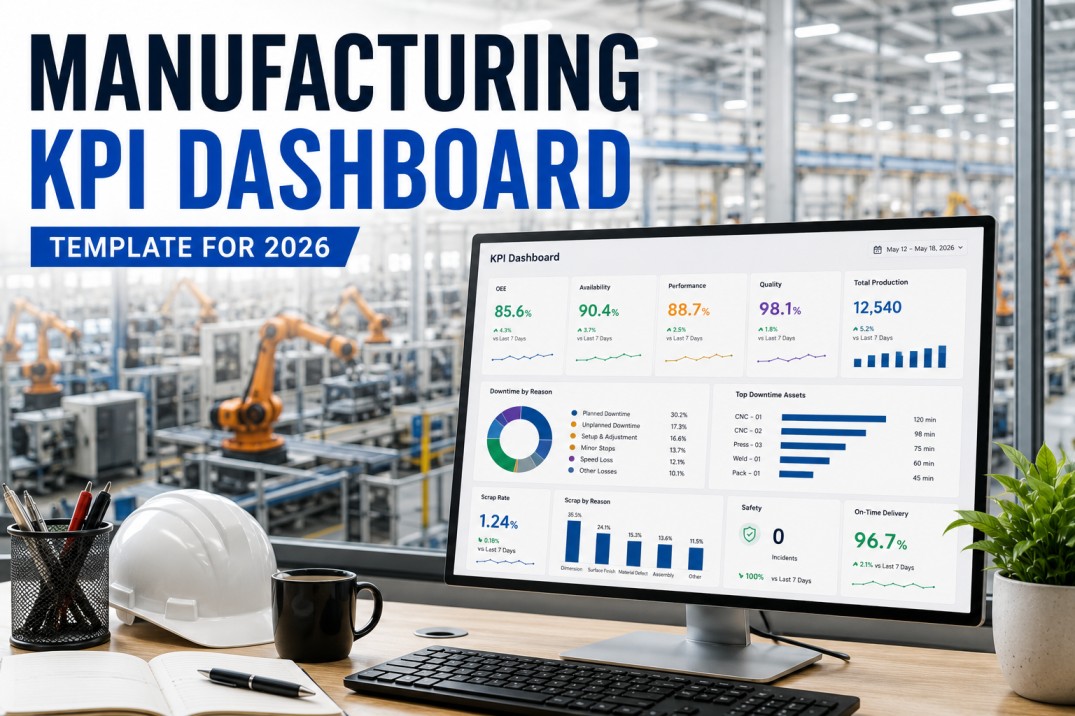
What is the difference between a KPI tree and a KPI dashboard?
A KPI dashboard displays a flat collection of metrics — typically arranged in tiles or charts — that show current performance against targets. A KPI tree, by contrast, shows the hierarchical relationships between metrics: how lower-level operational data flows into higher-level strategic measures. The tree answers the question "why should I care about this metric?" by showing its impact on higher-level outcomes. The most effective plants use both: the KPI tree as the navigation framework and the dashboard as the detailed view for each node in the tree.
How many levels should a KPI tree have?
A well-designed manufacturing KPI tree should have three to four levels: Level 1 (Strategic) — plant-level outcomes like Safety INC Rate, OEE, Cost per Unit, On-Time Delivery; Level 2 (Tactical) — dimension drivers like Availability, Performance, Quality for OEE; Level 3 (Operational) — specific metrics like Downtime %, Cycle Time, Scrap Rate; and optionally Level 4 (Activity) — individual data points like Andon Calls per Shift, Changeover Time per SKU. Limiting the tree to 3-4 levels keeps it actionable without overwhelming users.
How do I assign ownership in a KPI tree?
Each node in the KPI tree should have a single named owner. Strategic-level nodes are owned by the plant manager or VP of operations. Tactical nodes are owned by department heads or shift supervisors. Operational nodes are owned by line leads, team leaders, or process engineers. The owner is responsible for understanding variance, initiating corrective actions, and reporting status during reviews. In iFactory, ownership is assigned at the node level and flows through to automated notifications, review agendas, and action tracking.
Can I create a KPI tree in Excel?
Yes, you can create a static KPI tree in Excel using a combination of rows, indentation, and cell formatting to represent the hierarchy. However, a spreadsheet-based tree has significant limitations: it cannot update automatically from live data sources, it does not support clickable drill-down, it has no built-in ownership tracking or escalation logic, and it must be manually updated at each review cycle. iFactory's digital KPI tree template starts with the same conceptual structure but adds live data connectivity, one-click drill-down, automated ownership notifications, and relationship mapping — turning the tree from a static reference into an active management tool.
Get Your Template
Build Your Live KPI Tree with iFactory
iFactory's KPI tree template connects every node to live data from your MES, ERP, QMS, and HSE systems — creating a clickable, hierarchical metric framework that aligns your plant floor with your strategic objectives. See it running on your data in a 30-minute personalised demo.