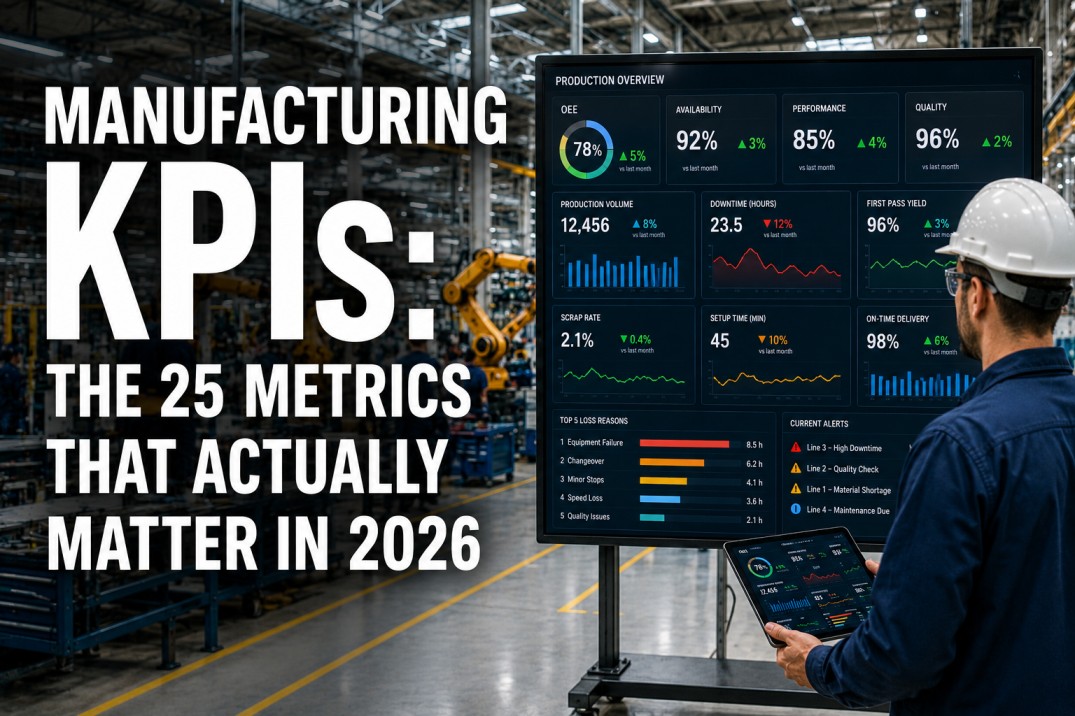
Manufacturing KPIs are the metrics that separate high-performing plants from the rest. In 2026, with smart sensors, edge computing, and real-time dashboards becoming standard, the challenge is no longer collecting data — it is choosing which metrics to act on. Most plants track dozens of KPIs, but only a handful drive meaningful improvement. This guide covers 25 essential manufacturing KPIs across six categories — Quality, Productivity, Maintenance, Financial, Supply Chain, and Safety — with formulas, targets, and guidance on how to select the right ones for your operation.
Stop Chasing Spreadsheets — See All 25 KPIs Live Across Every Line and Shift
iFactory connects to your equipment and production systems to calculate and display manufacturing KPIs in real time. No manual data collection, no delayed reports, no guesswork. See OEE, FPY, throughput, downtime, and financial KPIs updated every production cycle — per machine, per line, per plant.
The 25 KPIs That Actually Matter in 2026
Below are 25 manufacturing KPIs organized into six categories. Each table includes the KPI name, the formula used to calculate it, and a realistic target range. Use these tables as a reference when building or auditing your plant's KPI scorecard.
Quality KPIs — First Pass Yield, Scrap Rate, and More
Quality KPIs measure how well your process produces parts that meet specification the first time. Poor quality drives rework cost, scrap waste, and customer returns. These five metrics give a complete picture of manufacturing quality performance.
| KPI | Formula | Target |
|---|---|---|
| First Pass Yield (FPY) | Good Units Produced / Total Units Started × 100 | > 98% |
| Scrap Rate | Scrap Units / Total Units Produced × 100 | < 1% |
| Rework Rate | Reworked Units / Total Units Produced × 100 | < 2% |
| Customer PPM | (Defective Units Shipped / Total Units Shipped) × 1,000,000 | < 100 PPM |
| CpK / PpK | Min((USL − Mean) / 3σ, (Mean − LSL) / 3σ) | > 1.67 |
First Pass Yield is often the most actionable quality KPI because it captures problems at the point of production. A low FPY triggers immediate root-cause analysis. Customer PPM is a lagging indicator — by the time you see a spike, the defective product is already in the field. Leading quality indicators like CpK trend shifts let you detect process drift before it produces defects. Stack these metrics so that leading indicators warn you and lagging indicators confirm improvement.
Productivity KPIs — OEE, TEEP, Throughput, and Utilization
Productivity KPIs measure how effectively you convert inputs into output. These five metrics cover equipment effectiveness, speed, capacity utilization, and overall asset performance.
| KPI | Formula | Target |
|---|---|---|
| OEE | Availability × Performance × Quality | > 85% |
| TEEP | OEE × Utilization | > 60% |
| Cycle Time | Total Production Time / Units Produced | Process-dependent |
| Throughput | Good Units Produced / Time Period | > 95% of design rate |
| Utilization | Planned Production Time / Total Calendar Time × 100 | > 80% |
OEE remains the foundational productivity metric because it collapses three loss categories into one number. TEEP adds the utilization dimension — a plant running one shift with 85% OEE looks good on OEE but poor on TEEP because the asset sits idle 66% of the calendar day. Cycle Time targets depend entirely on the process type; the goal is continuous reduction through standardization and waste elimination. Throughput should be measured against the demonstrated design rate, not theoretical maximum speed.
Maintenance KPIs — MTBF, MTTR, and Downtime Metrics
Maintenance KPIs reveal how reliable your equipment is and how quickly the organization responds when it fails. These four metrics are the standard set tracked in TPM and lean maintenance programs.
| KPI | Formula | Target |
|---|---|---|
| MTBF | Total Operating Time / Number of Breakdowns | > 500 hours |
| MTTR | Total Repair Time / Number of Repairs | < 60 minutes |
| Planned Maintenance % | Planned Maintenance Hours / Total Maintenance Hours × 100 | > 85% |
| Downtime % | Total Downtime / Planned Production Time × 100 | < 5% |
MTBF and MTTR are best tracked together — a short MTBF with a short MTTR suggests frequent but easy-to-fix failures, pointing to root causes like worn components or poor operator care. A long MTBF with a long MTTR means failures are rare but severe, pointing to complex failure modes that need design-level solutions. Planned Maintenance % is the most important leading maintenance indicator: a ratio above 85% means the team is proactive rather than reactive. Downtime % gives the operational impact in terms management understands immediately.
Financial KPIs — COGS, Revenue per Employee, Inventory Turns
Financial KPIs connect manufacturing performance directly to profit and loss. While operational metrics track efficiency, these four KPIs track whether that efficiency translates into financial results.
| KPI | Formula | Target |
|---|---|---|
| COGS | Direct Materials + Direct Labor + Mfg Overhead | Decreasing trend |
| Revenue per Employee | Total Revenue / Number of Employees | > Industry average |
| Inventory Turns | COGS / Average Inventory Value | > 6x (varies) |
| Energy Cost per Unit | Total Energy Cost / Units Produced | Decreasing trend |
COGS is the definitive measure of production cost efficiency. Tracking it monthly against output volume tells you whether cost reduction efforts are working or being offset by inflation, waste, or overhead creep. Revenue per Employee is a proxy for overall productivity that benchmarks well across industries. Inventory Turns directly measures working capital efficiency — low turns mean cash is tied up on the factory floor. Energy Cost per Unit has become a priority metric in 2026 as energy prices remain volatile and sustainability reporting requirements expand.
Supply Chain KPIs — On-Time Delivery, Supplier Quality, and Lead Time
Supply chain KPIs measure how well materials flow into and through your operation. In a disrupted sourcing environment, these four metrics are critical for maintaining production continuity and customer satisfaction.
| KPI | Formula | Target |
|---|---|---|
| On-Time Delivery | Orders Delivered on Time / Total Orders × 100 | > 98% |
| Supplier PPM | (Defective Supplier Parts / Total Supplier Parts) × 1,000,000 | < 500 PPM |
| Lead Time | Order Received to Delivery (days) | Decreasing trend |
| Dock-to-Stock | Receipt to Available for Production (hours) | < 24 hours |
On-Time Delivery is the most visible supply chain KPI — it directly impacts customer satisfaction and retention. Supplier PPM tracks inbound quality and should be reported back to suppliers as part of a structured scorecard program. Lead Time is a competitive differentiator; shorter lead times mean lower safety stock requirements and faster response to demand changes. Dock-to-Stock measures internal receiving efficiency — long dock-to-stock times indicate process bottlenecks in inspection, put-away, or system updating that delay production readiness.
Safety KPIs — TRIR, DART, and Near Miss Reporting
Safety KPIs are the ultimate measure of whether the plant is being run sustainably. No OEE or throughput target justifies an unsafe work environment. These three metrics provide a standard view of safety performance.
| KPI | Formula | Target |
|---|---|---|
| TRIR | (Recordable Incidents × 200,000) / Total Hours Worked | < 1.0 |
| DART | (DART Cases × 200,000) / Total Hours Worked | < 0.5 |
| Near Misses | Count of near-miss events reported | Increasing (better reporting) |
TRIR (Total Recordable Incident Rate) is the industry-standard safety metric used by OSHA and most manufacturers. DART (Days Away Restricted or Transferred) measures the severity of incidents — a low DART combined with a low TRIR means incidents are infrequent and minor. Near Miss count is a leading indicator: an increasing near-miss trend usually means reporting culture is improving, which correlates with fewer actual incidents over time. If near-miss reports are zero, the problem is not safety — it is under-reporting.
How to Choose Which KPIs Matter for Your Plant
Not every KPI in this list belongs on every plant's scorecard. The right set of KPIs depends on your production process type, business objectives, and organizational maturity. Here is a practical framework for selecting the KPIs that will drive improvement in your operation.
Common KPI Mistakes — and How to Avoid Them
Even well-intentioned KPI programs fail when common mistakes creep into metric design, data collection, or governance. Here are the most frequent errors observed across manufacturing plants and how to fix them.
Stop Manual Data Collection — iFactory Calculates Every KPI Automatically
iFactory connects to PLCs, SCADA, CMMS, and ERP systems to calculate all 25 manufacturing KPIs in real time. Dashboards update every production cycle. Operators see their KPIs on the floor. Managers see plant-wide trends and drill into any metric by shift, product, or machine. No spreadsheets, no delays, no manual consolidation.
Frequently Asked Questions — Manufacturing KPIs
How many KPIs should a manufacturing plant track?
Most plants track too many. The industry average is 37 KPIs per plant, but high-performing plants typically limit their scorecard to 8-12 KPIs at the plant manager level and 3-5 KPIs at the operator level. The key is hierarchy: operational metrics for real-time decisions, tactical metrics for weekly reviews, and strategic metrics for monthly business reviews. If every KPI is equally visible, none of them drive action. A good rule of thumb is that the plant manager's scorecard should fit on one page. If scrolling is required, there are too many KPIs.
What is the most important KPI in manufacturing?
There is no single most important KPI — the right answer depends on your business objective. However, OEE is the most widely adopted composite metric because it collapses Availability, Performance, and Quality into one number. For plants focused on cost reduction, COGS and Scrap Rate are the priority. For plants focused on growth, On-Time Delivery and Throughput matter most. For plants in regulated industries, CpK and Customer PPM are non-negotiable. The most important KPI is the one that measures progress toward your biggest strategic gap. Start by asking: what is the one thing that, if improved, would have the greatest impact on our business results?
How often should manufacturing KPIs be reviewed?
The review cadence should match the decision horizon. Operational KPIs — OEE, downtime, throughput, scrap rate — should be visible in real time and reviewed at the start of every shift and in daily stand-up meetings. Tactical KPIs — MTBF, FPY, On-Time Delivery — should be reviewed weekly in the operations review. Strategic KPIs — COGS, Inventory Turns, TRIR — should be reviewed monthly in the business review. Annual KPI target setting should align with the strategic planning cycle. The fastest improvement happens when KPIs are reviewed at the frequency where action can still be taken. Reviewing monthly data weekly adds noise; reviewing hourly data monthly misses the opportunity to intervene.
What is the difference between a KPI and a metric?
All KPIs are metrics, but not all metrics are KPIs. A metric is any measurable value — cycle time, temperature, part count. A KPI (Key Performance Indicator) is a metric that is tied directly to a strategic objective and has a target. The difference is context and actionability. Part count is a metric. OEE is a KPI because it has a specific target (85% world-class), a defined calculation method, and a clear action path (improve Availability, Performance, or Quality). The distinction matters because it prevents every data point from being treated as equally important. When building your scorecard, label each metric as either "informational" or "key performance indicator." If it is a KPI, it must have an owner, a target, and a review frequency.
How do I get my team to actually use KPI dashboards?
KPI adoption fails when dashboards are designed for management instead of for the people doing the work. Three principles drive adoption. First, make KPIs visible on the floor — large screens at production cells showing the 3-5 metrics operators can influence that shift. Second, ensure data accuracy — nothing kills adoption faster than a KPI that does not match what operators know to be true. Run a parallel validation period before going live. Third, use KPIs in existing meetings — do not create new KPI review meetings. Add a five-minute KPI review to the existing daily stand-up, weekly operations review, and monthly business review. When operators see their input reflected in accurate data that drives decisions, adoption follows naturally. Digital platforms like iFactory support floor-level displays, automated data validation, and role-based dashboards that serve each level of the organization with the KPIs they need to act on.
Deploy a Complete KPI System in Weeks — Not Months
iFactory connects to your existing equipment and systems to deliver live manufacturing KPIs across every level of the organization. From operator floor displays to executive summaries, every KPI is calculated automatically from production data. Out-of-the-box connectors for PLCs, OPC-UA, Modbus, CMMS, and ERP systems. Role-based dashboards, automated reporting, and trend analysis included.