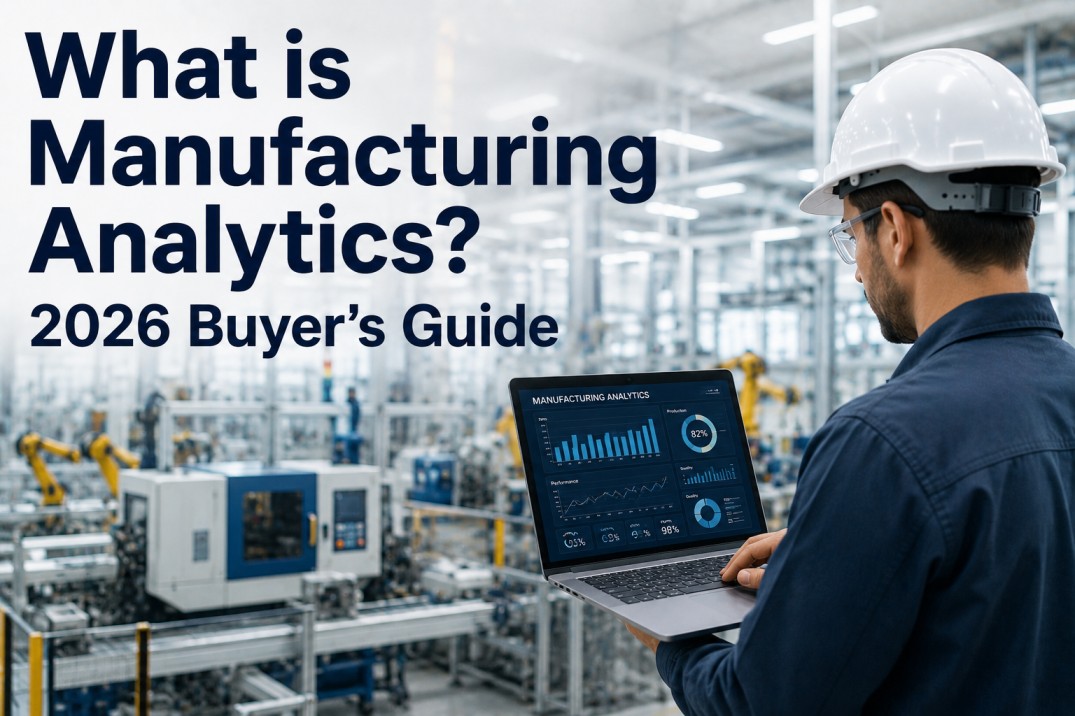
Manufacturing analytics has become the deciding factor between plants that continuously improve and plants that repeat the same problems shift after shift. In 2026, the gap is no longer about data availability — most plants have PLCs, SCADA systems, MES platforms, and CMMS databases generating millions of data points daily. The gap is in making that data usable — transforming raw time-series signals, event logs, and quality records into actionable insights that operators, engineers, and plant managers can act on in real time. This guide explains what manufacturing analytics is, who benefits from it, the five capabilities that separate effective platforms from reporting tools, and a structured framework for evaluating vendors in 2026.
Stop Pulling Reports From Five Different Systems — iFactory Unifies Production Data in One Platform
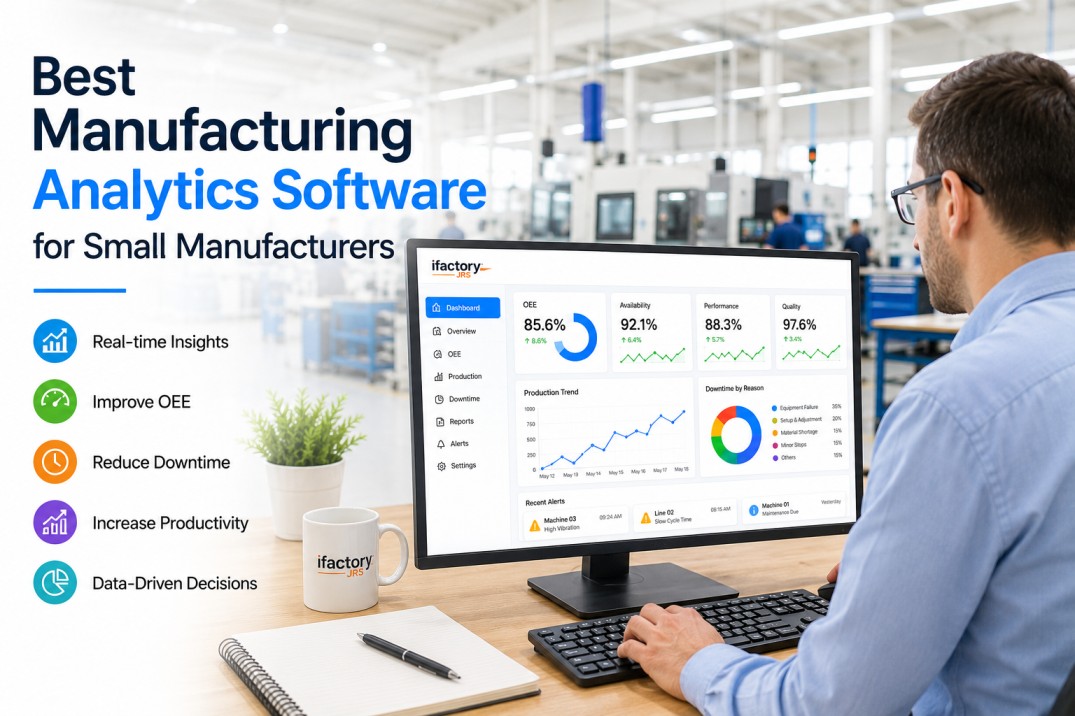
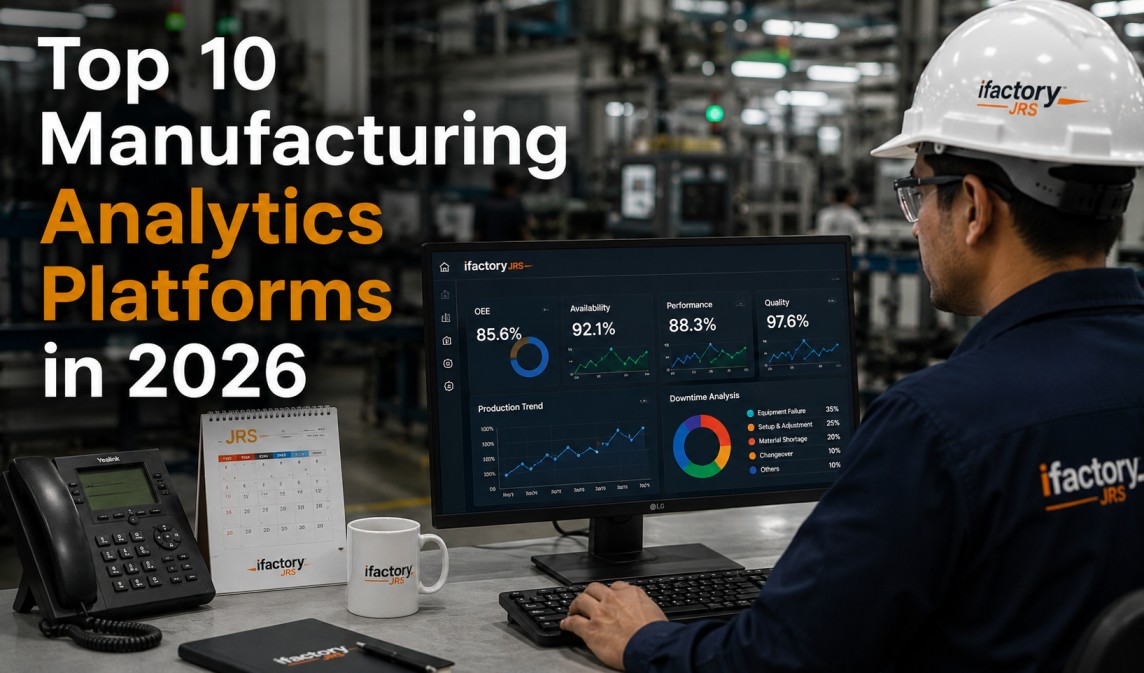
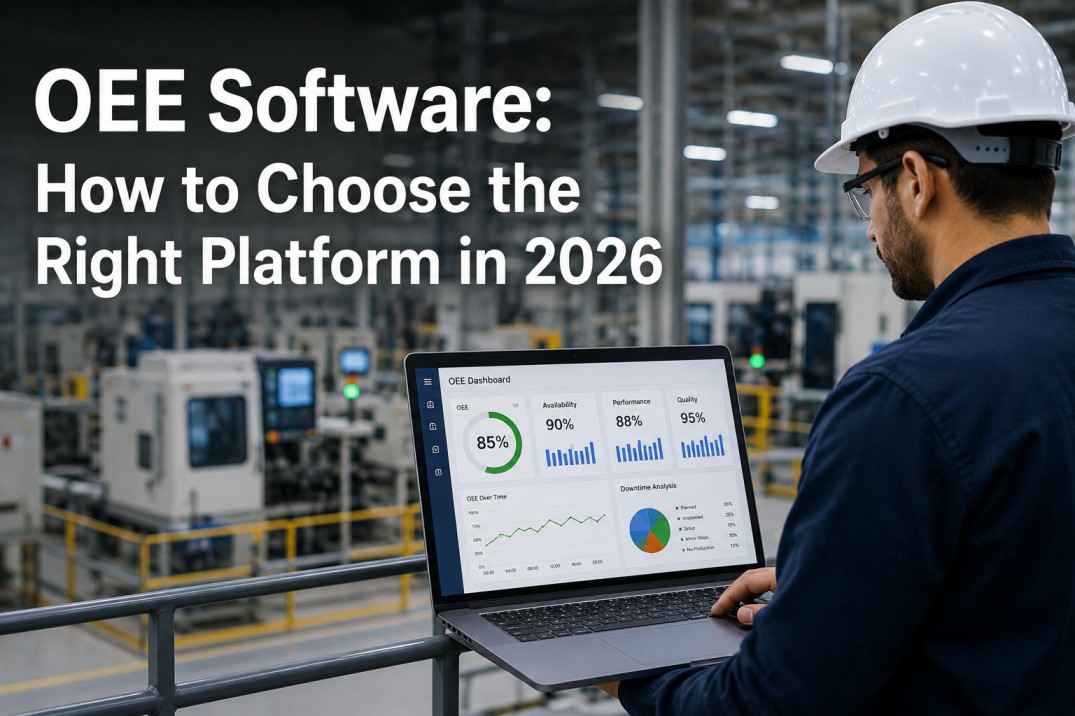
iFactory connects to PLCs, SCADA, MES, and CMMS to deliver real-time dashboards, automated OEE tracking, downtime Pareto, quality analytics, and AI-driven root cause analysis — all in a single platform deployable on-premise or in the cloud.
What Is Manufacturing Analytics — and Who Uses It?
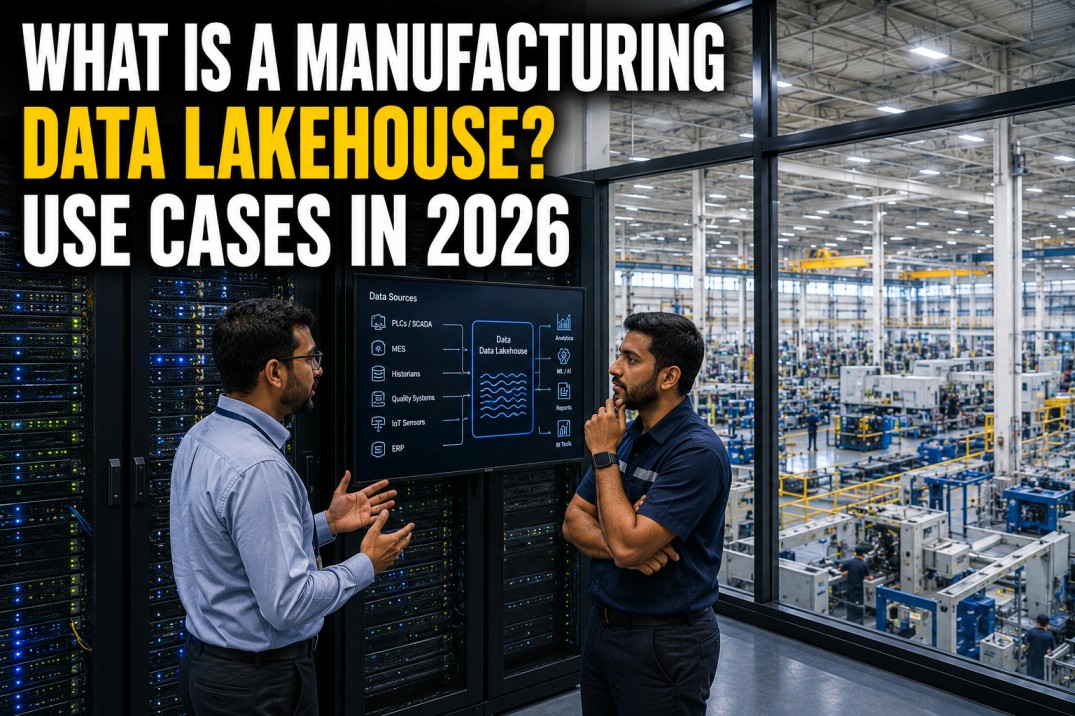
Manufacturing analytics is the practice of collecting, integrating, and analysing production data from equipment, processes, and quality systems to improve operational performance. It sits above individual data sources — PLCs, SCADA, MES, CMMS, ERP — and provides a unified view of plant performance that no single source can deliver alone.
Decision Matrix — How to Score Manufacturing Analytics Platforms
Not every manufacturing analytics platform is built for the same use case. Some excel at real-time dashboards for the plant floor; others are optimised for enterprise BI reporting. Use this decision matrix to weight your evaluation criteria before you start vendor demos. Assign each platform a score of 1-5 per criterion, multiply by the weight, and compare weighted totals.
Can the platform surface OEE, downtime, and production counts in sub-second latency across all lines without manual refresh?
Does it connect natively to PLCs (OPC-UA, Modbus, Siemens, Rockwell), SCADA, MES, ERP, and CMMS without custom coding?
Are root cause analysis, anomaly detection, and predictive maintenance built into the platform or require third-party bolt-ons?
Can shift supervisors, process engineers, and executives each get role-specific dashboards without IT support or custom development?
Feature Checklist — Must-Have vs. Nice-to-Have in 2026
The manufacturing analytics market has matured significantly since 2022. Features that were differentiators three years ago are now table stakes. This checklist separates what every platform must have from what separates leaders from followers.
Vendor Evaluation Scorecard — Weighted Criteria Template
Use this scorecard template during vendor demonstrations. Score each platform on a 1-5 scale (5 = exceeds expectations, 1 = does not meet requirements) and calculate the weighted total. This ensures your evaluation is objective and comparable across vendors rather than being influenced by which demo was most polished.
| Criteria | Weight | Your Score (1-5) | Weighted Score | Notes |
|---|---|---|---|---|
| Real-Time Monitoring & Dashboards | 30% | — | — | — |
| Data Integration & Connectivity | 25% | — | — | — |
| Analytics & AI Capabilities | 20% | — | — | — |
| Ease of Use & Deployment | 15% | — | — | — |
| Support, Training & Vendor Strength | 10% | — | — | — |
| Weighted Total | 100% | — | — | — |
Implementation Timeline — What to Expect From Vendor Selection to Full Rollout
A typical manufacturing analytics implementation runs 14-20 weeks from vendor selection to full production rollout. The timeline depends on the number of data sources, plant complexity, and whether the deployment is cloud-based or on-premise. The table below shows a realistic phased approach.
Deploy Manufacturing Analytics in Weeks — Not Months — With iFactory
iFactory gives you a unified analytics platform that connects to your existing plant data sources out of the box. Real-time OEE dashboards, downtime Pareto, quality tracking, and AI-driven root cause analysis are all included — no custom development required. Deploy on-premise or in the cloud.
Frequently Asked Questions — Manufacturing Analytics 2026
What is manufacturing analytics and how is it different from MES?
Manufacturing analytics is the practice of collecting, integrating, and visualising production data from multiple sources — PLCs, SCADA, MES, CMMS, ERP — to deliver cross-system insights. An MES (Manufacturing Execution System) focuses on executing and tracking production orders: routing, labour tracking, serialisation, and genealogy. Manufacturing analytics sits on top of (or alongside) the MES to provide trend analysis, loss categorisation, root cause investigation, and predictive insights that no single source system can produce alone. Many plants have an MES but still cannot answer basic questions like "what was our OEE last shift and why did it drop?" — that gap is what manufacturing analytics fills. Book a Demo to see how iFactory bridges this gap.
Who in a manufacturing plant uses analytics platforms — and for what?
Different roles use analytics differently. Plant managers use dashboards for real-time OEE and shift performance visibility. Continuous improvement engineers use Pareto analysis and trend data to prioritise kaizen projects. Maintenance teams use condition monitoring and anomaly alerts to shift from reactive to predictive maintenance. Quality managers use first-pass yield trends and defect Pareto to identify systemic quality issues. Production supervisors use real-time line status and stop alerts to respond faster to disruptions. Executive leadership uses plant-to-plant comparison dashboards and high-level KPI scorecards for strategic decisions. A platform that serves only one of these roles is a departmental tool, not a plant-wide analytics system.
How do manufacturing analytics platforms connect to plant data sources?
Most platforms connect through industrial communication protocols — OPC-UA (the open standard), Modbus TCP, Siemens S7, Rockwell CIP, Mitsubishi SLMP, and vendor-specific APIs for MES, ERP, and CMMS systems. Some platforms offer edge gateways that sit on the plant network to collect data from PLCs and machine controllers, buffer it locally, and transmit it to the analytics engine. The best platforms provide both direct protocol connectivity and edge-based collection because they let you mix and match based on the age and type of equipment on your line. Avoid platforms that require all data to pass through a single middleware layer — this creates a single point of failure and a licensing cost centre.
How long does it take to implement a manufacturing analytics platform?
A typical implementation runs 14-20 weeks from vendor selection to full production rollout across a single plant. The timeline breaks down as: 1-3 weeks for vendor selection and proof of concept, 4-8 weeks for data source connectivity and integration, 9-12 weeks for dashboard configuration and pilot rollout on one line, 13-16 weeks for training and full rollout across the plant, and week 17 onward for optimisation and scale. Cloud-based deployments tend to be faster because infrastructure provisioning is eliminated. On-premise deployments add 2-4 weeks for server setup, network configuration, and IT security review. Multi-plant rollouts typically take 4-6 months per additional plant after the first site is operational.
What should I look for when evaluating manufacturing analytics vendors in 2026?
In 2026, the key differentiators are: 1) Native connectivity breadth — does the platform connect directly to your specific PLCs and systems without custom middleware or professional services? 2) Real-time vs. batch architecture — can it surface sub-second updates, or does it run on scheduled data refreshes? 3) Built-in AI/ML — does it include anomaly detection and root cause analysis, or are these add-on modules? 4) Deployment flexibility — does it support on-premise, cloud, and hybrid without architectural changes? 5) Role-specific usability — can operators, engineers, and executives each get relevant views without IT support? 6) Total cost of ownership — what are the connector licensing costs, user seat costs, and storage costs at scale? The platform that scores highest on these criteria for your specific plant configuration is the right choice.
Connect Your Plant Data and See Your First Dashboard in Days — Not Months
iFactory connects to your existing PLCs, SCADA, MES, and CMMS systems out of the box. Real-time dashboards, OEE tracking, downtime Pareto, quality analytics, and AI-driven root cause analysis are included. Deploy on-premise or in the cloud. See your first live dashboard within days of connecting your first machine.