Manufacturing analytics implementations fail at a higher rate than they succeed — not because the technology does not work, but because the implementation does not start with a clear problem, does not involve the people who will use the output, and does not prioritise adoption over feature count. A 60-point analytics implementation checklist forces the discipline that most projects skip: defining success metrics before go-live, establishing data quality baselines before building dashboards, limiting Phase 1 scope to the highest-impact use cases, and building the review process that converts analytics output into operational decisions. This checklist covers every phase of a manufacturing analytics rollout — from business case and data infrastructure through KPI definition, pilot deployment, change management, and sustained adoption into 2026.
Implement Manufacturing Analytics Correctly — iFactory Is Live in 2 Weeks
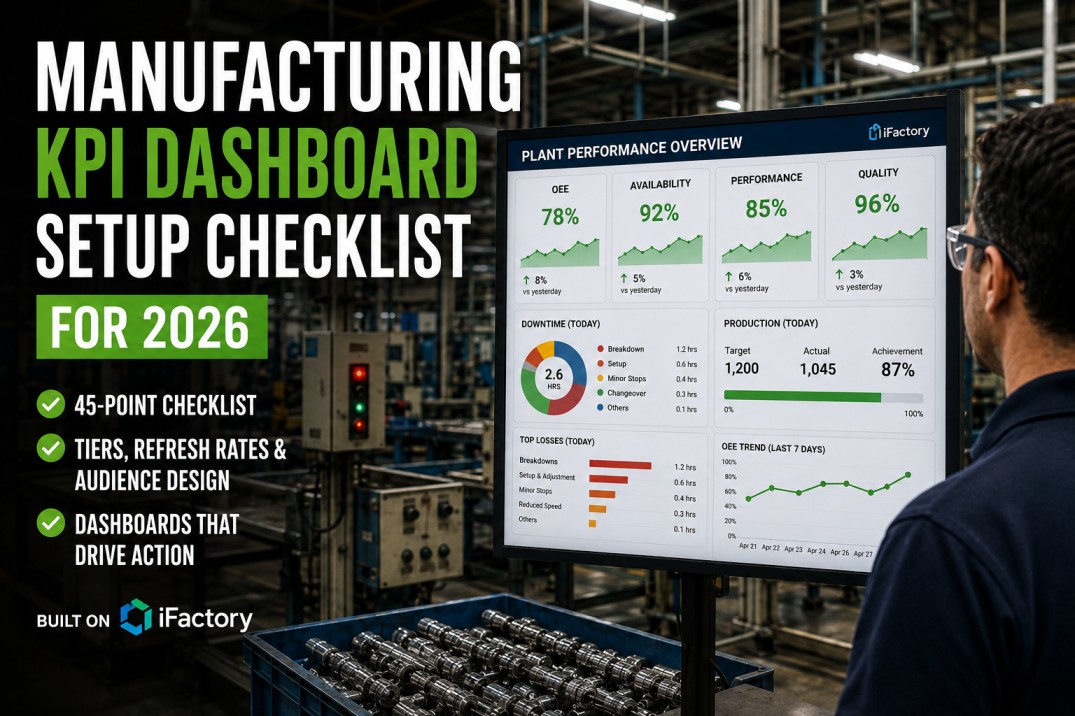
iFactory delivers production, quality, maintenance, and downtime analytics from a single connected platform — pre-built KPI dashboards, OEE tracking, downtime Pareto, and AI-driven anomaly detection.
Business Case and Stakeholder Alignment
Manufacturing analytics implementations that succeed begin with a specific operational problem, not a technology decision. Before selecting a platform, connecting a data source, or defining a KPI, the organisation must answer: what decisions are we making badly because we lack data, and what would we do differently if we had it? An analytics programme launched to "get better visibility" without a specific improvement target produces dashboards nobody acts on and a business case that cannot be measured.
Problem First, Technology Second
Document the top three operational problems: "We do not know which line is causing the OTIF miss until the end of the week", "Maintenance cannot predict which machines will fail next shift", "Quality team does not find out about a defect trend until the customer calls." Each is a specific analytics use case.
Quantify the Business Case
Every analytics investment has a quantifiable return: OEE improvement of 3 percentage points on a line running 2,000 hours per year at a given output rate = X units of additional revenue. Downtime reduction of 15 minutes per shift = Y hours of additional capacity. Quantify before you commit.
Executive Sponsor, Not IT Owner
Analytics programmes owned only by IT do not get adopted by production. The executive sponsor must be the VP of Operations or Plant Manager — someone with the authority to mandate dashboard reviews, protect implementation time, and tie analytics outputs to operational performance reviews.
End User Involvement from Day One
Operators and supervisors who are not involved in requirements gathering will not use the output. Run a one-day workshop with operators, supervisors, and maintenance technicians before any configuration begins. Ask: what questions do you spend the most time trying to answer? The answers define Phase 1 scope.
Define Success Before You Start
Write down before go-live: what OEE improvement, downtime reduction, or quality cost reduction would constitute success after 90 days? After 12 months? These are the metrics the analytics ROI review will be measured against. If you define success after go-live, you will redefine it to match whatever happened.
Scope Phase 1 Tightly
Breadth-first analytics implementations — connecting every data source, building 40 KPIs, deploying to all five plants in Phase 1 — consistently underdeliver. Start with one to two lines, three to five KPIs, and the highest data-readiness assets. Prove value in 90 days, then expand.
Data Sources and Infrastructure
The foundation of every manufacturing analytics programme is data quality. A beautifully designed dashboard fed by inaccurate, incomplete, or inconsistently defined data produces wrong decisions confidently — which is worse than no analytics at all. Before connecting any data source to an analytics platform, establish a data quality baseline for each source and a plan to address the gaps identified. The data quality assessment phase is not optional and is not something that can be addressed after go-live.
Source System Inventory
List every system that holds production-relevant data: MES, ERP, SCADA, PLC historian, QMS, CMMS, spreadsheets, paper logs. For each, identify: what data it holds, how often it updates, who owns it, and what its current data quality issues are.
Data Quality Baseline
For each source, rate completeness (% of records populated), accuracy (% of records validated correct), and timeliness (average lag between event and record). Sources with completeness below 80% need remediation before they feed analytics.
Integration Architecture
Define the connection method for each source: REST API, direct database connection, file export and ingestion, MQTT for IoT sensors, or manual entry. Document the integration spec before any connector is built.
Data Owner Assignment
Every data source has a named owner responsible for data quality, access management, and change notification. When a source system changes its data format or schema, the analytics platform owner must be notified before the change goes live.
Refresh Rate by Use Case
Operator shift dashboard: real-time or 5-minute refresh. Supervisor summary: 15-minute refresh. Plant manager trend: hourly or daily. Executive scorecard: daily or weekly. Match refresh rate to the decision cycle, not to technical capability.
Stale Data Handling
Define what happens when a data feed stops: does the dashboard show the last known value, a "data unavailable" indicator, or an alert? Document the stale data handling rule for every KPI before go-live. Never display stale data as current without a clear timestamp.
Deployment — Pilot to Full Rollout
The highest-risk phase of a manufacturing analytics implementation is the transition from a successful pilot to full plant or multi-plant rollout. Implementations that execute a rigorous pilot — with defined go-live criteria, a parallel-running period, and formal end-user sign-off — have significantly higher adoption rates than those that move from pilot to rollout on the basis of technology readiness alone. The pilot is not a proof of concept for the technology; it is a proof of concept for the organisational change.
Select the pilot line based on: highest data readiness (machine data already captured), highest improvement opportunity (visible OEE or quality losses), supportive supervisor and team lead, and physical proximity to IT support during go-live. Do not start with the most complex line or the most sceptical team.
Run the analytics platform alongside the existing reporting method for a minimum of two weeks after go-live. This period catches data discrepancies, formula errors, and user training gaps before the old system is decommissioned. Parallel running is consistently the step most implementations skip and the one that causes the most painful post-go-live issues.
Train operators and supervisors on the specific decisions they will make using the analytics output — not on the platform features. A 30-minute session that covers: how to read your shift dashboard, how to enter a downtime reason code, and who to escalate a red KPI to, is more valuable than a two-hour platform tour.
Define before the pilot begins: what must be true for the pilot to be considered successful and for rollout to proceed? Criteria might include: data feed uptime above 95%, downtime capture rate above 90%, at least 3 improvement actions generated and closed from the pilot dashboard, and operator survey score above 7/10 for dashboard usefulness.
Sustained Adoption — Making Analytics Part of Operations
Analytics adoption decays without a deliberate management process. The half-life of a new dashboard is approximately 90 days without a structured review cadence and visible action ownership. The organisations that sustain manufacturing analytics programmes for three or more years treat the review process — the meeting, the action log, and the escalation protocol — as the core of the programme, not the technology. The technology is the enabler; the management process is the system.
Do not create new meetings for analytics reviews. Embed OEE and downtime review in the existing daily production meeting. Add KPI trend review to the existing weekly management meeting. Analytics that require a new recurring meeting will be deprioritised within six weeks.
Every action generated from an analytics review is logged with owner and due date in the same system where the analytics live — not in a separate spreadsheet. Actions not closed by their due date are escalated in the next review meeting. The action log is the evidence that analytics is driving operational decisions.
Every quarter, review the analytics programme against the original business case: is OEE improving on the lines where the programme is active? Is downtime trending in the right direction? Is quality cost decreasing? If the programme is not driving measurable improvement, diagnose why — data quality, adoption, scope, or action follow-through — before adding more features.
Do not define Phase 2 analytics scope before 90 days of Phase 1 data is available. Phase 1 data reveals which use cases are delivering value and which are not — and which new use cases are emerging from the operational visibility Phase 1 provided. Phase 2 scope driven by real operational insight delivers higher ROI than scope driven by original project plan assumptions.
The analytics programme itself needs continuous improvement: quarterly user feedback, annual scope review, data quality auditing, and KPI relevance assessment. Analytics that were meaningful 18 months ago may no longer reflect the current business priorities or process capability. The programme management process is the mechanism for keeping analytics aligned to the operations it serves.
Implement Manufacturing Analytics in Weeks, Not Months — iFactory
iFactory delivers manufacturing analytics implementation in two to eight weeks — pre-built OEE, downtime, quality, and maintenance dashboards, structured rollout support, data quality assessment, and the onboarding process this checklist describes.
Manufacturing Analytics Implementation Checklist — 30 Items
Use this checklist when planning or auditing a manufacturing analytics implementation. Items span all four phases: business case and stakeholder alignment, data infrastructure, KPI definition and deployment, and sustained adoption.
| # | Checklist Item | Type | Priority | Photo | Required | Critical |
|---|---|---|---|---|---|---|
| 1 | Top 3 operational pain points driving the analytics investment documented and agreed | Pass/Fail | High | — | ✓ | ✓ |
| 2 | Executive sponsor identified and committed — not just IT project ownership | Pass/Fail | High | — | ✓ | ✓ |
| 3 | Business case quantified: expected improvement in OEE, downtime, quality cost, or OTIF | Pass/Fail | High | — | ✓ | ✓ |
| 4 | End users (operators, supervisors, managers) consulted in requirements gathering | Pass/Fail | High | — | ✓ | ✓ |
| 5 | Success metrics defined before implementation begins — not after go-live | Pass/Fail | High | — | ✓ | ✓ |
| # | Checklist Item | Type | Priority | Photo | Required | Critical |
|---|---|---|---|---|---|---|
| 6 | All required data sources identified: MES, ERP, SCADA, PLC, QMS, CMMS | Pass/Fail | High | — | ✓ | ✓ |
| 7 | Data quality baseline established for each source — completeness, accuracy, timeliness rated | Pass/Fail | High | — | ✓ | ✓ |
| 8 | Data owners identified for each source system — responsible for quality and access | Pass/Fail | High | — | ✓ | ✓ |
| 9 | Integration method defined per source: API, direct connector, file export, or manual entry | Pass/Fail | High | — | ✓ | ✓ |
| 10 | Data refresh frequency agreed: real-time, near-real-time (5–15 min), or batch (hourly/daily) | Pass/Fail | High | — | ✓ | ✓ |
| 11 | Data governance policy in place: access controls, retention period, and PII handling | Pass/Fail | High | — | ✓ | ✓ |
| # | Checklist Item | Type | Priority | Photo | Required | Critical |
|---|---|---|---|---|---|---|
| 12 | Phase 1 KPI list limited to 5–8 metrics — breadth-first implementations consistently fail | Pass/Fail | High | — | ✓ | ✓ |
| 13 | Each KPI has documented formula, data source, owner, target, and review cadence | Pass/Fail | High | — | ✓ | ✓ |
| 14 | OEE, downtime, and first-pass yield in scope for Phase 1 — highest impact, most universal | Pass/Fail | High | — | ✓ | ✓ |
| 15 | Advanced analytics (AI-driven anomaly detection, predictive maintenance) scoped for Phase 2+ | Pass/Fail | Med | — | ✓ | — |
| 16 | Maintenance analytics (MTBF, MTTR, PM compliance) included in initial scope | Pass/Fail | Med | — | ✓ | — |
| 17 | Supply chain and inventory analytics scoped separately — not mixed with production analytics in Phase 1 | Pass/Fail | Med | — | ✓ | — |
| # | Checklist Item | Type | Priority | Photo | Required | Critical |
|---|---|---|---|---|---|---|
| 18 | Pilot line selected — highest data readiness, highest improvement opportunity, supportive team | Pass/Fail | High | — | ✓ | ✓ |
| 19 | Go-live criteria defined before pilot begins — what must be true to proceed to full rollout | Pass/Fail | High | — | ✓ | ✓ |
| 20 | Operator and supervisor training completed before go-live on pilot line | Pass/Fail | High | — | ✓ | ✓ |
| 21 | Parallel running period: old reporting method and new analytics run simultaneously for 2–4 weeks | Pass/Fail | High | — | ✓ | ✓ |
| 22 | Rollout sequence defined for remaining lines after pilot — based on data readiness | Pass/Fail | Med | — | ✓ | — |
| 23 | Resistance from supervisors or operators identified early — addressed through involvement, not mandate | Pass/Fail | High | — | ✓ | ✓ |
| # | Checklist Item | Type | Priority | Photo | Required | Critical |
|---|---|---|---|---|---|---|
| 24 | Dashboard review meeting cadence established and protected — not cancelled when busy | Pass/Fail | High | — | ✓ | ✓ |
| 25 | Actions from analytics reviews logged, owned, and tracked to closure | Pass/Fail | High | — | ✓ | ✓ |
| 26 | Analytics ROI reviewed quarterly against the original business case metrics | Pass/Fail | Med | — | ✓ | — |
| 27 | New KPIs added to the analytics scope only through a formal scoping process — no ad hoc additions | Pass/Fail | Med | — | ✓ | — |
| 28 | User feedback collected quarterly — dashboard design and KPI relevance reviewed with end users | Pass/Fail | Med | — | ✓ | — |
| # | Checklist Item | Type | Priority | Photo | Required | Critical |
|---|---|---|---|---|---|---|
| 29 | Maturity level assessed: Descriptive (what happened) → Diagnostic (why) → Predictive (what next) → Prescriptive (what to do) | Selection | Med | — | ✓ | — |
| 30 | Phase 2 scope defined after 90 days of Phase 1 data — not before | Pass/Fail | Med | — | ✓ | — |
Frequently Asked Questions
What is manufacturing analytics?
Manufacturing analytics is the collection, integration, and analysis of operational data — production output, equipment performance, quality results, downtime events, and maintenance records — to generate insights that improve manufacturing efficiency, quality, and cost. The maturity spectrum runs from descriptive analytics (what happened: OEE reports, downtime logs) through diagnostic analytics (why it happened: root cause analysis dashboards) to predictive analytics (what will happen: machine failure prediction, quality deviation alerts) and prescriptive analytics (what to do: automated maintenance scheduling, production optimisation).
Why do manufacturing analytics implementations fail?
The most common causes of manufacturing analytics failure are: no clear operational problem driving the investment (technology-led rather than problem-led), poor data quality that is not assessed before go-live, scope too broad for Phase 1 (too many KPIs, too many sites, too many data sources simultaneously), insufficient end user involvement in design, and no structured review process to convert dashboard outputs into operational decisions. The analytics checklist framework addresses every one of these failure modes.
What should be in scope for Phase 1 of a manufacturing analytics implementation?
Phase 1 should include: OEE tracking (Availability, Performance, Quality) on the pilot line, unplanned downtime capture and Pareto with reason codes, first-pass yield and top defect reason codes, and shift-level dashboards for operators and supervisors. These five use cases have the highest data readiness, the clearest improvement pathway, and the most immediate visibility to production teams. Advanced use cases — predictive maintenance, AI anomaly detection, supply chain analytics — should be Phase 2 after Phase 1 is proven. Book a Demo to see iFactory Phase 1 scope.
How long does a manufacturing analytics implementation take?
A focused Phase 1 implementation — one to two lines, three to five KPIs, live dashboards for operators and supervisors — should be achievable in four to eight weeks from data connection to go-live. Implementations that take longer are usually delayed by data quality remediation, integration complexity with legacy systems, or internal change management challenges. iFactory typically goes live within two weeks for standard data connections, with full plant rollout in six to eight weeks for most manufacturers.
How do you measure the ROI of a manufacturing analytics implementation?
ROI measurement starts with the pre-implementation baseline: average OEE per line, average unplanned downtime per shift, first-pass yield rate, and cost of poor quality. After 90 days of operation, measure the same metrics and calculate the improvement. Translate improvements into financial terms: each OEE percentage point improvement equals a specific number of additional units per shift at the line's output rate. Downtime reduction of 10 minutes per shift across 20 lines over 250 working days equals a calculable additional capacity in units or revenue. Book a Demo to see how iFactory tracks analytics ROI against your original business case.
iFactory Manufacturing Analytics — Structured Implementation, Measurable ROI
iFactory delivers manufacturing analytics from day one with OEE, downtime, quality, and maintenance analytics — live in two to eight weeks with proven implementation process.