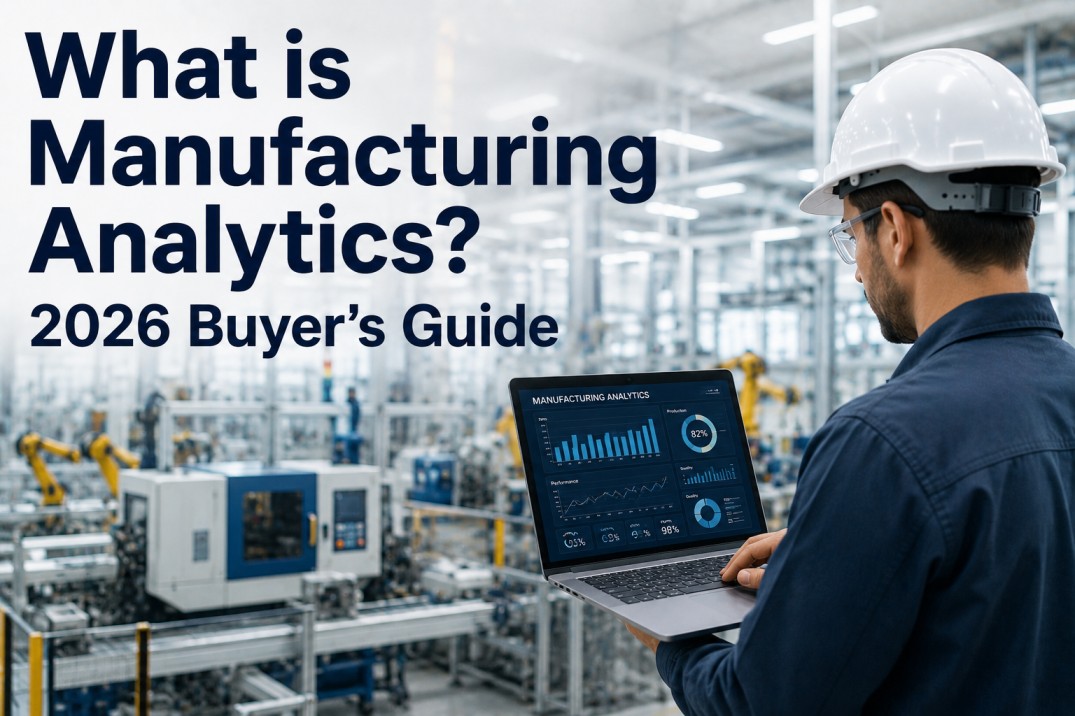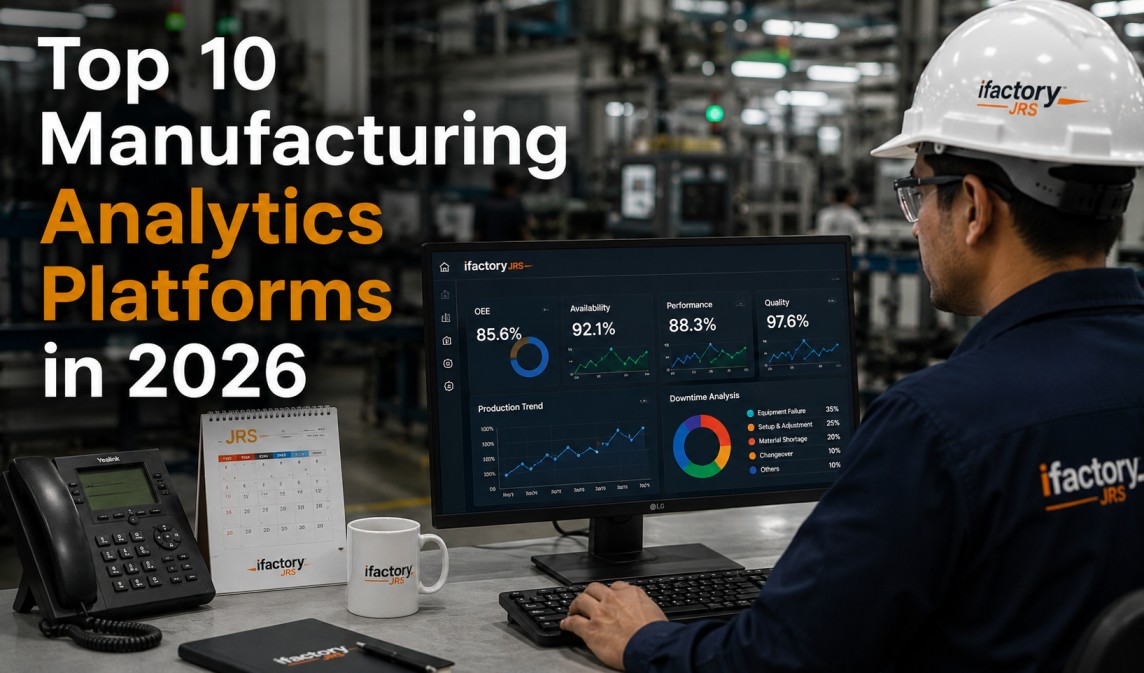
The manufacturing analytics market has reached an inflection point. In 2025, the global market crossed $12.1 billion and is projected to hit $62 billion by 2035, growing at 17.8% CAGR. But here is what the analysts will not tell you: 73% of factory data still goes unused, and the average manufacturer loses $2.4 million on analytics deployments that lack a phased roadmap. The platforms that win in 2026 are not the ones with the most charts. They are the ones that turn machine data into decisions before the next shift ends. This guide ranks the top 10 manufacturing analytics platforms based on real-world industrial deployment criteria: AI maturity, integration depth, time-to-value, and verifiable ROI.
See How iFactory's AI Analytics Platform Delivers Measurable ROI in Weeks
From phased deployment to predictive maintenance, energy analytics, and autonomous work order generation — iFactory connects to your existing equipment from day one.
The Manufacturing Analytics Landscape in 2026
Four trends define the 2026 analytics landscape. First, AI-powered predictive analytics has moved from experimental to operational — manufacturers now expect failure predictions 14-21 days in advance, not just threshold alarms. Second, the cloud-versus-edge debate has resolved into a hybrid reality: real-time decisions happen at the edge, while cross-plant benchmarking lives in the cloud. Third, the digital twin market is growing at 48% CAGR, and analytics platforms that integrate simulation with real-time data are pulling ahead. Fourth, the rise of agentic AI — autonomous AI agents that monitor, analyze, and act without human intervention — is redefining what manufacturers expect from their analytics investment.
Top 10 Manufacturing Analytics Platforms Compared
Each platform was evaluated on AI capability, deployment flexibility, integration ecosystem, time-to-first-value, and total cost of ownership. The ranking prioritizes platforms that deliver measurable operational outcomes over those with the most features on paper.
| Rank | Platform | AI Maturity | Deployment | Time to Value | Best For |
|---|---|---|---|---|---|
| 1 | iFactory AI Analytics | Agentic AI, predictive, prescriptive | On-prem edge + cloud hybrid | 4-6 weeks | End-to-end factory intelligence |
| 2 | Seeq | Advanced time-series ML | SaaS / on-prem | 4-8 weeks | Process manufacturing analytics |
| 3 | Sight Machine | Agentic AI, digital twin | SaaS + Azure | 8-16 weeks | Enterprise-scale industrial AI |
| 4 | TrendMiner | Pattern recognition ML | SaaS / on-prem | 6-10 weeks | Time-series pattern analysis |
| 5 | AVEVA PI System | Rules-based + ML | On-prem / hybrid | 12-20 weeks | Historian-based analytics |
| 6 | Tulip | No-code analytics | SaaS | 4-8 weeks | Shop floor apps + analytics |
| 7 | MachineMetrics | Predictive maintenance ML | SaaS | 4-6 weeks | Machine monitoring + OEE |
| 8 | Rockwell FactoryTalk | Integrated MES analytics | On-prem / cloud | 12-24 weeks | Rockwell automation ecosystems |
| 9 | Microsoft Power BI + Factory | General BI + AI add-ons | SaaS | 2-6 weeks | Custom reporting needs |
| 10 | Qlik Sense | Associative analytics ML | SaaS / on-prem | 6-12 weeks | Multi-source data correlation |
How to Evaluate Manufacturing Analytics Platforms
Vendor demonstrations all look impressive with simulated data. The real test comes when the platform connects to your actual production environment. Use these six criteria to separate platforms that deliver from those that only present well.
Edge AI, Agentic Intelligence, and Phased Deployment — All in One Platform
iFactory connects directly to your PLCs, predicts failures 14-21 days in advance, auto-generates CMMS work orders, and delivers first measurable value in 4-6 weeks. Full ROI typically reaches 10-30x within 12-18 months.
How the Top 3 Platforms Compare in Real-World Deployments
The gap between platforms is not in feature checklists — it is in deployment philosophy. The following comparison examines how three leading platforms approach the same manufacturing challenge: reducing unplanned downtime through predictive analytics.
iFactory AI Analytics
iFactory deploys as a turnkey edge appliance with pre-configured NVIDIA GPU, connecting to 12 sensors on pilot assets within the first week. LSTM and gradient boosting models begin learning normal behavior immediately. The platform generates its first predictive alert by week three and auto-generates work orders in the CMMS by week five. A food and beverage plant deploying iFactory on three packaging lines reduced unplanned downtime by 34% in the first 90 days, saving $420,000 in avoided emergency repairs and lost production time. The platform's generative AI assistant lets operators ask questions in natural language across 12 supported languages, eliminating the data literacy barrier that kills adoption in most analytics deployments.
Seeq
Seeq excels at time-series analytics for process manufacturing. Its strength is enabling engineers to investigate historical data without IT assistance, using a spreadsheet-like interface that process engineers find intuitive. Seeq works best when the data infrastructure is already in place — it connects to existing historians and requires clean, structured time-series data. A chemical manufacturer using Seeq reduced batch cycle time by 8% by identifying process parameter correlations that had been invisible in traditional trend charts. Seeq's AI capabilities are focused on pattern recognition and anomaly detection rather than prescriptive recommendations.
Sight Machine
Sight Machine positions as an enterprise industrial AI platform with agentic AI capabilities introduced in 2026. Its AI agent crews continuously monitor production and optimize KPIs like throughput and quality. Sight Machine builds a semantic layer that maps manufacturing processes into a continuously updated digital representation — a powerful foundation for enterprise-wide analytics. Deployment requires more upfront data infrastructure work than the top-ranked platform, making it better suited to large manufacturers with dedicated data engineering teams. An automotive supplier deploying Sight Machine across four plants achieved a 22% reduction in quality defects over six months by using the platform's causal AI to identify root causes across complex multi-stage assembly processes.
A 4-Step Framework for Selecting Your Analytics Platform
Manufacturers that rush platform selection without a structured evaluation process are six times more likely to abandon their analytics investment within 18 months. Use this framework to ensure your choice delivers measurable operational and financial results.
iFactory's Phased Deployment Model Delivers Proof Before Commitment
Start with a 12-sensor pilot on your most critical assets. iFactory provides the edge hardware, AI models, integration, and support — with first measurable value in 4-6 weeks. If the pilot does not meet your ROI threshold, there is no obligation to expand.
Frequently Asked Questions — Manufacturing Analytics Platforms
What is the difference between manufacturing analytics and traditional BI?
Traditional business intelligence tools like Power BI and Tableau are designed for structured, aggregated data. Manufacturing analytics platforms are built for time-series sensor data, machine events, and production context. A BI tool can show you that OEE dropped yesterday. A manufacturing analytics platform tells you OEE dropped because Filling Line 3 had 14 micro-stops caused by a degrading photo-eye sensor, and predicts the sensor will fail in 9 days. The difference is context: manufacturing analytics understands that data points are connected in time and space within a production process.
How long does it take to deploy a manufacturing analytics platform?
Deployment timelines vary significantly by platform architecture. Cloud-only platforms can connect within days if your data is already cloud-ready, but on-prem integration adds 4-8 weeks. Turnkey edge appliance platforms like iFactory deliver first insights in 4-6 weeks because the edge hardware, AI models, and integration are pre-configured. Enterprise platforms with extensive data infrastructure requirements can take 12-24 weeks before delivering actionable insights. The fastest path to value is a phased deployment starting with 10-20 pilot assets on a platform purpose-built for edge-first manufacturing analytics.
What ROI can I expect from a manufacturing analytics platform?
ROI depends on deployment approach and platform capability. Manufacturers who follow a phased deployment model with a platform that delivers financial reporting typically achieve 10-30x ROI within 12-18 months. The primary value drivers are: reduced unplanned downtime (30-50% reduction typical), lower maintenance spend (15-25%), improved quality yield (10-20% defect reduction), and energy optimization (8-15% savings). Platforms that auto-generate work orders and track savings in dollars consistently outperform those that only display dashboards because they close the gap between insight and action.
Do I need a data science team to use manufacturing analytics?
Not with modern platforms. The leading manufacturing analytics platforms in 2026 embed domain-specific AI models that are pre-trained for manufacturing use cases. iFactory, Sight Machine, and TrendMiner all offer no-code interfaces where operators and engineers can query data in natural language. Generic BI tools still require dedicated data analysts to build and maintain reports. When evaluating platforms, ask about the data literacy level required for daily use. The best platforms are designed for plant floor personnel, not data scientists.
Should analytics run at the edge or in the cloud?
The answer in 2026 is both. Real-time decisions — machine shutdown, quality rejection, parameter adjustment — must happen at the edge with millisecond latency. Cloud round-trips of 200-800ms are too slow for production-critical actions. Cross-plant analytics, trend analysis, and executive reporting belong in the cloud where aggregate data from multiple facilities can be compared. The best architecture is edge-first with cloud aggregation: AI models run on-prem for real-time decisions, and anonymized insights flow to the cloud for enterprise benchmarking and model retraining. iFactory uses this exact architecture with its NVIDIA-powered edge appliance.