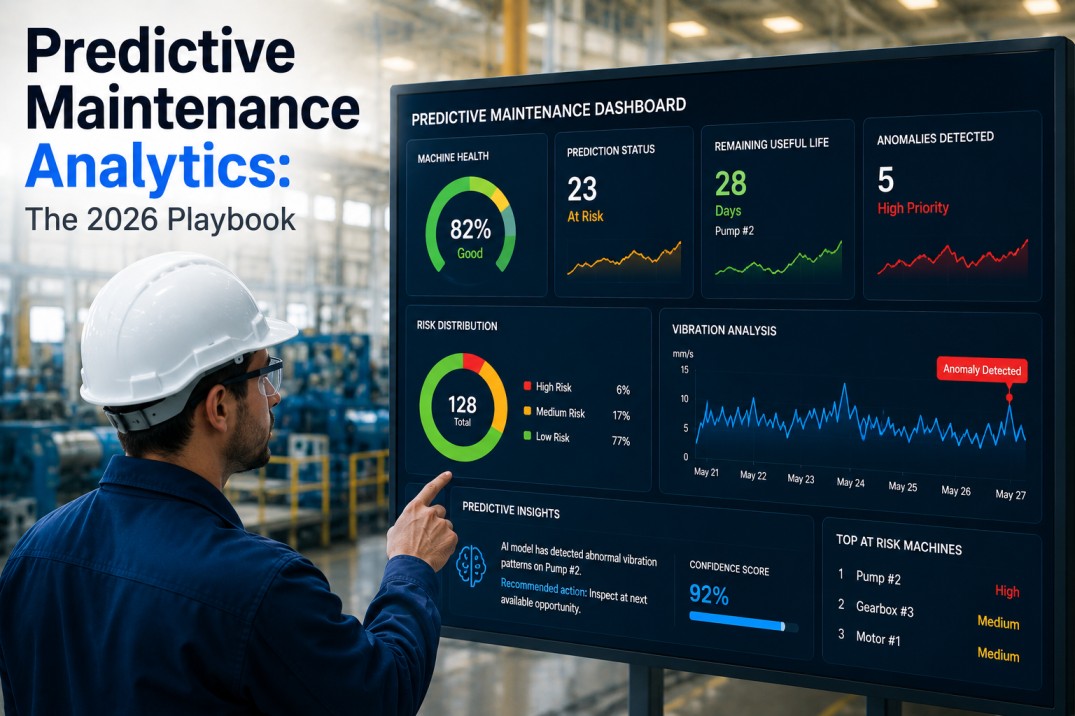
Every hour of unplanned downtime costs manufacturers an average of $260,000 across discrete industries and up to $2.3 million in automotive production. Yet 82% of plants still rely on calendar-based preventive maintenance that replaces healthy components while missing the failures that actually cause shutdowns. The 2026 predictive maintenance playbook is not about installing sensors and waiting for alerts. It is about building a layered analytics architecture that converts vibration, thermal, and current data into failure predictions 14 to 21 days before breakdown — with automated work orders, spare parts triggers, and measurable ROI per asset. This playbook covers the technology stack, the deployment sequence, and the financial model that separates predictive maintenance programs that deliver from those that drain budgets.
Deploy iFactory's Predictive Analytics in 4–6 Weeks — Edge Hardware Included
iFactory ships as a turnkey NVIDIA edge appliance with pre-configured AI models, sensor integration, and CMMS connectivity. First predictive alerts by week three. Full ROI typically 10–30x within 12 months.
Where Predictive Maintenance Analytics Stands in 2026
Three forces have converged to make 2026 the year predictive maintenance shifts from early adopter to competitive necessity. Edge computing has matured to the point where complex models run on plant-floor hardware with sub-10ms inference latency. Open-standard sensor protocols have eliminated the proprietary lock-in that plagued earlier IIoT deployments. And the maintenance maturity model has become a boardroom metric: companies at Level 4 predictive maintenance spend $5–10 per operating hour against $18–25 at Level 1, while experiencing less than half the unplanned downtime. The market for predictive maintenance analytics will reach $28.3 billion by 2028 according to MarketsandMarkets, driven by the simple arithmetic that replacing a bearing before it fails costs $500 while the emergency repair, lost production, and collateral damage from a catastrophic failure averages $87,000.
The Predictive Maintenance Maturity Ladder
The Five Technology Pillars of a 2026-Ready PdM Program
A predictive maintenance program is only as strong as its weakest layer. The five pillars below must be deployed in sequence — skipping a layer creates data gaps that corrupt predictions and erode operator trust. Each pillar below includes the specific technology choices that production-proven programs use.
iFactory Ships with All Five Layers Pre-Integrated — Sensors, Edge Hardware, AI Models, CMMS Connectors, and ROI Dashboards
No systems integrator required. No custom model development. iFactory arrives ready to connect to your first 12 assets and deliver predictive alerts within three weeks of installation.
Four Critical Predictive Maintenance Plays for 2026
These four deployment plays represent the highest-ROI starting points for predictive maintenance analytics. Each play includes the asset type, sensor configuration, expected prediction window, and documented financial outcomes from real manufacturing deployments.
Bearing Failure Prediction
Motor Winding Degradation
Hydraulic System Leak Detection
Conveyor System Wear Prediction
Cost of Reactive vs. Cost of Predictive — The Financial Comparison
The business case for predictive maintenance analytics rests on a single comparison: the cost of preventing failure versus the cost of reacting to it. The scoreboard below uses benchmark data from manufacturing plants across automotive, food processing, chemical, and heavy industry sectors.
| Cost Category | Reactive (Run-to-Failure) | Preventive (Time-Based PM) | Predictive (AI-Driven) |
|---|---|---|---|
| Maintenance cost per operating hour | $18–25 | $12–16 | $5–10 |
| Unplanned downtime rate | 15–25% of operating time | 8–14% of operating time | Under 5% of operating time |
| Emergency repair cost premium | 3–5x planned repair cost | 1.5–2x planned repair cost | 1–1.2x planned repair cost |
| Asset lifespan achieved | 60–70% of design life | 80–90% of design life | 100–120% of design life |
| Spare parts inventory cost | High (safety stock for unknowns) | Medium (calendar-based ordering) | Low (data-driven demand planning) |
| Reactive work ratio | 70–85% of total work | 30–50% of total work | Under 15% of total work |
The 3-Phase Predictive Maintenance Deployment Roadmap
The difference between a predictive maintenance program that delivers ROI in months and one that stalls is deployment phasing. Plants that attempt to instrument all assets at once experience 3x longer time-to-value than those that follow a wave-based approach. The three-phase model below has been validated across 100+ manufacturing deployments.
iFactory Delivers a Complete Phase-1 Deployment — Sensors, Edge Appliance, AI Models, and CMMS Integration — as a Single Turnkey Package
No multi-vendor coordination. No custom development. No data science team required. iFactory starts delivering predictive alerts within three weeks of installation. Book a demo to see the deployment sequence for your plant.
Frequently Asked Questions — Predictive Maintenance Analytics
What is the difference between preventive and predictive maintenance?
Preventive maintenance performs service on a fixed schedule — every 1,000 operating hours or every 90 days — regardless of the asset's actual condition. This approach replaces healthy components (wasting 40–60% of maintenance budget) while still missing 35% of failures that occur between scheduled intervals. Predictive maintenance uses continuous sensor data and machine learning models to detect degradation patterns and forecast failure 14–21 days in advance. Maintenance is performed exactly when needed based on actual asset condition, not a calendar. The difference is data-driven timing versus schedule-driven guessing.
How many sensors do I need per asset?
The minimum viable sensor configuration for rotating equipment is one tri-axial accelerometer on the bearing housing plus one temperature probe. For motor winding monitoring, add current transformers on each phase. Most predictive maintenance programs start with 10–20 assets at 2–3 sensors each, then expand based on ROI per asset class. Over-instrumenting in the pilot phase is a common mistake — more data does not mean better predictions if the data quality is poor. Start minimal, validate the model, and expand.
How accurate are predictive maintenance AI models?
Production-deployed models on properly instrumented assets achieve 85–95% prediction accuracy within 3–6 months of operation. Accuracy improves over time as the model accumulates more failure-event data and learns asset-specific degradation signatures. Early predictions may produce false positives — the model flags anomalies that turn out to be operational changes rather than impending failures. This is normal and decreases as the model matures. The key metric is not just accuracy but lead time: a model that is 85% accurate with a 14-day prediction window is more valuable than a model that is 95% accurate but only predicts 48 hours in advance.
Can predictive maintenance work with existing equipment?
Yes. Predictive maintenance does not require new machinery. Wireless sensors attach externally to existing bearing housings, motor frames, and pipe surfaces without modifying the equipment or interrupting production. The edge appliance connects to existing PLCs and SCADA systems via OPC-UA and MQTT, and work order integration uses your existing CMMS APIs. The entire deployment runs parallel to existing operations with zero production downtime. Most factories can instrument their first 10 assets in a single shift without affecting production schedules.