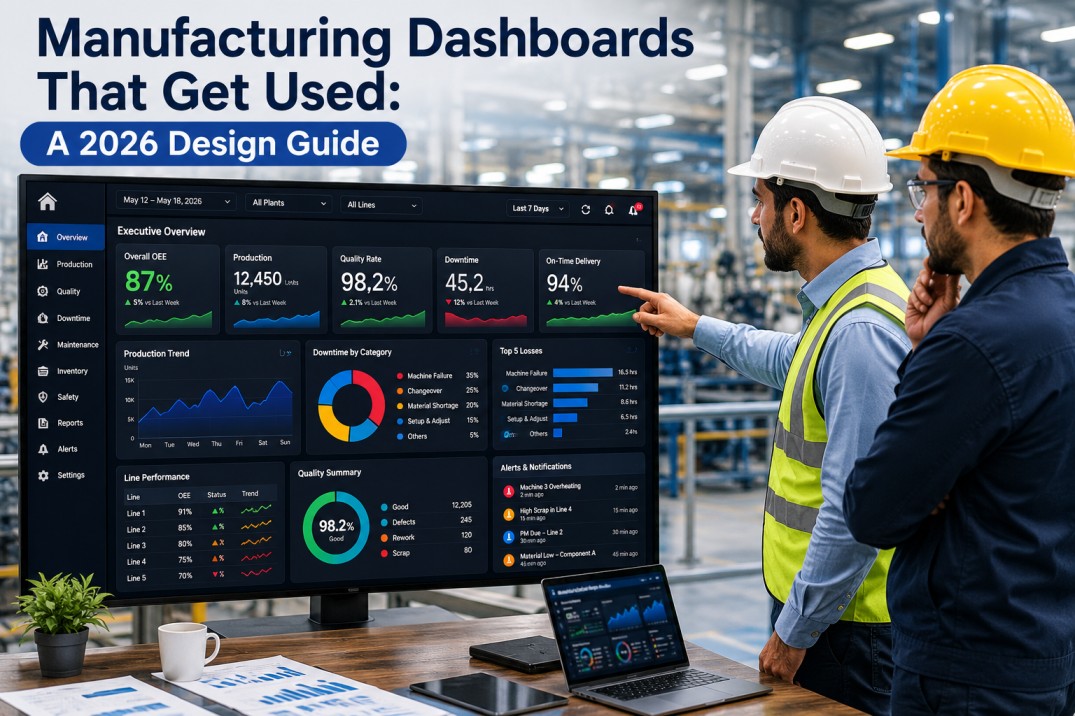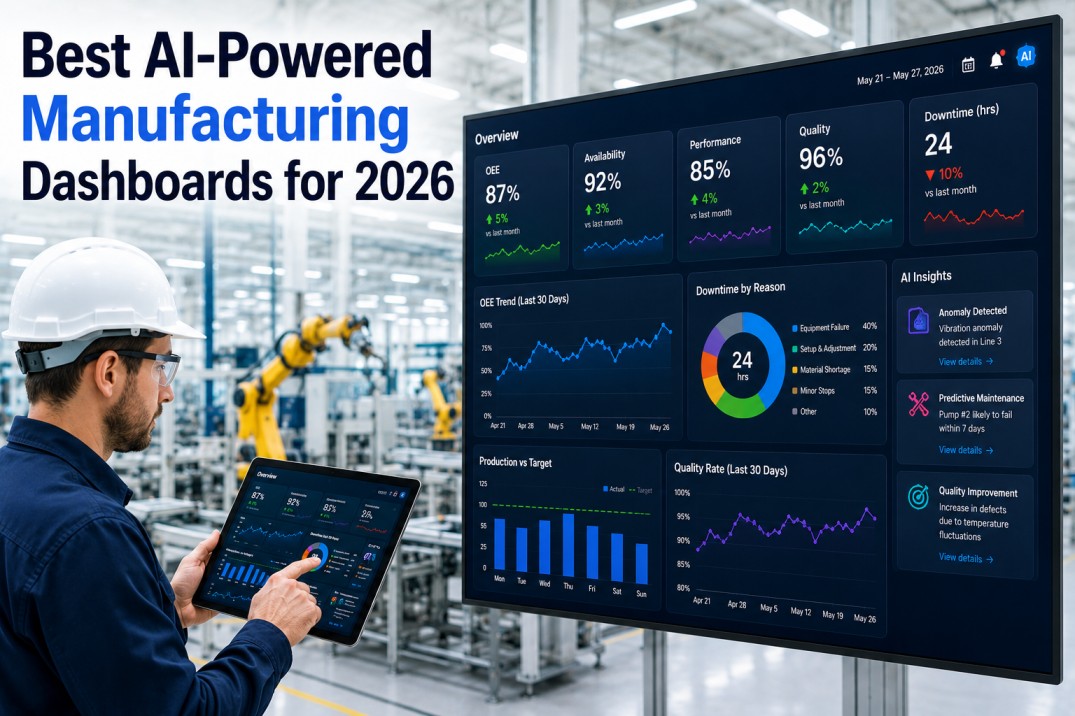
AI-powered manufacturing dashboards in 2026 are a new category of decision-support tool — they combine natural-language querying, real-time anomaly detection, and root-cause analysis in a single interface. Unlike traditional BI dashboards that display static reports, AI dashboards let operators and engineers ask questions in plain English, surface anomalies before they cause downtime, and trace production losses to their root cause in seconds. This guide reviews the capabilities that separate AI dashboards from conventional tools, compares the leading platform approaches across the decision cycle, and provides a framework for selecting the right solution for your plant.
Ask Questions. Get Answers. No Dashboard Training Required.
iFactory AI dashboards connect directly to your factory floor and let your team ask production questions in natural language — surfacing insights that traditional BI dashboards cannot.
What Makes a Dashboard AI-Powered
Three capabilities separate AI-powered manufacturing dashboards from traditional BI: natural-language interaction, automated anomaly detection, and diagnostic reasoning. Each one compresses the time between a production event and an informed decision.
Natural-Language Q&A
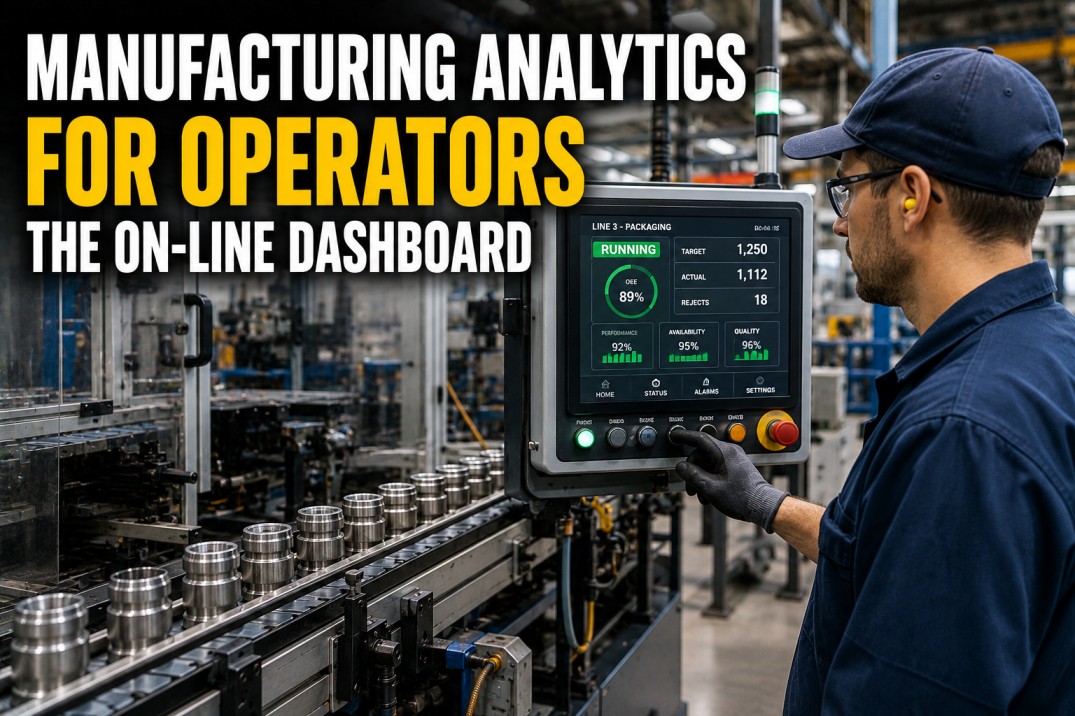
Operators and engineers ask questions in plain English — "What was OEE on line 3 last shift?" — and the dashboard returns an answer with a supporting visualisation. No query language, no dashboard navigation, no BI team required. The best platforms understand manufacturing terminology out of the box.
Real-Time Anomaly Detection
ML models monitor every data stream and flag deviations from normal operating patterns. Unlike static threshold alerts, AI anomaly detection accounts for product changeovers, ambient conditions, and machine wear — detecting subtle drifts long before they become quality issues or downtime events.
Root-Cause Analysis
When a metric drops, the dashboard automatically traces through correlated data streams — temperature, speed, material batch, shift, operator — to identify the originating cause. What used to take a process engineer an entire shift is resolved in seconds.
AI Dashboard vs. Traditional BI: Head to Head
The most useful way to evaluate AI dashboards is to compare them against traditional BI tools across the five stages of the manufacturing decision cycle.
| Decision Stage | Traditional BI Dashboard | AI-Powered Dashboard |
|---|---|---|
| Data Access | Requires data warehouse or manual extracts; batch updates | Direct PLC/sensor ingestion via OPC UA, Modbus, MQTT; sub-second latency |
| Question Asking | Predefined reports and drill paths; BI team required for new queries | Natural-language input; any user asks any question; instant chart generation |
| Anomaly Detection | Static threshold alerts; high false-positive rate | ML models learn normal ranges; context-aware alerts; prioritised by impact |
| Root-Cause Analysis | Manual investigation across separate tools; hours to days | Automated correlation across data streams; seconds to minutes |
| Action Taking | Report findings via email or meeting; delayed response | In-dashboard alerts with recommended actions; write-back to control systems |
Natural-Language Querying in Practice
Natural-language querying is the most visible difference between AI and traditional dashboards. The table below shows real queries an operator might ask and how the AI dashboard processes them.
Statistical vs. ML-Based Anomaly Detection
The quality of anomaly detection determines whether operators trust the dashboard or ignore its alerts. Here is how different approaches compare.
ROI Impact of AI Dashboards
Manufacturers deploying AI-powered dashboards report measurable improvements across decision speed, downtime reduction, and operational efficiency. These figures are based on published case studies and industry benchmarks from 2025-2026.
Get a Personalised Walkthrough of AI-Powered Dashboards for Your Plant
See how iFactory connects to your equipment, processes production data through AI models, and surfaces actionable insights in real time. We will build a demo using your actual machine data.
Platform Comparison at a Glance
Not all AI dashboard platforms are built the same. The table below compares the leading approaches across the criteria that matter for manufacturing.
| Platform | Deployment | NLQ Quality | Anomaly Detection | Industrial Protocols | Edge Capable |
|---|---|---|---|---|---|
| iFactory | Edge + Cloud | Manufacturing-optimised NLQ | ML models — 91% accuracy | OPC UA, Modbus, MQTT, Profinet | Yes — full offline resilience |
| Ignition by Inductive | On-prem / Cloud | Limited / add-on | Threshold + basic stats | OPC UA, Modbus, MQTT | Partial |
| Seeq | Cloud | Good for time-series | Advanced analytics | Via connectors | No |
| TrendMiner | Cloud | Search-based | Pattern recognition | Via connectors | No |
| Microsoft Power BI | Cloud | Copilot (generic) | Threshold only | Requires gateway | No |
Data Pipeline Architecture Compared
AI-powered dashboards depend on a data pipeline that moves production data from the factory floor through processing stages to the user interface. The architecture determines latency, resilience, and total cost.
How to Evaluate AI Dashboard Vendors
Selecting the right AI dashboard platform requires going beyond feature checklists. Use these five criteria to differentiate between genuinely AI-powered platforms and traditional BI tools with AI marketing.
NLQ Accuracy in Manufacturing Context
Anomaly Detection Model Quality
Industrial Protocol Support
Deployment Flexibility
Vendor Manufacturing Expertise
Frequently Asked Questions
How is an AI dashboard different from a standard manufacturing BI dashboard?
Do AI dashboards require cloud connectivity to work?
What data sources do I need to have in place?
How long does it take to deploy an AI dashboard?
Can AI dashboards replace my operators and engineers?
Ready to See What AI-Powered Dashboards Can Do for Your Operation?
Book a 30-minute discovery call with our manufacturing analytics team. We will review your current data infrastructure, identify quick-win opportunities, and show you a live demo of iFactory connected to production equipment.