Manufacturing plants generate terabytes of data every week from sensors, PLCs, SCADA systems, MES platforms, and ERP databases — yet 73% of that data goes completely unused. The problem isn't collection, it's intelligence. Traditional BI dashboards display numbers without explaining causation. They tell you OEE dropped to 62% yesterday, but not why — and certainly not what to do about it. AI manufacturing analytics changes the equation entirely. It tells you OEE dropped because Filling Line 3 had 14 micro-stops averaging 47 seconds each, caused by a degrading photo-eye sensor on the reject station, and predicts the sensor will fail completely within 9 days. The global manufacturing analytics market reached $12.1 billion in 2025 and is projected to hit $62 billion by 2035, growing at 17.8% CAGR. AI in manufacturing alone is expanding from $34.2 billion in 2025 to $155 billion by 2030 at 35.3% CAGR. Manufacturers who turn data into intelligence gain the edge. Those who don't, fall behind. iFactory delivers the complete AI analytics stack — real-time OEE dashboards, automated downtime root-cause analysis, predictive quality forecasting, energy optimization, and executive AI briefings — all in a single platform designed for the plant floor.
Why Manufacturing Analytics Fails Without AI
Most manufacturing plants have dashboards. The problem is that dashboards without AI are rear-view mirrors — they show you what already happened, not what's about to happen or what caused it. The $1.3 trillion in annual global manufacturing productivity losses hides in the gap between data display and data intelligence.
Traditional BI Dashboard
iFactory AI Analytics
Ready to move from dashboards that describe to analytics that predict? Schedule a live analytics demo with our team.
Real-Time OEE Dashboard: Availability, Performance & Quality
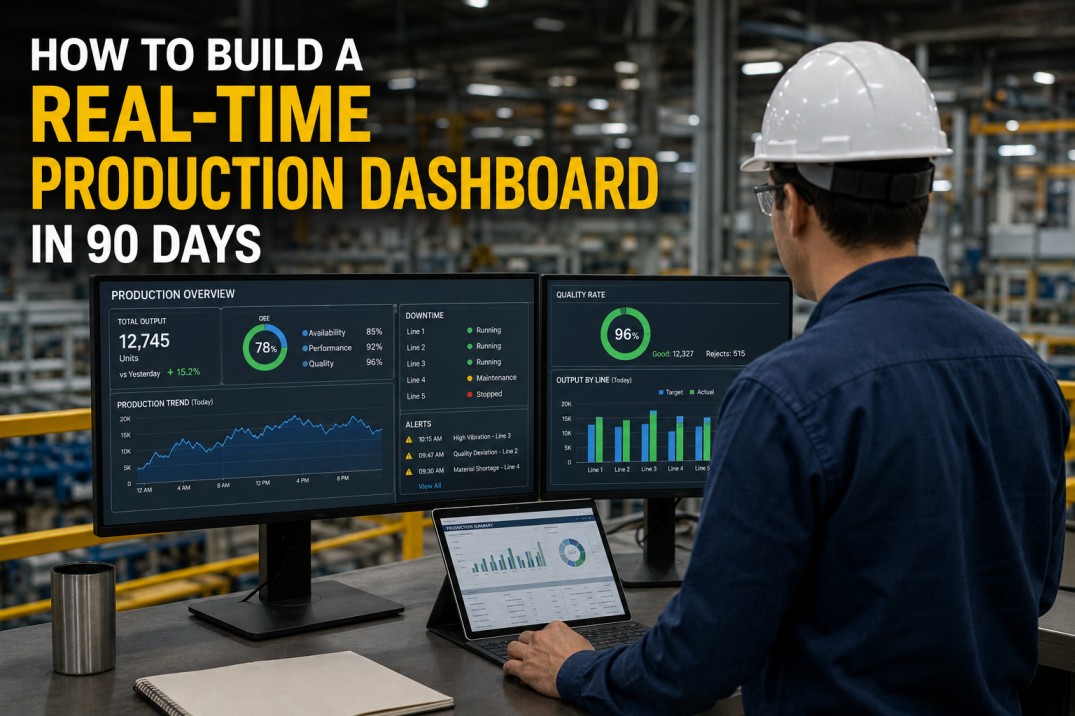
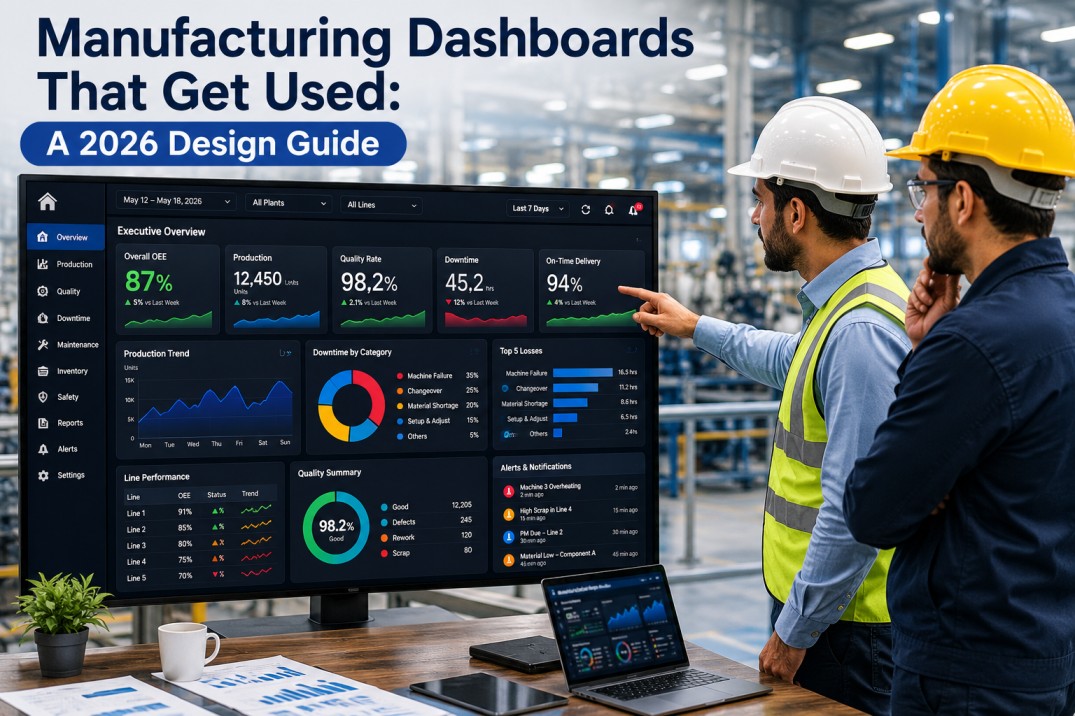
Overall Equipment Effectiveness is the gold standard KPI in manufacturing — but most plants calculate it weekly from spreadsheets, long after the losses have occurred. iFactory calculates OEE in real time, decomposing it into the Six Big Losses, and attributing each loss to specific equipment, shifts, products, and operators. World-class OEE is 85%+. The typical manufacturing plant sits at 60-65%. The gap is where AI delivers its biggest returns.
Six Big Losses — AI Auto-Attribution
Equipment Breakdowns
Unplanned stops from equipment failures — AI predicts time-to-failure and auto-generates preventive work orders
Setup & Adjustment
Changeover time between products — AI benchmarks each changeover against best-achieved times and identifies delay causes
Idling & Minor Stops
Micro-stops under 5 minutes that operators often don't log — AI detects them automatically from cycle time anomalies
Reduced Speed
Lines running below ideal cycle time — AI identifies whether speed loss is equipment-driven, material-driven, or operator-driven
Process Defects
Scrap and rework from production — AI correlates defect types with process parameter drift to prevent recurrence
Reduced Yield
Startup losses and product that doesn't meet spec during ramp-up — AI optimizes startup parameters to minimize initial waste
Downtime Root-Cause Analysis: Symptoms to Sources
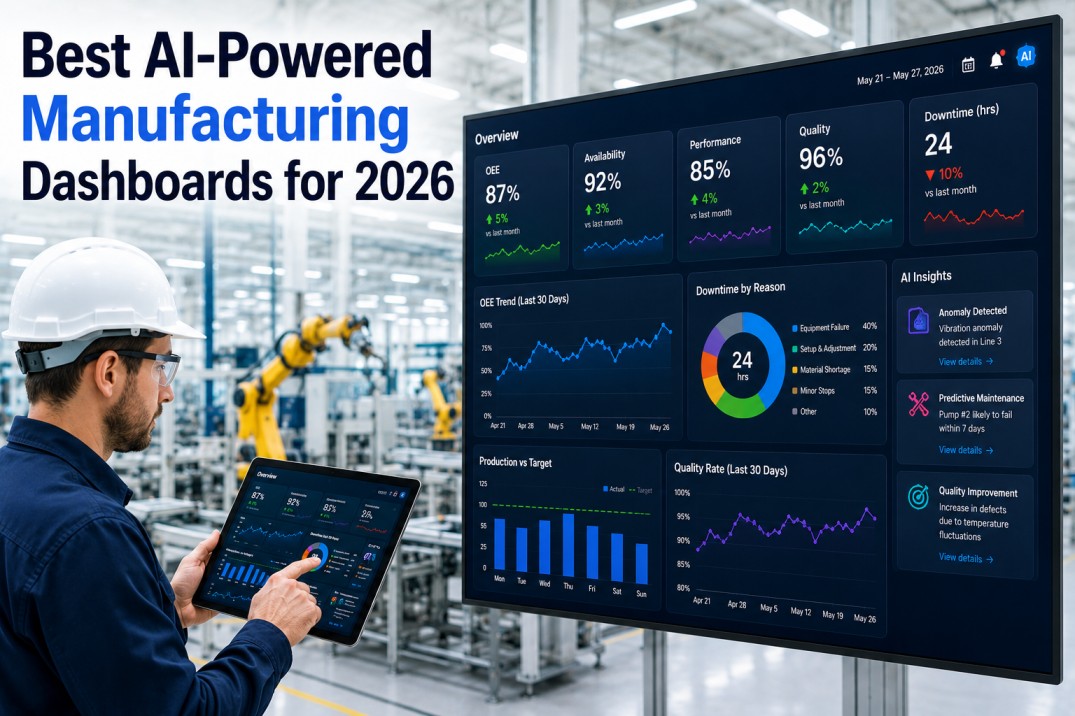
Every manufacturing plant tracks downtime hours. Very few understand why downtime happens at the root-cause level. iFactory's AI performs automated Pareto analysis across every downtime event, decomposing generic reason codes into specific, actionable causes — and quantifying the cost impact of each.
iFactory's AI doesn't just categorize downtime — it decomposes it. A single "conveyor jam" code becomes three distinct root causes, each with its own cost impact, maintenance action, and priority. This transforms maintenance from calendar-based PM schedules to condition-based, AI-optimized interventions that fix the right problems first.
Predictive Quality Analytics
Traditional quality control catches defects after they're made. Predictive quality analytics catches them before production begins — by correlating process parameters with downstream quality outcomes and alerting operators when parameter combinations historically produce out-of-spec product.
SPC Integration
Real-time Statistical Process Control charts with automatic control limit calculation, Western Electric rules, and Nelson rules. AI detects non-random patterns (trends, shifts, cycling) before they breach specification limits.
Parameter Correlation
AI correlates process variables — temperature, pressure, speed, humidity, raw material batch, operator — with quality outcomes. When the model detects parameter drift toward combinations that historically produced defects, it alerts before defective product is made.
Cpk/Ppk Real-Time
Process capability indices calculated in real time, not from quarterly lab reports. When Cpk drops below 1.33 (or your custom threshold), the system flags the process as losing capability — often 2-4 hours before the first out-of-spec unit reaches QC inspection.
Batch Genealogy
Every quality measurement linked to raw material lots, equipment used, operator on duty, and environmental conditions. Full forward and backward traceability for root-cause investigation and regulatory compliance.
Want to shift from inspection-based to prediction-based quality? Book a demo to see predictive quality analytics in action. For technical questions, visit ifactoryapp.com/support.
Energy & Sustainability Analytics: WAGES KPIs
Energy is the second-largest cost in most manufacturing plants after labor. iFactory tracks Water, Air, Gas, Electricity, and Steam (WAGES) consumption at the asset level — correlating energy usage with production output to identify waste that's invisible in aggregate utility bills.
Water
Consumption per unit produced, leak detection, cooling system efficiency
Compressed Air
Leak detection via pressure drop analysis, compressor efficiency, cost per CFM
Natural Gas
Burner efficiency, furnace/kiln optimization, BTU per unit output
Electricity
kWh per unit, motor load optimization, demand peak shaving, power factor
Steam
Trap efficiency monitoring, condensate return optimization, BTU accounting
Executive AI Briefings: Natural Language Plant Summaries
Plant managers and executives don't need more charts — they need answers. iFactory's executive AI briefing generates natural language summaries that explain plant performance the way a senior production manager would — with context, causation, and recommended actions.
Plant B OEE declined 4.2 points to 78.4% this week, driven primarily by 3 unplanned stops on Packaging Line 2 totaling 6.4 hours. Root cause: bearing degradation on the carton erector detected by vibration analysis. Maintenance work order WO-4571 auto-generated and scheduled for Saturday shutdown window. Estimated recovery to 82.6% OEE by Monday.
Quality: First-pass yield held at 96.9% across all lines. Batch 2847 on Line 4 flagged for Cpk drift on fill weight (Cpk dropped from 1.52 to 1.28 over 72 hours). Parameter adjustment recommendation pushed to Line 4 operator at 14:20 Thursday — Cpk recovered to 1.47 by end of shift.
Energy: Compressed air consumption spiked 18% Tuesday-Wednesday. AI isolated the cause to a failed trap on Steam Header 3 and a 2.1 CFM leak on Packaging Line 1 manifold. Combined weekly cost impact: $3,200. Maintenance tickets auto-created.
Frequently Asked Questions
Turn Manufacturing Data into Manufacturing Intelligence
iFactory delivers real-time OEE, AI-powered root-cause analysis, predictive quality, energy optimization, and executive briefings — in a single platform that connects to your existing equipment from day one.