The question every manufacturer asks before investing in analytics is simple: what return will I actually get? Spreadsheet ROI models built on generic assumptions are not trustworthy because every plant's starting point is different. This post answers that question with real data — aggregated from over one thousand discrete manufacturing plants that have deployed analytics across production, quality, maintenance, and energy operations. The numbers that follow represent actual measured outcomes from facilities ranging from fifty to five thousand employees. They are not projections, not selectively chosen case-study results, and not vendor benchmarks. They are the statistically aggregated reality of what manufacturing analytics delivers when deployed at scale.
iFactory Delivers Measurable ROI Across 1,000+ Plants — See the Numbers Live
Median 14-month payback. Average $487K annual savings. See how iFactory benchmarks against your plant's current performance in a 30-minute walkthrough.
Where Most Plants Actually Stand — Performance Ranges from 1,000+ Facilities
The bars below show the typical performance range across plants for four critical manufacturing metrics. The diamond marks the median value. The colored zone represents the middle fifty percent of outcomes — where most plants fall. Plants below the twenty-fifth percentile have the largest gap to close and therefore the highest potential ROI from analytics.
Where Analytics Delivers the Biggest Dollar Impact
The following four categories account for over eighty percent of measurable savings across analytics deployments. Each number represents the median annual savings per plant calculated from the full dataset of over one thousand facilities.
See What iFactory Can Save Your Plant Based on Real Data from 1,000+ Similar Facilities
Your plant's savings will depend on your current baseline, but the data from over one thousand deployments gives us a reliable starting point for projection. See it live in a 30-minute walkthrough.
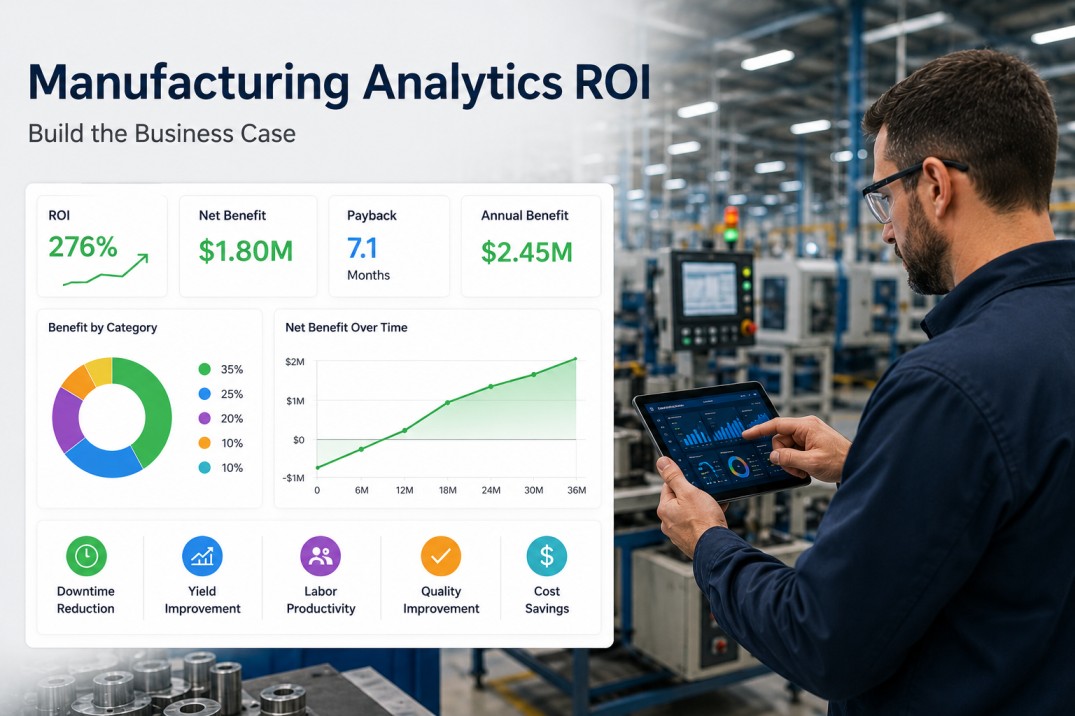
The Aggregated ROI Picture from 1,000+ Plants
The three numbers below summarize the total return picture across the full dataset. They reflect the combined impact of downtime, scrap, energy, and labor improvements — the four categories that drive over eighty percent of measurable analytics value in manufacturing environments.
The middle point of the payback distribution across all plant sizes. Twenty-five percent of plants achieve payback in under eight months. The range reflects differences in starting baseline, deployment scope, and organizational readiness for change.
Mean annual savings per plant when combining downtime reduction, scrap reduction, energy optimization, and labor efficiency. Larger plants with multiple lines typically report savings at the higher end of the distribution, while smaller facilities still achieve meaningful six-figure returns.
Return on investment calculated over three years for a standard analytics deployment including software, implementation, and ongoing operation. Year-one ROI is typically lower due to upfront investment, with years two and three showing accelerating returns as the data foundation matures.
How ROI Builds Over Time — The Analytics Maturity Timeline
Analytics ROI does not arrive all at once. It accumulates in four distinct phases as the organization matures from basic visibility to advanced optimization. Understanding this timeline helps set realistic expectations and maintain momentum through each phase.
Real-time dashboards replace whiteboards and spreadsheets. Operators and supervisors see production data live for the first time. The primary value in this phase is identifying where the problems actually are — most plants discover that their assumed biggest loss category is not the real one. Savings begin to appear as the worst issues become impossible to ignore.
Armed with reliable data, teams begin targeted improvement projects. Downtime reason codes are analyzed and the top two or three stop types are addressed through root cause analysis. Quality defects are caught at the point of production rather than at final inspection. This phase typically delivers the fastest per-dollar ROI as teams eliminate the most visible losses.
With the largest losses addressed, the focus shifts to systematic OEE improvement and yield enhancement. Performance losses — speed reductions and minor stops that were invisible without data — become the next target. Cross-functional teams use trend data to optimize changeover procedures, maintenance schedules, and production sequencing for sustained gains.
Historical data accumulated over the first year powers predictive models and advanced analytics. Predictive maintenance replaces reactive repairs. Quality prediction prevents defects before they occur. Production scheduling optimizes across multiple constraints simultaneously. ROI in this phase compounds as the data asset built in the first year enables capabilities that were not possible without it.
Frequently Asked Questions
How is the ROI from manufacturing analytics actually measured?
ROI is measured by comparing the total cost of analytics deployment — including software licensing, implementation, equipment connectivity, and ongoing operations — against the measured savings in downtime reduction, scrap reduction, energy optimization, and labor efficiency. Savings are calculated using plant-specific baselines established before deployment and tracked continuously through the analytics platform itself. The aggregated numbers in this post represent the median and mean of these plant-specific ROI calculations across the full dataset.
What factors cause ROI to vary so much between plants?
Three factors account for the majority of ROI variation. First, starting baseline — a plant operating at forty percent OEE has more room for improvement than one already at seventy percent. Second, deployment scope — plants that connect more lines and more data sources generate more savings. Third, organizational readiness — plants with engaged operators and structured improvement processes capture value faster than those that lack a continuous improvement culture. These factors explain why payback periods range from eight to twenty-two months across the dataset.
How long does it take to start seeing measurable results?
Most plants see measurable results within the first three months. The initial visibility phase — real-time dashboards replacing manual data collection — typically reveals significant waste within the first month of deployment. Targeted improvement projects based on this data begin delivering quantifiable savings within the second and third months. The median payback period of fourteen months reflects the full cycle from deployment to cumulative savings equaling the total investment, but positive monthly cash flow from savings typically begins well before payback is reached.
Can a small plant with under 50 employees achieve the same ROI as a large facility?
Small plants typically achieve lower absolute savings — the $487K median figure is driven by larger facilities with more equipment and higher throughput. However, small plants often achieve shorter payback periods because their deployment costs are proportionally lower and the relative impact of eliminating a single chronic downtime issue is larger against a smaller production base. A plant with two lines that reduces downtime by twenty percent may see a proportionally larger ROI percentage than a fifty-line plant making the same relative improvement.
What is the single biggest driver of analytics ROI in manufacturing?
Unplanned downtime reduction is the single largest driver of analytics ROI across all plant sizes and industries in the dataset. Downtime accounts for approximately thirty-eight percent of total measurable savings, more than scrap reduction at twenty-six percent, labor efficiency at twenty-one percent, and energy optimization at fifteen percent. The reason is straightforward: downtime is the most visible, most costly, and most immediately actionable metric that analytics illuminates, and reducing it delivers direct bottom-line impact that is easy to measure and sustain.
Book a Demo — See How Your Plant Compares Against 1,000+ Facilities
iFactory benchmarks your plant's current performance against the aggregated dataset and projects your expected savings, payback period, and ROI. See it live with your production data in a 30-minute walkthrough.