Every manufacturing analytics investment faces the same question in the approval meeting: where is the payback? The plant manager knows downtime is expensive. The operations director knows scrap rates erode margin. But converting operational pain into a financial business case with defensible numbers, a clear payback timeline, and a return that survives CFO scrutiny is where most analytics initiatives stall.
iFactory Ships With Built-In ROI Tracking — See the Payback in Your Plant
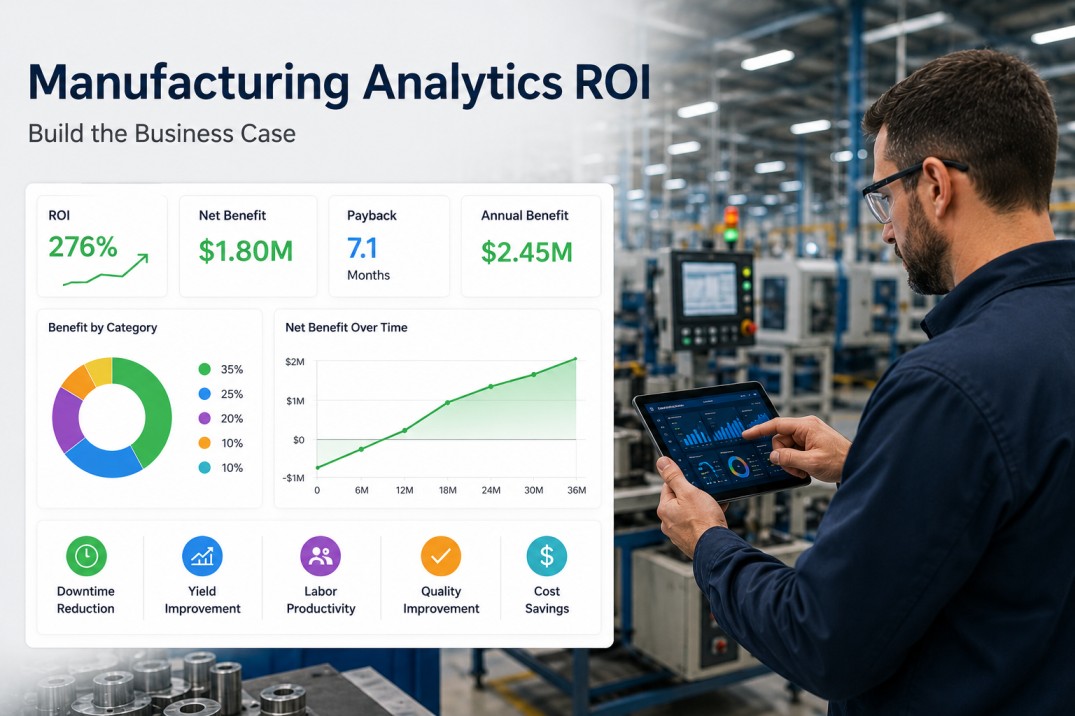
Real-time OEE, downtime tracking, and quality analytics with measurable ROI. Book a 30-minute walkthrough with your production data.
Three Cost Categories That Analytics Directly Reduces
Building a credible business case starts with quantifying the baseline. Every manufacturing analytics investment generates returns across three measurable cost categories. The organizations that achieve the fastest payback identify their baseline in each category before deployment begins.
Unplanned Downtime
Unplanned downtime costs discrete manufacturers an average of $260,000 per hour. Across the industry, total annual losses exceed $50 billion. Predictive analytics reduces unplanned downtime by 30 to 50 percent by detecting anomalies weeks before failure occurs.
Maintenance Spend
Organizations shifting from preventive to predictive maintenance reduce total maintenance costs by 18 to 25 percent. The savings come from eliminating unnecessary preventive replacements and avoiding emergency repairs that cost four to five times more than planned interventions.
Scrap and Rework
AI-driven quality analytics reduces scrap rates by 30 to 40 percent by detecting process drift before defect generation occurs. Real-time correlation between machine vibration data and product quality enables intervention during production rather than after inspection.
Analytics ROI: Measured Impact Across Key Metrics
| Metric | Before Analytics | After Analytics | Improvement |
|---|---|---|---|
| Unplanned downtime | 12-18% of production time | 6-9% of production time | 30-50% reduction |
| Maintenance cost per asset | Benchmark | 18-25% below benchmark | $40K-$80K annual savings per line |
| Scrap rate | 3-7% of total output | 1.8-4.9% of total output | 30-40% reduction |
| OEE score | 55-65% typical baseline | 65-78% after deployment | 8-11 point increase |
| Mean time to repair | 4-8 hours | 1.5-3 hours | 50-60% improvement |
| Micro-stop frequency | 15-25 per shift | 8-15 per shift | 35-45% reduction |
Phased ROI: What to Expect and When
Manufacturing analytics ROI follows a predictable pattern across three phases. Understanding the timeline prevents the common mistake of expecting full payback before the data infrastructure matures.
Months 1-3: Visibility
Real-time dashboards and downtime tracking deployed. Typical OEE improvement of 3 to 5 points from visibility alone. Quick wins from identifying top downtime causes. Implementation cost recouped within first 90 days for targeted line deployments.
Months 4-9: Optimization
Predictive models trained on plant data begin identifying failure patterns before breakdowns occur. Maintenance cost reduction of 10 to 15 percent materializes. Scrap rates decline as quality correlations are established. Cumulative savings reach 40 to 60 percent of total investment.
Months 10-18: Scale
Full predictive maintenance and quality analytics operational across all lines. Maintenance costs stabilize 18 to 25 percent below baseline. OEE improvement reaches 8 to 11 points. Total payback achieved. Organizations at this stage report 3:1 to 5:1 cumulative ROI.
iFactory's Analytics Platform — Built for Measurable ROI From Day One
Real-time OEE, downtime analytics, and quality tracking with deployment support. See a personalized ROI projection for your plant in a 30-minute demo.
Building the Business Case: A Three-Step Framework
A credible business case follows a consistent structure regardless of plant size or industry. Use this framework to present defensible numbers to your approval team.
Establish the Baseline
Document current OEE, downtime percentage, scrap rate, maintenance cost per unit, and MTTR across your target lines. Use 90 days of production data as the minimum sample. The baseline determines every subsequent ROI calculation and prevents post-deployment attribution disputes.
Model Conservative Savings
Apply conservative improvement assumptions: 15 percent downtime reduction for the first six months, 10 percent maintenance cost reduction, and 15 percent scrap reduction. These figures are below industry averages and create room for upside variance that strengthens the final business case presentation.
Calculate Payback and ROI
Total investment includes software licensing, sensor deployment where needed, integration labor, and team training. Divide total investment by monthly savings to determine payback period in months. Project 36-month cumulative ROI using scaled savings as predictive models mature beyond the initial 12-month window.
Frequently Asked Questions
What is the typical payback period for manufacturing analytics?
The median payback period for manufacturing analytics is 12 to 18 months, with 27 percent of organizations achieving full payback within 12 months according to IoT Analytics research. Plants starting with targeted deployments on high-criticality assets often see payback within 6 to 9 months, while enterprise-wide rollouts across lower-criticality equipment may take 18 to 24 months.
What is the most important metric to track for ROI measurement?
OEE improvement is the single most tracked metric for manufacturing analytics ROI because it captures availability, performance, and quality in one number. An 8 to 11 point OEE increase directly correlates with 15 to 25 percent throughput improvement. Track OEE alongside maintenance cost per unit and scrap rate for a complete ROI picture.
How long before predictive analytics models produce accurate predictions?
Predictive maintenance models typically require 6 to 12 months of operational data to achieve reliable accuracy. During the training period, rule-based alerts and real-time dashboards deliver immediate value through visibility improvements. Organizations that begin ROI measurement from month one see 3 to 5 point OEE gains from visibility alone while models mature.
Should we start with a pilot or deploy plant-wide?
Start with a pilot on one to three high-criticality lines. Pilots reduce initial investment, minimize operational disruption, and produce measurable ROI data that strengthens the case for plant-wide deployment. Successful pilots on critical assets typically show payback within 6 to 9 months and provide the documented results needed for enterprise-scale approval.
What percentage of organizations successfully achieve analytics ROI?
According to IoT Analytics research, 95 percent of organizations that implement predictive maintenance and manufacturing analytics report positive ROI. The key differentiator between organizations that achieve ROI and those that do not is baseline measurement. Organizations that document pre-implementation KPIs achieve faster payback because they can isolate the technology's impact from other operational variables.
Book a Demo — See Your Plant's Analytics ROI in 30 Minutes
Walk through a live iFactory deployment with your equipment types, shift structure, and production targets. No commitment, no sales pitch. See the numbers before you decide.