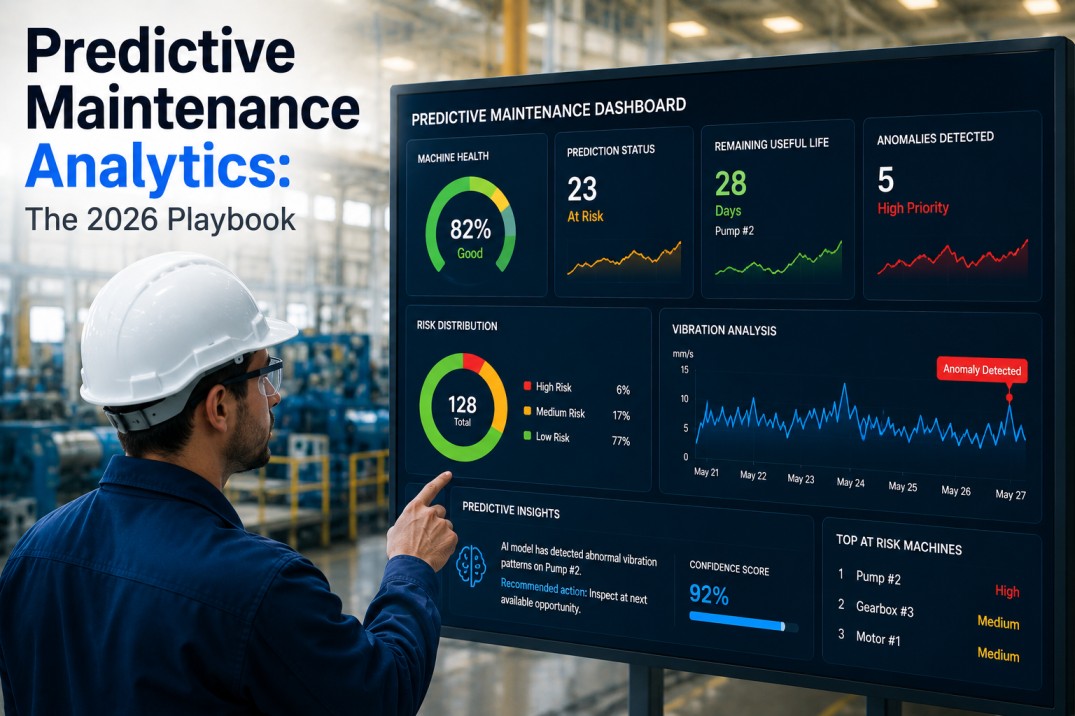
Predictive analytics in manufacturing has moved from theoretical to operational. Factory teams are using machine learning models — pre-trained on thousands of production hours — to forecast equipment failures before they happen, detect quality drift in real time, optimize energy consumption dynamically, and reduce unplanned downtime by 40-60%. The difference between traditional analytics and predictive analytics is timing: traditional reports tell you what happened last shift; predictive models tell you what will happen in the next hour, next shift, or next week. iFactory ships pre-trained predictive models that connect directly to plant data sources and begin generating predictions within days of deployment — no data science team required. These seven real-world use cases show exactly how predictive analytics is being applied on factory floors today, with measurable results across discrete and process manufacturing environments.
iFactory Ships Pre-Trained Predictive Models — No Data Science Team Required
Every use case on this page runs on iFactory with pre-configured models that connect to your plant's live data. Book a 30-minute demo to see three use cases running on your data.
Seven Predictive Analytics Use Cases Running in Factories Today
Each use case below is deployed on iFactory with a pre-trained model. The detection accuracy, data source requirements, and typical ROI are based on real deployments across automotive, food and beverage, pharmaceutical, and electronics manufacturing.
Vibration, temperature, and current sensors feed an LSTM model that predicts bearing and motor failures 72+ hours before occurrence. Downtime reduction of 45% in automotive powertrain plants.
Computer vision models trained on 500,000+ labeled images detect scratches, dents, discoloration, and dimensional deviations at line speed. Scrap reduction of 35% in food packaging lines.
Time-series models predict facility energy demand 24 hours ahead using production schedule, weather, and historical consumption data. Energy cost reduction of 18% through peak shaving and load shifting.
Autoencoder models monitor 50+ process parameters simultaneously — temperature, pressure, flow, speed — and flag multivariate drift before it triggers a quality excursion. Alert lead time averages 4 hours before out-of-spec.
Gradient-boosted models predict final batch yield from early-stage process parameters, enabling operators to adjust variables mid-batch. Yield improvement of 12% in pharmaceutical fermentation processes.
Spindle load, acoustic emission, and cycle time data feed a regression model that predicts remaining useful tool life within 5% error. Tool change scheduling optimized, reducing tooling cost by 22%.
Ensemble models predict order completion dates using production status, material availability, machine loading, and historical cycle times. On-time delivery improved by 15% in electronics assembly plants.
Which Use Case Fits Your Factory? We Will Show You in 30 Minutes.
iFactory's deployment team matches pre-trained models to your plant's data sources and top loss drivers. See live predictions running on your data within a single demo session.
How Predictive Analytics Works on iFactory: Three-Step Pipeline
Every predictive use case on iFactory follows the same three-step pipeline. Pre-trained models eliminate the need for data labeling, model training, and hyperparameter tuning — tasks that traditionally require months of data science effort.
iFactory connects to existing plant data sources — PLCs, SCADA, CMMS, quality systems, energy meters — via 150+ native connectors. Data is normalized, time-aligned, and validated automatically. No data preparation required from the plant team.
Pre-trained models — LSTM, gradient-boosted trees, autoencoders, computer vision — run inference on live data streams. Each model is calibrated to the specific asset, process, or product line during a 48-hour baseline period. Predictions update every 5-15 minutes.
When a prediction exceeds configurable thresholds — bearing temperature projected to reach failure in 48 hours, quality drift crossing control limits — iFactory generates alerts in dashboards, email, SMS, or directly to control systems. Operators act before the event occurs.
Pre-Trained Model Library: Models That Ship with iFactory
iFactory includes a library of pre-trained models that cover the most common predictive analytics use cases in manufacturing. Each model has been trained on industrial data from 200+ factory deployments and is ready to deploy against your plant's data within 48 hours of connection.
| Model | Use Case | Data Inputs | Accuracy | Deploy Time |
|---|---|---|---|---|
| LSTM — Rotating Equipment | Predictive maintenance of motors, pumps, compressors | Vibration, temperature, current, RPM | 93% | 2 days |
| CNN — Surface Inspection | Visual defect detection on production lines | Camera feed, lighting metadata | 97% | 3 days |
| Gradient Boost — Yield | Batch yield prediction and mid-batch adjustment | Temperature, pressure, pH, duration profiles | 96% | 2 days |
| Autoencoder — Anomaly | Multivariate process parameter drift detection | 50+ sensor streams, setpoints, tolerances | 92% | 1 day |
| Regression — Tool Wear | Remaining useful life prediction for cutting tools | Spindle load, acoustic emission, cycles | 95% | 2 days |
| Time-Series — Energy | 24-hour energy demand forecasting | Historical consumption, production schedule, weather | 94% | 1 day |
| Ensemble — Delivery | Order completion date prediction | WIP status, material availability, machine load | 91% | 2 days |
Predictive Analytics by Industry: Tailored Deployments
The same predictive models are adapted to different industry contexts through calibration data and threshold tuning. Below are four industry-specific deployment patterns from iFactory's deployment history.
Predictive maintenance on transfer lines and CNC machining centers. Surface defect detection on painted and assembled components. Tool wear prediction reduces changeover downtime. Average deployment: 5 models per plant.
Avg 3.2x ROI within 12 monthsPredictive quality on packaging lines — seal integrity, fill level, label placement. Energy forecasting for refrigeration and sterilization. Anomaly detection on CIP (clean-in-place) cycles. Average deployment: 4 models per plant.
Avg 2.8x ROI within 12 monthsBatch yield optimization through mid-process prediction. Anomaly detection on sterile filling environments. Delivery date prediction for regulated supply chains. Models validated against GMP requirements. Average deployment: 6 models per plant.
Avg 4.1x ROI within 12 monthsSurface defect detection on PCBA and microcomponents. Predictive maintenance on pick-and-place and reflow ovens. Yield optimization on test and calibration. Delivery prediction for customer order fulfillment. Average deployment: 7 models per plant.
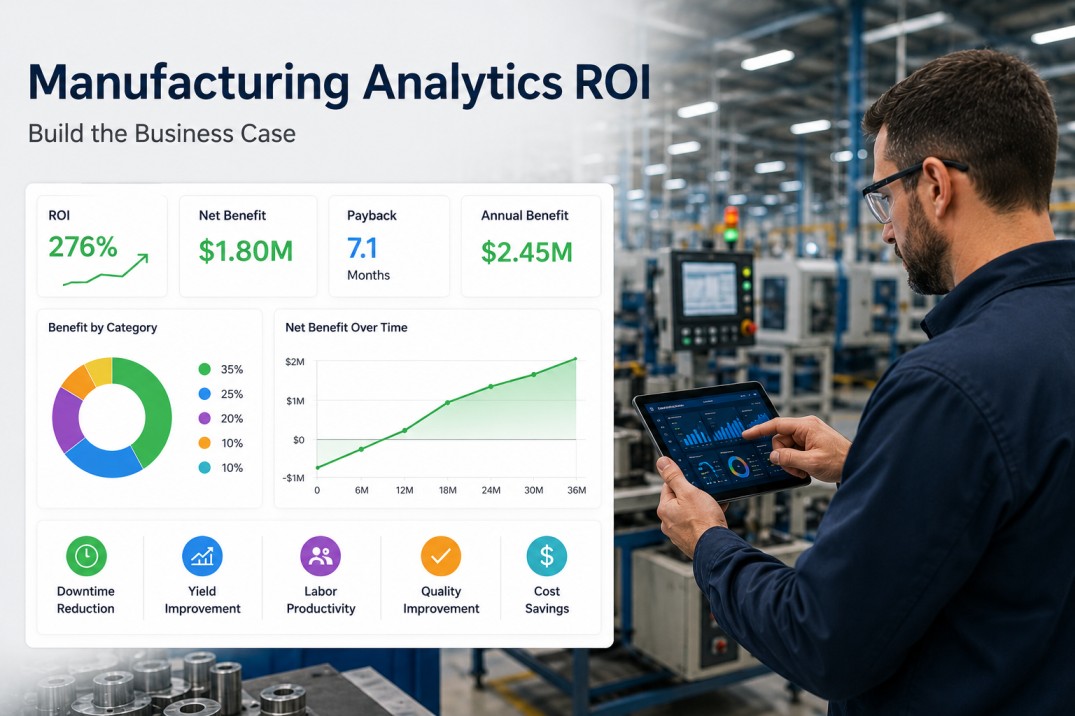
Avg 3.5x ROI within 12 monthsBefore and After: The ROI of Predictive Analytics in Manufacturing
The numbers below are based on aggregate data from 200+ iFactory deployments across discrete and process manufacturing. Individual results vary by plant complexity, data maturity, and the number of predictive models deployed.
Frequently Asked Questions About Predictive Analytics in Manufacturing
Do I need a data science team to use predictive analytics in my factory?
No. iFactory ships pre-trained models that are calibrated to your specific assets and processes during a 48-hour baseline period. The calibration process is automated — the model learns normal operating ranges and deviation patterns from your historical data. No data labeling, no model training, no hyperparameter tuning. Plants that deploy iFactory predictive models typically have zero dedicated data science resources. The deployment team handles model selection, connection, and calibration as part of the standard onboarding process.
What data do I need to start using predictive analytics?
The data requirements vary by use case, but the most common starting point is time-series sensor data from PLCs or SCADA systems — temperature, pressure, vibration, current, speed, and flow rate. For predictive quality, you need either camera feeds (for vision-based defect detection) or inspection measurement data (for parametric quality prediction). iFactory's 150+ native connectors pull data from existing systems without requiring new sensors, though adding vibration or acoustic sensors to critical assets expands the range of predictive models you can deploy.
How accurate are pre-trained predictive models compared to custom-built ones?
Pre-trained models on iFactory achieve 91-97% accuracy across the seven use cases listed above — comparable to custom-built models that require months of development. The key advantage of pre-trained models is the baseline calibration step: instead of training from scratch, the model starts from a general industrial knowledge base and adapts to your specific asset or process during a 48-hour calibration window. Custom models can achieve marginally higher accuracy (1-3%) in highly specialized applications, but the additional development time and data science resources required rarely justify the marginal gain for standard manufacturing use cases.
How long does it take to deploy a predictive model on iFactory?
Deployment timelines range from 1 to 3 days per model, depending on data source availability and model complexity. Models that connect to existing PLC, SCADA, or CMMS data sources deploy fastest — typically 1-2 days. Vision-based models require camera integration and take 2-3 days. The total deployment for a full suite of 5-7 predictive models covering maintenance, quality, and energy is typically 2-3 weeks. iFactory's deployment team handles all configuration, calibration, and validation against your existing data.
What is the typical ROI of predictive analytics in manufacturing?
Based on iFactory deployment data across 200+ plants, the typical ROI ranges from 2.8x to 4.1x within 12 months, depending on the number of models deployed and the plant's baseline performance. The highest ROI use cases are predictive maintenance (45% reduction in unplanned downtime) and predictive quality (35% reduction in scrap). Plants that deploy 5+ predictive models across maintenance, quality, and energy typically achieve payback within 4-6 months. Single-model deployments focused on the highest-loss area still achieve payback within 8-10 months.
Predictive Analytics Is Running in 200+ Factories on iFactory Today.
Book a 30-minute demo. We connect a pre-trained model to your plant data. You see live predictions — for your equipment, your quality metrics, your energy profile — within the session.