Building a real-time production dashboard in 90 days is an ambitious but achievable goal for most manufacturing plants — provided you follow a structured methodology with clear phase gates, pre-built data connectors, and a focus on user adoption from Day 1. This guide covers every step of the 90-day deployment: a project scoreboard tracking key delivery metrics, a three-phase implementation timeline covering foundation (Days 1-30), build (Days 31-60), and launch (Days 61-90), a four-layer architecture diagram from data sources through ingestion and semantic modelling to dashboard visualisation, six component build cards describing each system element with timelines, a week-by-week sprint table mapping all 12 weeks of activities, five team role cards defining who does what, and four proven impact metrics showing measurable outcomes from real-world deployments.
90-Day Rollout
iFactory Cuts Your Production Dashboard Timeline to 45 Days — Pre-Built Connectors, Models, and Templates Included
iFactory provides pre-built data connectors for 50+ manufacturing systems, a pre-configured semantic model with 40+ standard KPI formulas, and 12 pre-built dashboard templates covering OEE, Quality, Downtime, Scrap, Energy, Labour, Cost, and Executive views. Built-in RBAC, alert engine with multi-channel routing, and automatic KPI rollup across plant/line/asset hierarchy. For a typical single-plant deployment, iFactory reduces the 90-day timeline to 45-60 days by eliminating the need to build connectors, data models, and screen layouts from scratch.
Real-Time Production Dashboard: 90-Day Project Scoreboard
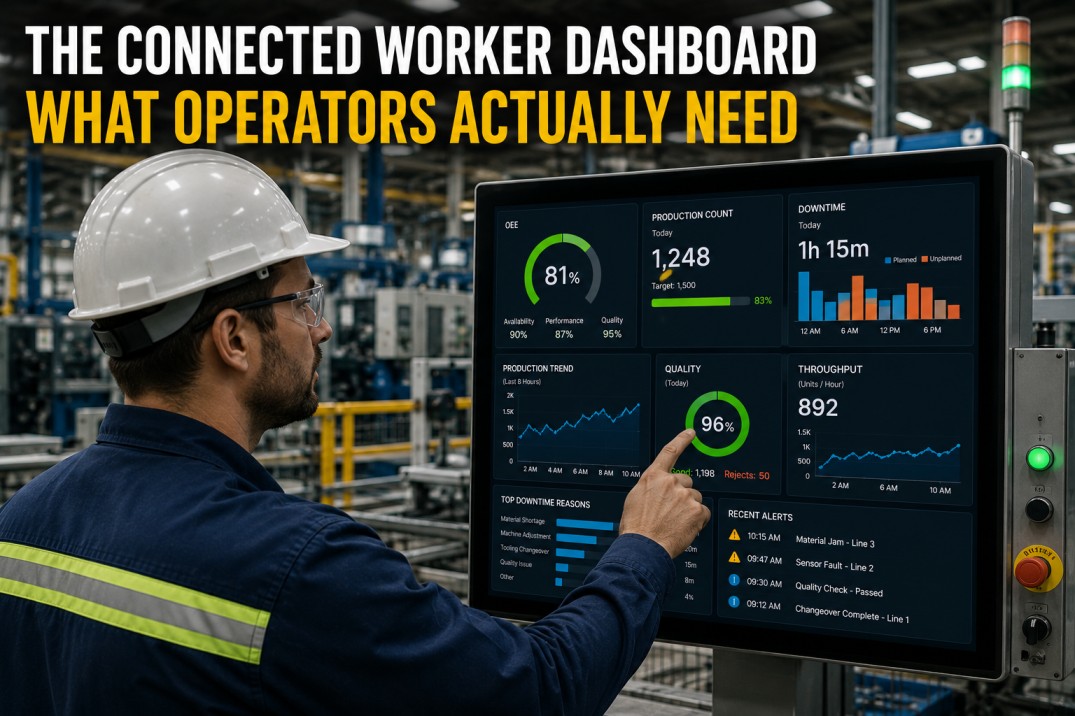
The scoreboard tracks four key delivery metrics for a 90-day production dashboard project. 90 days is the target timeline from kickoff to first user accessing dashboards — this is achievable with dedicated project resources and standard plant-floor systems. 6 data sources are integrated including MES, SCADA, ERP, CMMS, IoT gateways, and manual data entry. 8 dashboard screens are delivered covering OEE, Quality, Downtime, Scrap, Energy, Labour, Cost, and Executive summary. 50+ active users across operators, supervisors, managers, and executives consume dashboards through role-specific interfaces — HMI for operators, shift view for supervisors, weekly pack for managers, executive summary for leadership.
Three-Phase Implementation Timeline: Foundation, Build, Launch
The 90-day timeline is divided into three 30-day phases. Phase 1 (Foundation, Days 1-30) focuses on data source audit and connector deployment — this phase determines 80% of project success. Phase 2 (Build, Days 31-60) shifts to semantic model construction and dashboard development — the data team builds the bridge between raw data and business logic. Phase 3 (Launch, Days 61-90) covers UAT, user training, go-live, and post-launch optimisation — a technically perfect dashboard that nobody uses generates zero value. Each phase has clear deliverables and exit criteria. Phase gates prevent progressing to the next phase without meeting minimum quality standards.
- Audit and inventory available data sources (MES, SCADA, ERP, CMMS, spreadsheets)
- Deploy data ingestion connectors — real-time streams for PLC/SCADA, batch loaders for ERP/CMMS
- Set up the data lake or time-series database with plant/line/asset hierarchy
- Define KPI library with standard formulas, refresh cadence, and ownership
- Establish data quality rules and alert thresholds for missing or anomalous data
- Create the semantic layer — turn raw tags into business metrics (OEE, FPY, MTBF, etc.)
- Build KPI calculation engine with standard formulas and configurable target ranges
- Develop core dashboards: OEE, Quality, Downtime — the 'golden trio' for every plant
- Set up role-based access control per screen, per plant, per user role
- Configure alert rules for threshold breaches and anomaly detection
- Conduct user acceptance testing with operator, supervisor, and manager cohorts
- Deliver role-based training sessions — operators (HMI), supervisors (shift view), managers (weekly)
- Go live with pilot production line, collect 1 week of usage data, refine based on feedback
- Roll out to remaining lines and plants in 2-wave approach
- Establish ongoing support, dashboard usage monitoring, and quarterly review cycle
Four-Layer Architecture: From Plant Floor to Dashboard
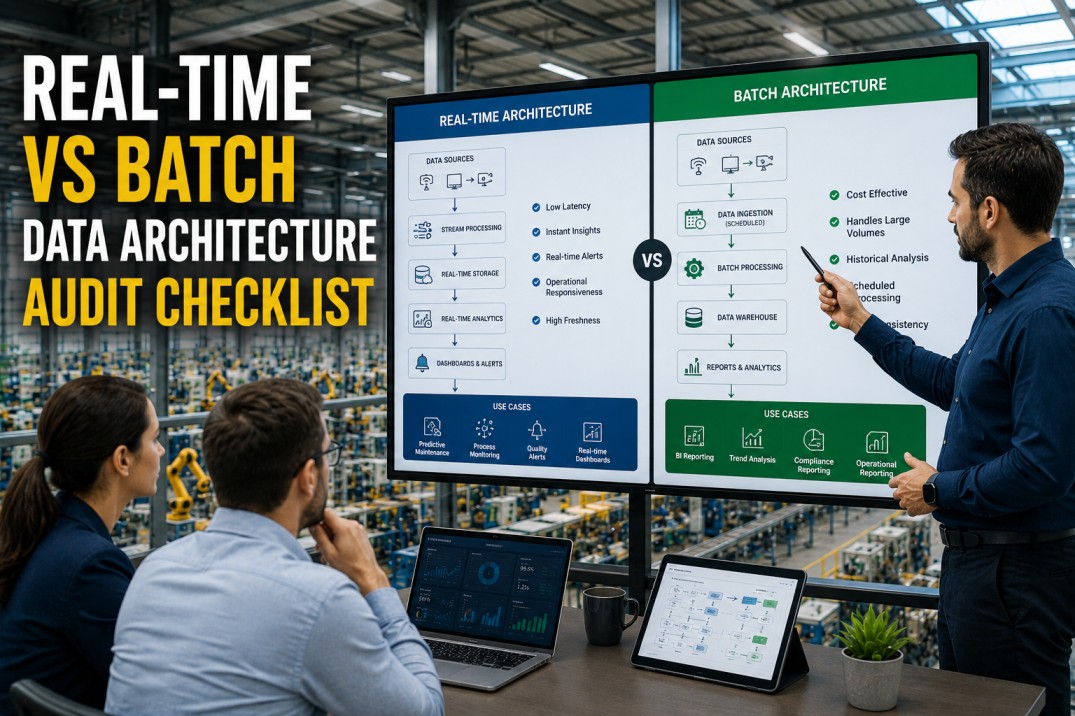
The production dashboard architecture consists of four layers. Layer 1 (Data Sources) includes plant-floor systems (MES, SCADA, PLC, IoT sensors) and enterprise systems (ERP, CMMS, energy meters) — data arrives via real-time streaming (OPC-UA/MQTT) and batch loads (API/SFTP). Layer 2 (Ingestion) uses streaming pipelines for real-time sensor data and batch ETL for transactional systems, storing time-series metrics in a purpose-built DB. Layer 3 (Semantic Model) maps raw tags to business KPIs with standard formulas, rollup hierarchy, and alert thresholds. Layer 4 (Dashboard) renders role-specific screens with real-time auto-refresh and configurable layouts.
Six Component Build Cards: What Gets Built and When
The six component build cards describe every major deliverable with its timeline. Data Connectors (Days 1-20) connect 6 source systems via OPC-UA, MQTT, REST APIs, and SFTP. Data Model & Hierarchy (Days 15-35) defines the plant/line/asset structure and KPI formulas. KPI Calculation Engine (Days 25-50) implements real-time window-based aggregation and anomaly detection. Alert Rules (Days 40-60) configure threshold-based notifications with multi-channel routing. Dashboard Screens (Days 35-70) deliver 8 role-specific views. User Access & RBAC (Days 60-80) configures SSO integration and granular permissions per screen and plant.
Week-by-Week Sprint Plan: 12 Weeks to Go-Live
The week-by-week sprint table maps every activity across the 12-week timeline. Foundation phase (Weeks 1-4): data source audit, connector deployment, time-series DB setup, KPI definition. Build phase (Weeks 5-8): semantic model, golden trio dashboards (OEE, Quality, Downtime), advanced screens, alert configuration. Launch phase (Weeks 9-12): RBAC and SSO, UAT with pilot line, full rollout with role-based training, hypercare support. Each sprint has a single primary deliverable with clear acceptance criteria. The sprint structure follows a standard agile methodology adapted for plant-floor implementation — two-week sprints with daily stand-ups and weekly stakeholder reviews.
| Week | Activity | Phase | Details |
|---|---|---|---|
| Week 1 | Data source audit & inventory | Foundation | Identify all available sources, assess data quality, document access methods |
| Week 2 | Ingestion connectors deployment | Foundation | Install OPC-UA/MQTT gateways, configure API connections, set up batch ETL |
| Week 3 | Data lake & time-series DB setup | Foundation | Provision storage, create plant/line/asset hierarchy, configure data retention |
| Week 4 | KPI definition & formula library | Foundation | Define standard KPIs, configure formulas, set target ranges and baselines |
| Week 5 | Semantic model & tag mapping | Build | Map raw tags to business metrics, build rollup logic, validate data lineage |
| Week 6 | Core dashboard build (OEE, Quality, Downtime) | Build | Build golden trio screens with real-time data, test with pilot line feed |
| Week 7 | Advanced dashboards (Scrap, Energy, Labour) | Build | Build secondary screens, configure pareto charts and trend visualisations |
| Week 8 | Alert rules & notification configuration | Build | Set severity levels, routing rules, escalation logic, test alert flow |
| Week 9 | RBAC, SSO & user provisioning | Launch | Configure role-based access, integrate Azure AD, provision initial users |
| Week 10 | UAT & pilot line go-live | Launch | Run UAT with operator/supervisor cohorts, collect feedback, fix issues |
| Week 11 | Full rollout & role-based training | Launch | Roll out to remaining lines, deliver role-specific training sessions |
| Week 12 | Hypercare support & review | Launch | Monitor usage, address issues, establish ongoing support cadence |
Team Roles: The Five People You Need
The project team requires five roles. The Project Manager (FTE, full project) owns stakeholder communication, milestone tracking, and risk management. The Data Engineer (FTE, Days 1-50) deploys connectors and builds the data pipeline. The BI Developer (FTE, Days 25-80) builds the semantic model and dashboard screens. The Plant SME (Part-Time) provides domain expertise and validates the data model. The IT Admin (Part-Time) manages network access and user provisioning. Total effort is approximately 6.5 person-months — a lean team that can deliver the full scope within 90 days with the right platform and methodology.
Proven Impact Metrics: Before-and-After Results
The impact metrics show measured outcomes from real-world production dashboard deployments. Reduced downtime: MTBF improved 12-18% as real-time visibility reduced response time from 12 minutes to 4 minutes per event. Faster decision-making: root cause identification accelerated by 70% — operators address issues in minutes instead of end-of-shift reviews. Single source of truth: 6+ hours saved per plant per week in Excel reconciliation — all teams use the same KPI definitions. Operator productivity: OEE improved 8-12 percentage points as self-serve dashboards eliminated manual data requests and operators focused on running the line rather than filling spreadsheets.
Frequently Asked Questions
Can a real-time production dashboard really be built in 90 days?
Yes — but only with a structured approach, pre-built connectors, and a well-defined scope. The 90-day timeline assumes you have: (1) standard plant-floor systems (MES, SCADA, or at minimum PLCs with data capture capability), (2) a dedicated project team (PM + data engineer + BI developer), (3) a single plant for pilot with clear scope boundaries. The fastest we've seen is 45 days for a single production line with existing MES infrastructure. The longest is 6 months for a greenfield deployment across 3 plants with no prior data infrastructure. The 90-day timeline is realistic for a mid-size plant with moderate data maturity — covering data ingestion, semantic model, 8 dashboard screens, alert rules, RBAC, and user training.
What is the most critical success factor for a 90-day dashboard rollout?
Data source readiness — not technology, not budget, not team skill. The single biggest cause of timeline slippage is discovering, after the project starts, that the promised data feed doesn't exist, is unreliable, or requires significant plant-floor IT effort to enable. Before Day 1, conduct a thorough data source audit: confirm each source system exists, has API/export capability, network access is feasible, and data quality is sufficient. The second most critical factor is scope discipline — say no to 'nice-to-have' features during the first 90 days. Additional screens, complex calculations, and cross-plant rollups should be Phase 2. Focus on the core: OEE, Quality, Downtime.
Do I need a data lake or data warehouse before starting?
No. While a data lake or warehouse adds long-term value, you can start with a time-series database and a lightweight semantic layer. For a 90-day rollout, the fastest path is: (1) deploy streaming ingestion into a time-series DB (InfluxDB, TimescaleDB) for real-time SCADA/PLC data, (2) use batch ETL into the same DB for ERP/CMMS transactional data, (3) build KPI calculations in the dashboard layer or a lightweight semantic engine. You can add a data lake in Phase 2 (months 4-6) for historical analytics, data science, and cross-plant consolidation. Don't let data architecture debates delay the first 90 days.
How many dashboard screens should I build in the first 90 days?
Eight screens is the recommended maximum for a 90-day rollout: (1) OEE Overview — real-time line performance, (2) Quality Deep-Dive — FPY, DPPM, defect pareto, (3) Downtime Analysis — loss categories, timeline, top reasons, (4) Scrap Pareto — defect types ranked by cost/volume, (5) Energy Trends — consumption by line/hour, (6) Labour Utilisation — headcount vs output, (7) Cost & Variance — cost/unit, budget vs actual, (8) Executive Summary — cross-KPI status with exception highlights. Fewer is better if resources are tight — the first three (OEE, Quality, Downtime) deliver 70% of the value and can be built in 4-5 weeks.
How does iFactory help accelerate a 90-day production dashboard rollout?
iFactory provides pre-built data connectors for 50+ manufacturing systems (MES, SCADA, ERP, CMMS, PLC protocols), a pre-configured semantic model with 40+ standard KPI formulas, and 12 pre-built dashboard templates covering OEE, Quality, Downtime, Scrap, Energy, Labour, Cost, and Executive views. The platform includes built-in RBAC, alert engine with multi-channel routing (email, Slack, mobile push, TV display), and a KPI calculator with automatic rollup across plant/line/asset hierarchy. For a typical single-plant deployment, iFactory reduces the 90-day timeline to 45-60 days by eliminating the need to build connectors, data models, and screen layouts from scratch.
Deploy in 45 Days
Ready to Build Your Real-Time Production Dashboard? iFactory Cuts the 90-Day Timeline to 45-60 Days.
iFactory provides pre-built data connectors for 50+ manufacturing systems, a pre-configured semantic model with 40+ standard KPI formulas, and 12 pre-built dashboard templates. Built-in RBAC, alert engine with multi-channel routing, and automatic KPI rollup across plant/line/asset hierarchy. Book a 30-minute demo to see how iFactory accelerates production dashboard deployment.