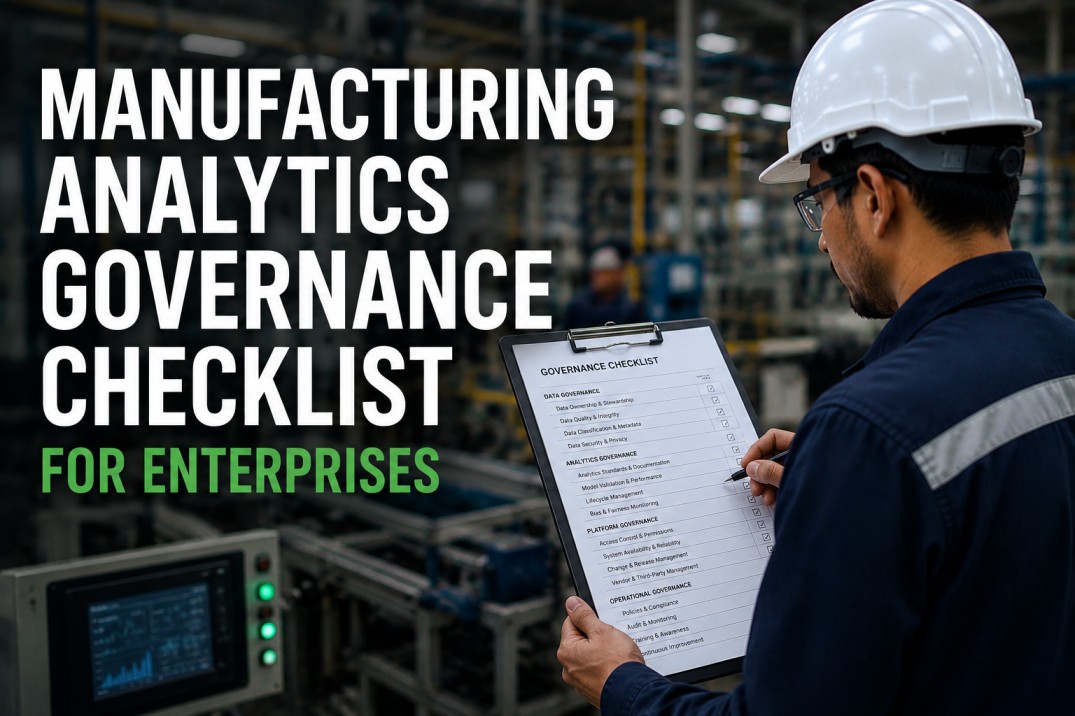
A manufacturing analytics ROI audit gives CFOs a structured framework to verify that analytics investments are delivering the promised financial returns. Without a disciplined audit process, analytics programmes can continue for years without clear evidence of value — consuming budget while claiming vague 'data-driven decision-making' benefits that never appear on the P&L. This checklist covers seven dimensions: a programme-level ROI scoreboard with four headline metrics, an investment breakdown showing where every dollar went, a savings realisation assessment comparing projected vs actual benefits across six categories, a payback timeline tracking cumulative investment recovery, a value driver framework quantifying benefit ranges per category, a cost tracking table monitoring budget vs actual spending, and an ROI action plan with prioritised initiatives to close savings gaps.
ROI Calculator
iFactory Includes a Built-In ROI Calculator That Automatically Tracks Value Realisation Across All Plants
iFactory's ROI Calculator converts operational metrics — OEE improvement, scrap reduction, energy savings, downtime reduction — into financial savings using your configured cost rates. The Savings Tracker provides a real-time CFO dashboard: cumulative investment, cumulative savings, current ROI %, payback progress, and savings by category and plant. All calculations are auditable — drill from any ROI metric to the underlying operational data. Pre-built templates cover 5 standard value driver categories with industry benchmarks.
Manufacturing Analytics ROI Scoreboard: Programme-Level Metrics
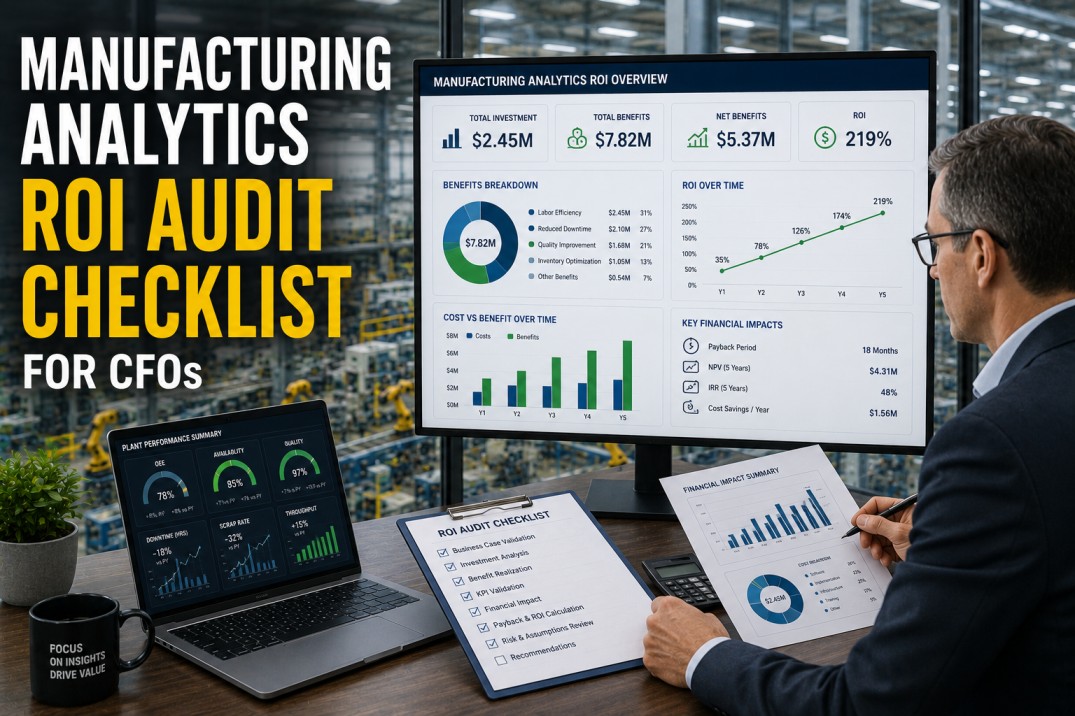
The ROI scoreboard tracks four headline metrics for the manufacturing analytics programme: total investment of $847K across Years 1-3 (software, services, internal effort), annual savings run-rate of $412K projected for Year 3 (with $287K realised in Year 2), net 3-year ROI of 187% against a 150% target, and payback period of 18 months against a 24-month target. The programme is on track, with payback achieved ahead of schedule and ROI trajectory exceeding the target. However, savings realisation varies by category — the scoreboard should be reviewed alongside the category breakdown.
Investment Breakdown: Where Every Dollar Went
The investment breakdown shows total programme spend across four categories. Software licences ($384K, 45%) cover the iFactory platform, BI tools, and data integration middleware across a 3-year term. Implementation services ($268K, 32%) include data integration setup, dashboard development, KPI harmonisation, and change management. Internal team effort ($120K, 14%) represents capitalised analytics lead and plant change champion time. Infrastructure and hardware ($75K, 9%) covers cloud services and edge hardware for low-readiness sites. The 45/32/14/9 split is typical for a mid-size multi-plant deployment.
Savings Realisation Assessment: Projected vs Actual by Category
The savings realisation assessment compares projected vs actual annual savings across six benefit categories. Operational efficiency ($148K projected, $124K actual, 84% realised) and scrap reduction ($96K/$78K, 81%) are on track. Downtime reduction ($72K/$42K, 58%) and inventory reduction ($28K/$18K, 64%) are behind plan — these are dependent on Wave 2-3 plants coming online. Energy optimisation ($48K/$36K, 75%) is slightly behind due to a 2-month delay in energy dashboard rollout. Labour optimisation ($20K/$14K, 70%) is on track with 5 plants contributing.
Payback Timeline: Cumulative Investment Recovery
The payback timeline tracks cumulative investment and savings across seven phases from Q1 2025 through 2027. The investment phase (Q1-Q3 2025) accumulated $280K in costs before any savings began. Pilot value phase (Q4 2025) delivered first measurable savings from 2 live plants, reducing cumulative loss. Wave 2 onboarding (Q1 2026) accelerated savings to $42K/month. By Q2 2026, monthly savings exceeded monthly investment. Payback was achieved in Q3 2026 at 18 months — 6 months ahead of the 24-month target. The value optimisation phase (Q4 2026-2027) projects $412K annual savings run-rate with 187% ROI.
Value Driver Framework: Benefit Ranges per Category
The value driver framework quantifies the expected benefit range for each of six standard manufacturing analytics value categories. OEE improvement delivers 8-12% uplift through reduced changeover time and data-driven continuous improvement. Scrap reduction provides 15-22% defect reduction through real-time quality alerts and pareto analysis. Labour productivity saves 6-10 hours per plant per week by eliminating manual reporting. Energy efficiency reduces kWh/unit by 8-12% through consumption pattern visibility. Inventory turns improve 5-8% through WIP flow visibility. Compliance and safety delivers 3-5% incident reduction through leading indicator dashboards.
Cost Tracking: Budget vs Actual by Category
The cost tracking table monitors budget vs actual spending across 8 cost categories over Years 1-2. The iFactory platform subscription ($168K actual vs $180K budget) and dashboard development ($62K vs $68K) are under budget. Data integration setup ($102K vs $95K), internal team effort ($92K vs $85K), and cloud infrastructure ($52K vs $48K) have small overruns — typical for the integration-heavy early phases of a multi-plant rollout. The total variance is $4K under budget ($634K actual vs $638K budget), within the 2% tolerance range. Y3 budget of $209K is allocated for Wave 3-4 deployments.
| Cost Category | Budget | Actual (Y1–2) | Variance | Status |
|---|---|---|---|---|
| iFactory Platform Subscription | $180K | $168K | $12K under | Under Budget |
| Data Integration Setup | $95K | $102K | $7K over | Over Budget |
| Dashboard Development | $68K | $62K | $6K under | Under Budget |
| 3rd-Party SI Consulting | $105K | $98K | $7K under | Under Budget |
| Internal Analytics Team | $85K | $92K | $7K over | Over Budget |
| Change Management & Training | $42K | $38K | $4K under | Under Budget |
| Cloud Infrastructure | $48K | $52K | $4K over | Over Budget |
| Edge Hardware (Low-Readiness Sites) | $27K | $22K | $5K under | Under Budget |
ROI Action Plan: Closing Savings Gaps and Optimising Returns
The ROI action plan captures 10 initiatives to close savings gaps and optimise returns. P1 priorities include completing Wave 2 rollout to unlock $30K in downtime reduction savings, validating the ROI model with actual Y2 data from 5 live plants, implementing a savings tracking dashboard for real-time CFO visibility, and building the Wave 3-4 business case for continuation funding. P2 priorities address cost overruns in data integration and cloud infrastructure, expand scrap reduction to new plants, quantify energy savings with verified data, and establish quarterly ROI reviews. P3 items focus on documentation and independent verification.
Frequently Asked Questions
How do I calculate the ROI of a manufacturing analytics platform?
Manufacturing analytics ROI is calculated as: ROI = (Total Benefits − Total Costs) / Total Costs × 100. Total costs include software licences, implementation services, internal team effort, and infrastructure over a 3-year horizon. Total benefits typically fall into five categories: operational efficiency (reduced manual reporting, faster decision-making), scrap and rework reduction (quality improvement), downtime reduction (OEE improvement), energy savings (consumption optimisation), and inventory reduction (WIP visibility). Most manufacturers achieve 150-250% ROI over 3 years with payback periods of 12-24 months. The key is tracking benefits category by category — aggregate ROI numbers are less useful than a breakdown showing which categories are delivering and which need attention.
What is a realistic payback period for manufacturing analytics?
Based on 50+ manufacturing analytics deployments, the median payback period is 16 months, with 80% of projects achieving payback within 24 months. Payback timing depends on three factors: (1) number of plants — single-plant deployments pay back in 8-12 months, multi-plant in 14-20 months; (2) data maturity — plants with existing MES/SCADA infrastructure pay back 4-6 months faster than those starting from spreadsheets; (3) scope — OEE and quality dashboards (quick wins) create measurable savings in 3-4 months, while energy and cost dashboards take 6-8 months. CFOs should expect positive monthly contribution from each plant within 6 months of go-live.
What are the most common reasons manufacturing analytics ROI falls short?
The five most common ROI shortfall reasons are: (1) Underestimating data integration effort — connecting to plant-floor systems (PLC, SCADA, MES) typically takes 2-3x longer than anticipated. (2) Overestimating user adoption — dashboards that don't match how operators and supervisors actually make decisions get ignored, regardless of technical quality. (3) Ignoring change management — the single biggest ROI driver is not the technology but whether people change their behaviour based on the data. (4) Fragmented tooling — using different tools for different plants creates integration overhead and prevents cross-plant benchmarking. (5) No benefits tracking — without a structured savings realisation framework, you can't prove (or improve) ROI.
How do I track and report analytics ROI to the board?
Implement a three-layer ROI reporting framework: Layer 1 — Executive Dashboard (monthly): top-level metrics — total investment to date, cumulative savings, current ROI %, payback status, and year-over-year trend. Layer 2 — Category Breakdown (quarterly): savings by category (efficiency, scrap, downtime, energy, inventory) with actual vs projected comparison, variance analysis, and corrective actions for underperforming categories. Layer 3 — Plant-Level Detail (quarterly): ROI contribution by plant, showing which plants are ahead of plan, which are behind, and the root cause of variance. This framework gives the board confidence that ROI is being actively managed, not passively reported.
How does iFactory help CFOs track manufacturing analytics ROI?
iFactory includes a built-in ROI Calculator and Savings Tracker that automatically aggregates value realisation data across all plants. The calculator ingests actual production data — OEE improvement, scrap reduction, energy savings, downtime reduction — and converts operational metrics into financial savings using configurable cost rates (material cost per unit, energy cost per kWh, labour cost per hour, etc.). The Savings Tracker provides a CFO dashboard with real-time ROI metrics: cumulative investment, cumulative savings, current ROI %, payback progress, and savings by category and plant. All calculations are auditable — the CFO can drill through from any ROI metric to the underlying operational data. Pre-built templates cover the 5 standard value driver categories with industry benchmark ranges for validation.
Calculate Your ROI
Ready to Build Your Manufacturing Analytics ROI Case? iFactory's Built-In ROI Calculator Makes It Simple.
iFactory's ROI Calculator automatically tracks value realisation across all plants — converting OEE improvement, scrap reduction, energy savings, and downtime reduction into financial savings using your configured cost rates. The Savings Tracker provides a real-time CFO dashboard with auditable metrics. Pre-built templates cover 5 standard value driver categories with industry benchmarks. Book a 30-minute demo to see how CFOs use iFactory to track, verify, and optimise manufacturing analytics ROI.
.png)