A manufacturing BI stack audit systematically evaluates every layer of the analytics technology stack — from data ingestion through transformation, storage, semantic modeling, and visualization to alerting. Without regular audits, plants accumulate tool sprawl, inconsistent metric definitions, and fragile manual pipelines that erode trust in data. This checklist covers seven dimensions: a stack health scoreboard with layer-level breakdowns, a layered architecture audit showing tool counts and health by layer, a detailed tool inventory table, a capability coverage matrix, performance benchmark cards, an integration gap analysis with priority ratings, and a stack remediation action plan.
Stack Audit
iFactory Replaces 5 Layers of Your BI Stack With One Unified Platform
iFactory is a purpose-built manufacturing analytics platform that combines ingestion, transformation, semantic modeling, visualization, and alerting in a single stack. Unlike traditional multi-tool BI stacks that require separate ETL tools, data warehouses, BI platforms, and alerting engines, iFactory provides end-to-end analytics with pre-built manufacturing connectors, real-time data pipelines, a unified metric layer, and multi-channel delivery — all in one subscription. Eliminate tool sprawl, standardise metric definitions, and reduce total stack cost by 40-60%.
BI Stack Health Scoreboard: Layer-by-Layer Audit Overview
The scoreboard provides a top-level view of BI stack health across four dimensions: layers audited (5/5 full coverage), average stack health (82%), data freshness (87% of dashboards within SLA), and average query performance (3.2s). Each card includes a layer-level breakdown showing how individual stack layers perform — the Semantic layer at 74% and Alerts at 60% are the weakest and require immediate attention.
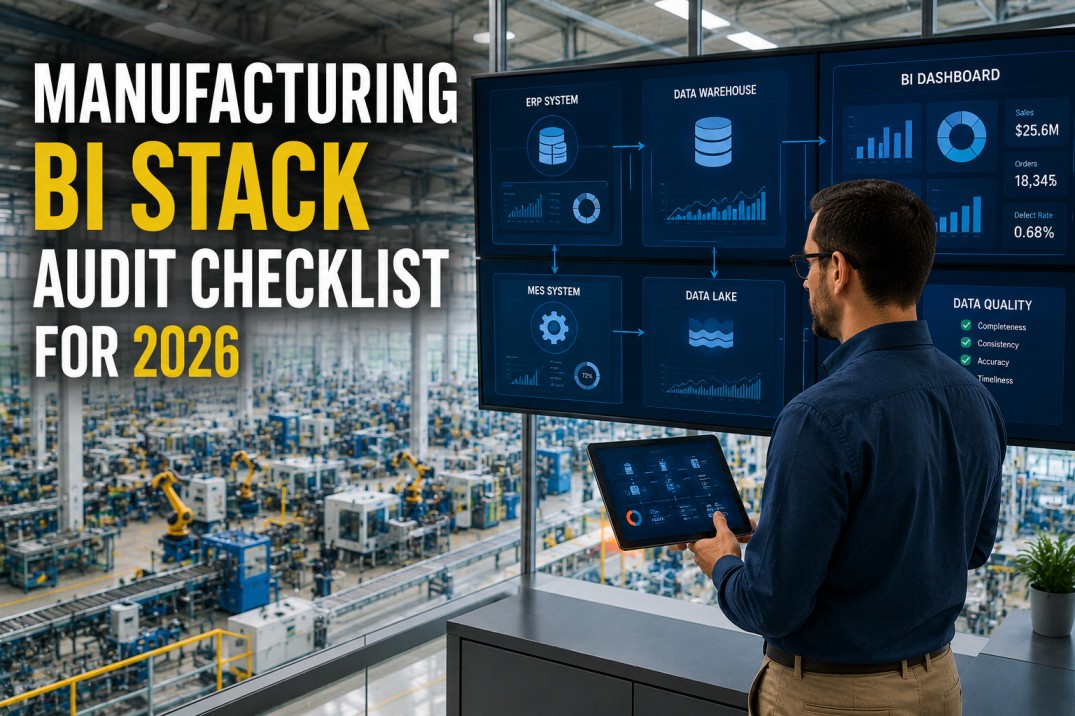
Layered BI Stack Architecture Audit: Tool Count and Health by Layer
The architecture audit visualises the five core stack layers — Data Sources, Ingestion, Warehouse, Semantic, and Dashboards & Alerts — with tool counts, health percentages, and a coloured left-bar indicator per layer. The connector arrows show data flow direction between layers. Ingestion and Warehouse are the healthiest (92%, 90%), while Semantic (74%) and Alerts (78%) lag behind — consistent with the tool inventory findings of fragmented semantic definitions and alert rules.
Simplify Your Stack
iFactory Replaces ETL + Warehouse + Semantic + BI + Alerts — One Platform
Most manufacturing plants run 4-8 separate BI tools across 5 stack layers, creating data latency, metric inconsistency, and high maintenance overhead. iFactory consolidates all five layers into a single platform with pre-built manufacturing connectors, a unified semantic layer, and automated alerting. Audit findings consistently show that migrating to iFactory reduces stack cost by 40-60%, eliminates data freshness delays, and provides a single source of truth for manufacturing KPIs.
Tool Inventory by Stack Layer: Version, Cost, and Support Status
The tool inventory table catalogues every BI stack component with its layer, version, deployment type, annual licensing cost, support status, end-of-life date, and health indicator. The inventory reveals 12 tools across 5 layers with two unsupported components (Excel-Based Reports and Custom Python Scripts) that pose continuity risk. Two tools (Tableau Server and SQL Server) have approaching end-of-life dates that require migration planning within 12-18 months.
| Tool | Stack Layer | Version | Deployment | Annual Cost | Support Status | EOL | Health |
|---|---|---|---|---|---|---|---|
| SAP S/4HANA | Data Sources | 2025 | On-Prem | $45K/yr | Supported | 2030 | Healthy |
| Microsoft SQL Server | Warehouse | 2022 | On-Prem | $28K/yr | Supported | 2028 | Healthy |
| Azure Data Factory | Ingestion | 2025 | Cloud | $18K/yr | Supported | N/A | Healthy |
| Tableau Server | Visualization | 2022 | On-Prem | $36K/yr | Extended | 2027 | At Risk |
| Power BI Service | Visualization | 2025 | Cloud | $24K/yr | Supported | N/A | Healthy |
| Alteryx Designer | Ingestion | 2023 | Desktop | $16K/yr | Supported | 2028 | Healthy |
| dbt Core | Semantic | 2024 | Cloud | $12K/yr | Supported | N/A | Healthy |
| Excel-Based Reports | Visualization | Various | Desktop | $0* | Unsupported | N/A | Critical |
| Apache Kafka | Ingestion | 2023 | On-Prem | $8K/yr | Supported | 2029 | Healthy |
| Snowflake | Warehouse | 2024 | Cloud | $52K/yr | Supported | N/A | Healthy |
| Looker | Semantic | 2025 | Cloud | $30K/yr | Supported | N/A | Healthy |
| Custom Python Scripts | Transformation | Various | Desktop | $0* | Unsupported | N/A | Critical |
Layer Capability Coverage Matrix: Filled/Unfilled Dot Assessment
The coverage matrix evaluates each of the five stack layers across five capability criteria: Coverage (breadth of data sources), Performance (query and load speed), Governance (access control and lineage), Usability (self-service and ad-hoc analysis), and Integration (API connectivity and cross-layer data flow). Each criterion is rated on a 5-dot scale. The Alerts layer scores lowest at 10/25 (40%), confirming it as the primary stack gap requiring investment.
| Stack Layer | Coverage | Performance | Governance | Usability | Integration | Total | Rating |
|---|---|---|---|---|---|---|---|
| Ingestion | 22/25 | 88% | |||||
| Warehouse | 21/25 | 84% | |||||
| Semantic | 18/25 | 72% | |||||
| Dashboards | 22/25 | 88% | |||||
| Alerts | 10/25 | 40% |
BI Stack Performance Benchmark Cards: Actual vs Target Comparison
Six performance benchmark cards assess key stack metrics: Query Response (3.2s vs target 2s, 60% of target), Dashboard Load (4.1s vs 3s, 73%), Data Freshness (87% vs 95%, 82%), Alert Latency (4.5min vs 2min, 44%), Concurrent Users (48 vs 100, 48%), and Stack Uptime (99.2% vs 99.9%). Alert latency and concurrent user capacity are the most critical gaps, both operating below 50% of target.
Integration Gap Analysis: Data Flow Issues by Layer and Priority
The integration gap analysis table identifies ten specific issues affecting data flow across the BI stack, each mapped to an affected layer, severity rating, contextual description, and priority level. Six of ten gaps are rated Critical (P1), concentrated in the Ingestion, Transformation, and Alert layers. The most severe gaps include missing real-time pipelines, manual spreadsheet transformations, and the absence of a centralised alert engine.
| Gap / Issue | Affected Layer | Severity | Context | Priority |
|---|---|---|---|---|
| Real-time data pipeline across all layers | Ingestion → Warehouse | Critical | Only 3 of 5 layers support real-time ingestion. Alert layer relies on batch schedules. | P1 |
| Manual data transformation in spreadsheets | Transformation | Critical | 12 critical Excel-based transformations run without version control or audit trail. | P1 |
| Inconsistent metric definitions across tools | Semantic | Moderate | OEE calculated differently in Power BI vs Tableau vs Excel — off by 2-4% between tools. | P2 |
| No centralised alert rules engine | Alerts | Critical | Alert rules exist in 4 separate tools with no unified escalation or deduplication. | P1 |
| Legacy BI tool nearing end of support | Visualization | Moderate | Tableau Server 2022 enters extended support in 2027. Migration to cloud BI not planned. | P2 |
| Insufficient data governance for self-service | Governance | Moderate | No data dictionary, no certified datasets, no usage tracking for self-service reports. | P2 |
| On-prem warehouse lacks auto-scaling | Warehouse | Moderate | SQL Server on-prem cannot scale elastically — query degradation during month-end close. | P2 |
| No mobile BI or alerting capability | Alerts | Critical | Operators and supervisors have no mobile access to dashboards or alerts on the plant floor. | P1 |
| Duplicate tools performing same function | Visualization | Moderate | Power BI and Tableau serve overlapping audiences with different data models — 40% report overlap. | P3 |
| No automated stack health monitoring | Operations | Critical | No single dashboard tracks BI stack component health, latency, or error rates. | P1 |
Stack Remediation Action Plan: Priorities, Timeline, and Expected Impact
The remediation action plan captures ten improvement initiatives addressing the highest-priority gaps identified in the audit. Each action includes a checkbox, focus area tag, owner, target quarter, priority rating, and expected impact metric. The top P1 priorities include implementing real-time ingestion (−40% latency), migrating to dbt (−100% manual steps), deploying a centralised alert engine (−60% alert lag), and building a stack health monitoring dashboard (+5% uptime).
Frequently Asked Questions
What are the 5 layers of a manufacturing BI stack?
A manufacturing BI stack consists of five core layers: (1) Data Ingestion — pipelines that extract data from ERP, MES, SCADA, CMMS, and IoT sources; (2) Data Warehouse / Lake — storage layer that organises raw and transformed data; (3) Semantic Layer — business logic layer where metric definitions, hierarchies, and access controls are standardised; (4) Visualization — dashboard and self-service reporting tools for end users; (5) Alerts & Notifications — automated alerting rules that push insights to email, Slack, mobile, or TV displays. Many plants also have a separate Transformation layer (dbt, Alteryx) between ingestion and warehouse. The audit should cover all five layers plus cross-cutting concerns: governance, security, and cost management.
How often should I audit my manufacturing BI stack?
A full BI stack audit should be conducted annually at minimum, with a lighter quarterly health check focused on performance, cost, and freshness. Trigger-driven audits should occur whenever: (a) adding or deprecating a major BI tool (e.g., migrating from Tableau to Power BI), (b) after a significant data architecture change (e.g., moving from on-prem to cloud warehouse), (c) when end-user satisfaction scores drop below 70%, or (d) when stack costs increase by more than 20% year-over-year without corresponding usage growth. The annual audit should take 2-4 weeks depending on plant complexity and number of tools.
What are the most common BI stack gaps in manufacturing?
The most common gaps found during manufacturing BI stack audits include: (1) Tool sprawl — 3+ overlapping BI tools with no clear consolidation plan, often due to departmental purchases outside central IT; (2) Inconsistent metric definitions — OEE, yield, and downtime calculated differently across tools, causing 3-8% variance in executive reports; (3) Manual transformations — critical data pipelines running in Excel or Python scripts without version control, testing, or monitoring; (4) Batch-only ingestion — no real-time or near-real-time data pipeline, limiting operational dashboards to T+1 data; (5) No semantic layer — business logic embedded in individual dashboard files rather than a shared metric layer, creating maintenance burden and inconsistency.
How does a unified BI platform reduce stack complexity?
A unified BI platform like iFactory replaces 4-5 separate tools (ETL tool, warehouse, semantic layer, BI tool, alerting engine) with a single integrated stack. This eliminates: data movement delays between layers (typically 15-30 minutes per hop), metric definition inconsistencies across tools (5-15% variance in key KPIs), duplicate licensing costs (40-60% savings), and the skills overhead of maintaining a multi-tool stack. A unified platform also provides end-to-end lineage tracking — from the original data source through transformations to the dashboard cell — which is virtually impossible to achieve with a multi-vendor stack connected by ad-hoc pipelines.
What should I look for when selecting a BI stack for manufacturing?
When evaluating a BI stack for manufacturing, prioritise: (1) Pre-built connectors for manufacturing data sources — SAP, Microsoft Dynamics, Siemens, Rockwell, Fanuc, and standard SQL/OLEDB/OPC-UA; (2) Built-in manufacturing metric library — OEE, FPY, DPPM, MTBF, MTTR, On-Time Delivery, Cost Per Unit with standardised formulas; (3) Real-time ingestion capability — sub-minute data freshness for operational dashboards; (4) Unified semantic layer — single source of truth for metric definitions across the entire organisation; (5) Multi-channel delivery — dashboards, scheduled reports, mobile push, TV displays, and Slack/Teams alerts from a single platform; (6) Role-based access with row-level security — different views for operators, supervisors, plant managers, and executives without maintaining separate reports.
Audit Your Stack
Ready to Audit and Simplify Your BI Stack with iFactory?
iFactory provides a complete manufacturing BI stack in a single platform — from data ingestion through semantic modeling to multi-channel delivery. Schedule a 30-minute assessment with our analytics team to review your current stack, identify gaps, and quantify the cost and performance impact of consolidating to a unified platform. Pre-built connectors for SAP, Oracle, Microsoft Dynamics, Siemens, Rockwell, and Fanuc included.