A real-time vs batch data architecture audit systematically evaluates every data source in your manufacturing analytics ecosystem — classifying each source by its latency requirements, assessing current pipeline health, and identifying which sources should stay batch, which should move to real-time streaming, and which need a hybrid approach. Without this audit, plants make ad-hoc architecture decisions that create inconsistent patterns, technical debt, and costly rework. This checklist covers seven dimensions: a pipeline scoreboard quantifying current architecture state, a close comparison of real-time and batch approaches, a data source decision matrix classifying 10 manufacturing data types, a latency tier reference mapping use cases to freshness requirements, a source-by-source architecture classification with 8 data sources, a pipeline health assessment across 6 functional areas, and a migration action plan with prioritised streaming initiatives.
Hybrid Architecture
iFactory Handles Real-Time and Batch Data Side by Side — One Platform, Both Pipelines
iFactory is built natively for hybrid architectures. A Kafka-based stream processing engine ingests machine data at sub-second latency for OEE, quality, energy, and alarms. A batch ingestion layer handles scheduled loads from ERP, CMMS, and 30+ manufacturing systems. Both pipelines converge into a unified data model — dashboards, reports, and alerts mix real-time and batch data seamlessly with clear freshness indicators on every metric.
Pipeline Architecture Scoreboard: Current State Metrics
The architecture scoreboard tracks four dimensions of pipeline health: total real-time streams active (12), nightly batch jobs running (38), average pipeline latency across all data sources (4.2 minutes), and total daily data volume (2.4 TB). The progress bars show relative health per dimension — stream coverage at 72%, batch reliability at 85%, but latency compliance at only 54% against the < 30 second target for critical streams. Only 68% of total data volume flows through pipelines that match their optimal architecture.
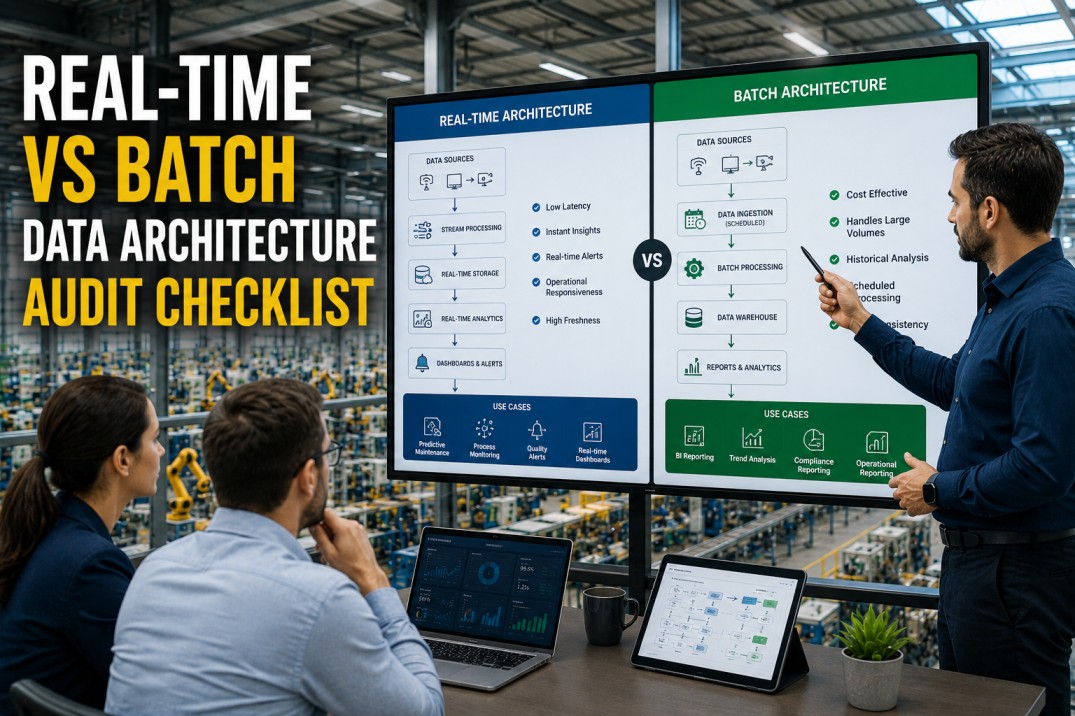
Real-Time vs Batch: Head-to-Head Architecture Comparison
The comparison cards provide a side-by-side evaluation of real-time streaming and batch processing across six key dimensions. Real-time excels at operational alerting, live dashboards, and high-frequency sensor data but requires higher infrastructure investment and specialised expertise. Batch wins on simplicity, cost efficiency, and reprocessing capability but introduces data latency that makes it unsuitable for operational decisions. Most manufacturing plants should aim for a hybrid approach — streaming for operational metrics, batch for financial and historical analysis.
Data Source Decision Matrix: Real-Time vs Batch Recommendation
The decision matrix classifies 10 common manufacturing data types by their source frequency and recommends the appropriate architecture. Machine sensor data, quality results, production counts, and customer order data all need real-time streaming. Energy consumption and MES data are candidates for hybrid approaches. Financial cost data, shift attendance, and maintenance work orders are adequately served by batch. Each recommendation includes a specific action — upgrade to streaming, streaming feasible, batch adequate, or already streaming.
| Data Type | Frequency | Recommended Architecture | Action |
|---|---|---|---|
| Machine sensor data (OEE, cycle times) | High-frequency, sub-second | Real-Time | Streaming recommended |
| Quality inspection results (per batch) | Per-batch, < 1 min | Real-Time | Streaming feasible |
| Production count / throughput | Event-driven, real-time | Real-Time | Already streaming |
| Energy consumption (per machine) | Continuous, 1s intervals | Real-Time | Upgrade to streaming |
| Lab analysis / CMM results | Per shift, batch | Batch | Batch adequate |
| Financial cost data (ERP) | Daily / monthly | Batch | Batch optimal |
| Inventory / WIP snapshots | Hourly / daily | Hybrid | Real-time for critical SKUs |
| Maintenance work orders | Event-driven, variable | Hybrid | Streaming for alerts |
| Shift attendance / labour data | Per shift, daily | Batch | Batch adequate |
| Customer order / shipment data | Event-driven | Real-Time | Already streaming |
Latency Tier Reference: Mapping Use Cases to Freshness Requirements
The latency tier reference maps four freshness tiers — sub-second, near real-time (seconds), intra-day (minutes), and nightly batch (hours) — to specific manufacturing use cases. Each tier includes example use cases and recommended latency ranges. The goal is to match each data source to the minimum acceptable latency tier — over-investing in streaming for batch-adequate use cases wastes infrastructure budget, while under-investing in streaming for operational use cases misses the value of real-time decision-making.
Data Source Classification: Architecture Assessment by Source System
The source classification cards evaluate 8 manufacturing data sources on their real-time and batch capability, current pipeline approach, data quality, and recommended action. SCADA/PLC and energy management systems are stream-native and should move to push-based streaming. MES and QMS are stream-capable and should adopt CDC-based streaming for critical data. CMMS, ERP, and HR systems are batch-only and should remain batch — the cost of streaming exceeds the value for these sources.
Pipeline Health Assessment: Current State by Functional Area
The pipeline health assessment evaluates data pipeline maturity across 6 functional areas — production monitoring, quality, maintenance, energy, supply chain, and finance. Each area shows the current pipeline architecture, key metrics (stream coverage, latency, completeness), and a recommended improvement. Production monitoring and maintenance are the highest-priority areas for streaming expansion. Supply chain and finance are adequately served by batch but could benefit from incremental improvements.
Architecture Migration Action Plan: Prioritised Streaming Initiatives
The architecture migration action plan captures 10 initiatives to move data sources toward their optimal pipeline architecture. The top P1 priorities focus on expanding streaming to all critical production lines, implementing real-time condition monitoring on 20 critical assets, and upgrading the energy dashboard's pipeline to consume the Modbus stream directly. P2 priorities include switching MES to CDC-based streaming and adding real-time quality alerts for remaining process parameters. The plan also includes foundational governance actions: architecture decision records and quarterly review cadence.
Frequently Asked Questions
When should I choose real-time streaming over batch processing for manufacturing data?
Choose real-time streaming when data freshness directly impacts operational decisions — machine health monitoring, quality alerts, production line balancing, and safety detection. A good rule of thumb: if a 5-minute delay in seeing a metric could cause a defect, safety incident, or material loss, that metric needs streaming. Choose batch when the data is used for historical analysis, monthly financial close, compliance reporting, or trend analysis where sub-hour freshness provides no incremental value. In practice, most plants should use a hybrid architecture — streaming for operational metrics (OEE, quality, energy, alarms) and batch for financial, cost, and long-term trend data.
What are the common mistakes in real-time vs batch architecture decisions?
The three most common mistakes are: (1) Streaming everything — applying real-time to every data source because 'it's modern,' ignoring that batch is simpler, cheaper, and equally effective for 60% of manufacturing data. (2) Ignoring the 'last mile' — building a real-time pipeline but serving stale dashboards because the BI tool refreshes hourly. (3) No architecture decision record — each data source is implemented ad-hoc with no documented rationale, leading to inconsistent patterns and technical debt. The fix: classify every data source by latency requirement, document the architecture decision, and audit quarterly.
How do I transition a data source from batch to real-time?
The transition follows a five-step process: (1) Assess — determine the source system's real-time capability (native streaming, CDC support, polling API, or batch-only export). (2) Design — choose the streaming approach: change data capture (CDC) for databases, message queue for event-driven sources, or protocol adapter for PLC/SCADA (OPC-UA / MQTT). (3) Pilot — run stream and batch in parallel for 2-4 weeks, comparing data completeness, latency, and accuracy. (4) Validate — confirm the stream produces identical results to the batch pipeline (reconciliation report). (5) Cutover — decommission the batch pipeline and update all downstream consumers to the streaming source.
How does iFactory handle hybrid real-time and batch architectures?
iFactory is built natively for hybrid architectures. The platform ingests data through two parallel pipelines: a real-time stream processing engine (Kafka-based) for sub-second operational metrics, and a batch ingestion layer for scheduled loads from ERP, CMMS, and other source systems. Both pipelines converge into a unified data model — dashboards, reports, and alerts can mix real-time and batch data seamlessly with clear freshness indicators on every metric. The iFactory architecture includes: (1) stream processors for OEE, quality, energy, and alarms at sub-second latency; (2) batch connectors for 30+ manufacturing systems with built-in scheduling; (3) a unified metric layer that resolves latency differences automatically; and (4) architecture governance tools to classify, document, and audit every data source.
What infrastructure do I need to support real-time streaming in a manufacturing plant?
A production-grade real-time streaming architecture requires five components: (1) Data ingestion — protocol adapters for OPC-UA, MQTT, Modbus TCP for machine-level data, plus CDC connectors for database sources. (2) Message broker — a scalable, fault-tolerant message bus (Kafka, Kinesis, or similar) that buffers and distributes stream data. (3) Stream processor — a computation engine (Kafka Streams, Flink, Spark Streaming) that transforms, aggregates, and enriches the stream. (4) Storage — a time-series database (TimescaleDB, InfluxDB) for high-cardinality machine data, plus a serving layer (materialised views) for dashboard queries. (5) Monitoring — stream health dashboards that track lag, throughput, error rates, and data completeness. Most manufacturing plants can start with a single Kafka broker and scale as needed — the cost is typically 15-25% of the total analytics stack.
Streamline Your Pipelines
Ready to Audit Your Data Architecture? iFactory Ingests Real-Time Streams and Batch Loads Side by Side.
iFactory provides a complete hybrid data architecture platform — Kafka-based streaming for sub-second operational metrics and built-in batch connectors for 30+ manufacturing systems. All data converges into a unified metric layer with clear freshness indicators. Architecture governance tools classify, document, and audit every data source. Book a 30-minute demo to see how iFactory simplifies real-time vs batch architecture decisions for multi-plant manufacturing operations.