An OEE report template is the most requested analytics deliverable in any manufacturing plant — yet most plants still build theirs from scratch every shift. The shift supervisor copies numbers from the whiteboard into a spreadsheet, the day supervisor combines three shift reports into a daily summary, and the plant manager reconciles thirty daily reports into a weekly review for leadership. By the time the consolidated numbers reach the executive team, they are three weeks old and nobody trusts the methodology. This template eliminates the manual chain by generating shift, daily, and weekly OEE reports from a single connected data source — with consistent calculations, automated loss categorization, and live drill-down to root cause at every cadence.
Stop Building OEE Reports by Hand Every Shift
Get the complete OEE report template with shift, daily, and weekly views — pre-built and connected to your production data. An iFactory analytics specialist will walk you through the template using your plant's actual OEE data in a 30-minute live demo.
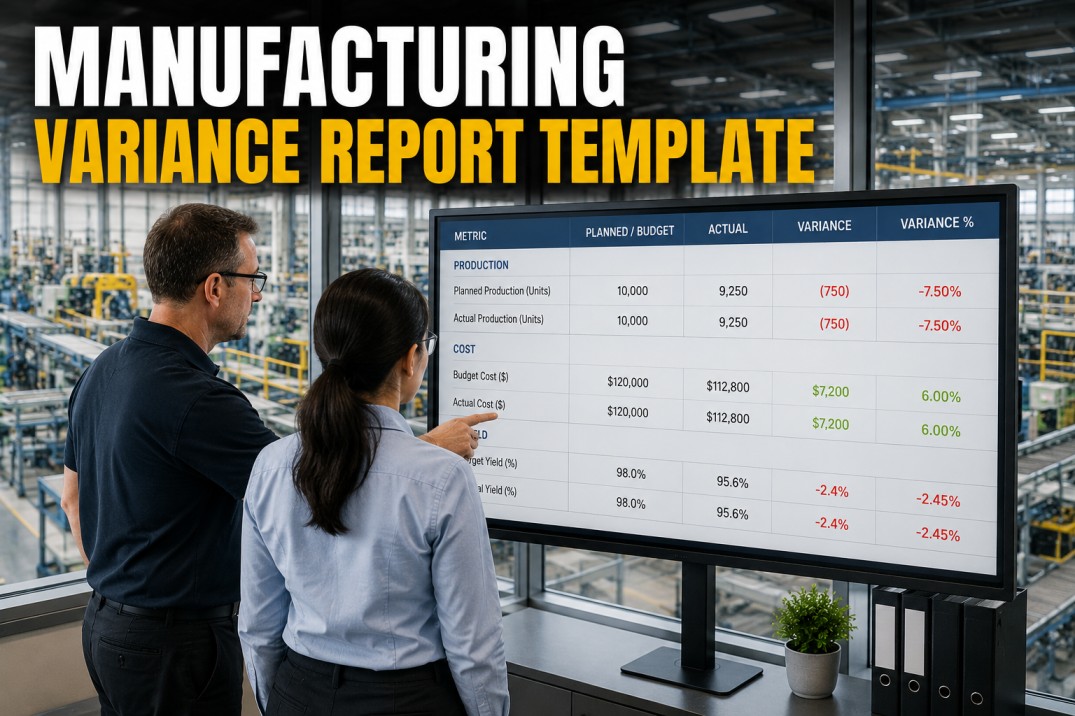
Overall Equipment Effectiveness — Current Period
The OEE score is the headline number in every report cadence. The template calculates OEE as Availability × Performance × Quality, with each factor computed automatically from shop floor data. The score below represents a typical plant's current OEE against the world-class target of 85%.
The Six Big Losses — OEE Factor Breakdown
The six big losses framework is the foundation of OEE analysis. Every loss event in the plant falls into one of these six categories across the three OEE factors. The template automatically categorizes downtime events, speed losses, and quality defects into the correct loss category so that improvement teams can focus on the highest-impact areas.
Unplanned equipment failures that stop production. Includes mechanical, electrical, and control system failures. The template flags any unplanned downtime event as a breakdown loss automatically.
19% of total lossTime spent changing over equipment between production runs, including warm-up and calibration. The template distinguishes planned changeovers from unplanned adjustments.
17% of total lossShort stoppages (typically under 5 minutes) that do not require maintenance intervention. Includes sensor jams, material flow interruptions, and operator delays.
27% of total lossOperating below the ideal cycle time due to equipment wear, suboptimal settings, or operator inexperience. The template calculates speed loss as the gap between actual and ideal cycle time.
21% of total lossUnits produced that do not meet quality specifications on first pass. Includes products that require rework, reprocessing, or are scrapped entirely.
13% of total lossDefective units produced during startup, warm-up, or changeover ramp-up. These losses are categorized separately from steady-state defects because the root cause differs.
9% of total lossOEE Loss Pareto — Where the Time Goes
The loss Pareto view in the template ranks every OEE loss category by its contribution to total lost production time. This single visualization tells the plant leadership team exactly where to focus their improvement efforts. The Pareto principle almost always holds: 80% of OEE loss comes from 2-3 categories.
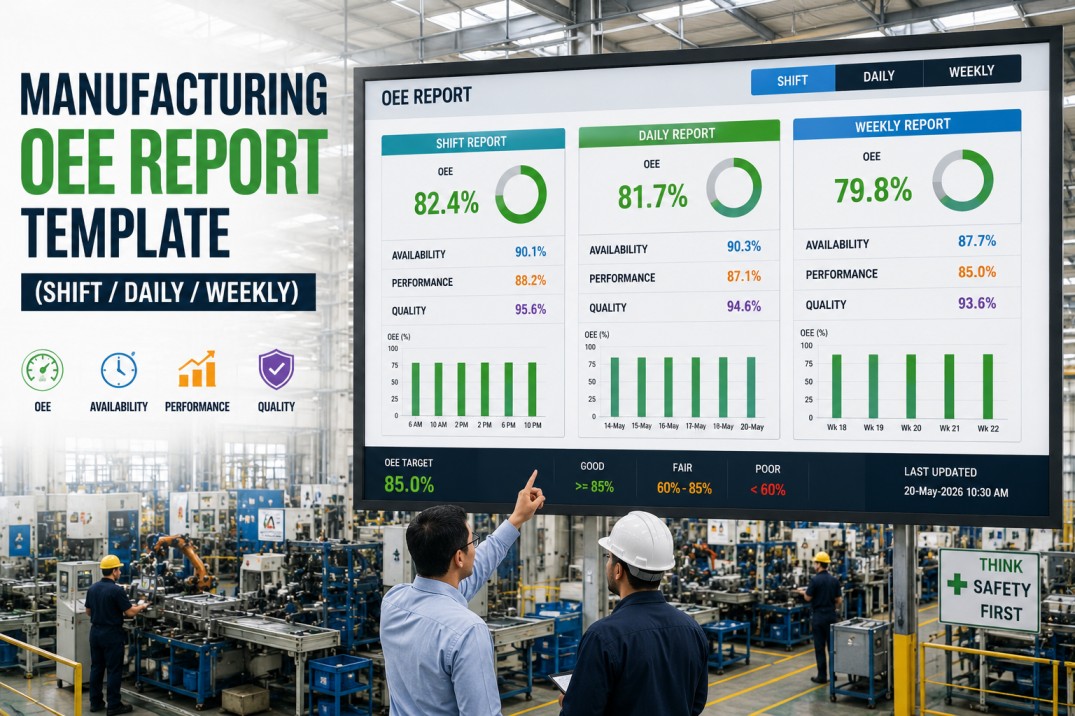
Shift, Daily & Weekly OEE Reports — Three Cadences, One Template
The template generates OEE reports at three cadences automatically, each tailored to the decision cycle of its audience. The same underlying data flows through all three views, so shift numbers roll up to daily, and daily numbers roll up to weekly — automatically, with no manual consolidation.
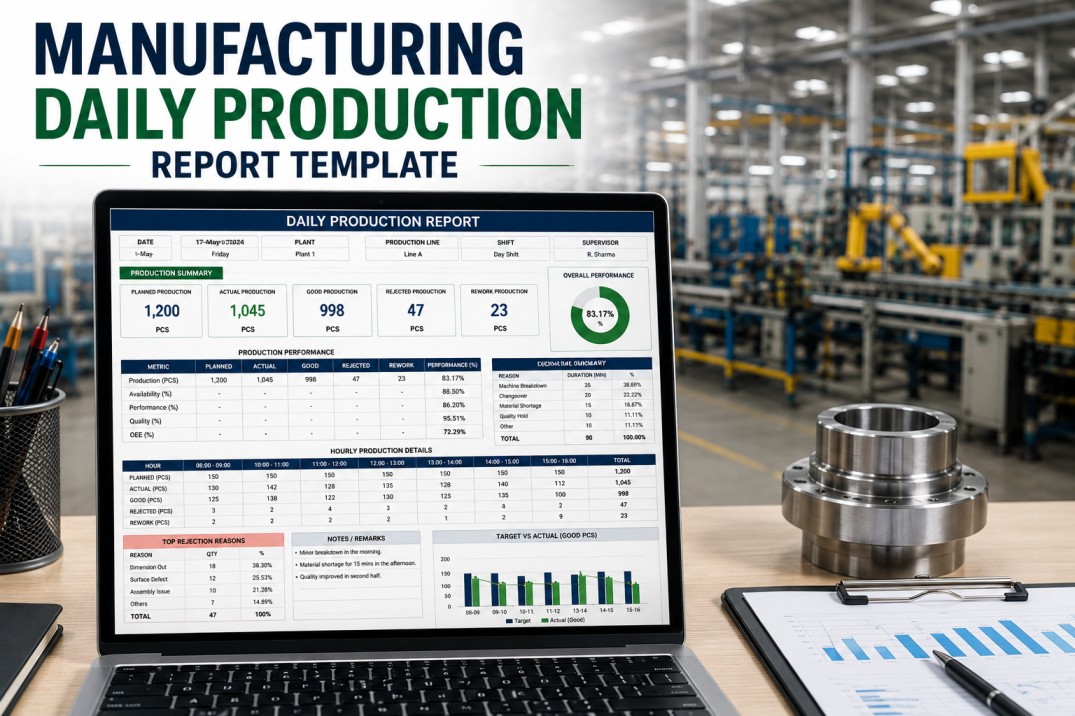
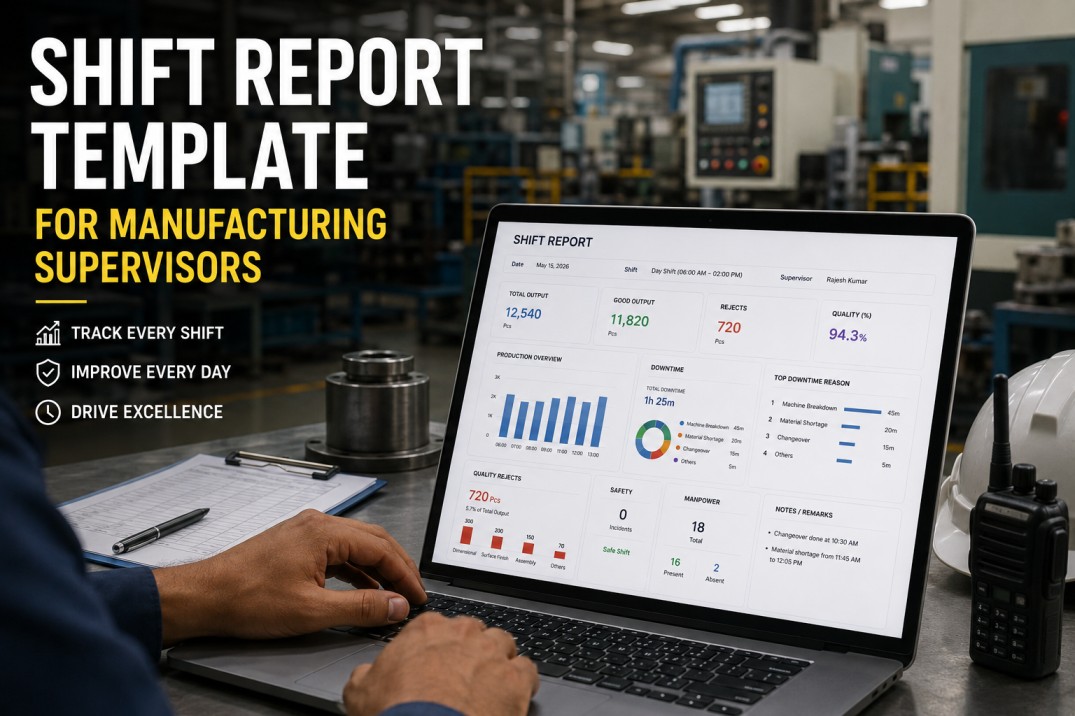
Real-time OEE for the current shift with comparison to the previous shift. Includes live OEE score, factor breakdown, top loss event, and production count vs target. Used by shift supervisors for real-time decision-making.
Consolidated OEE for the past 24 hours across all shifts. Includes shift-to-shift comparison, loss Pareto for the day, trend vs prior day, and top 3 loss events requiring attention.
Seven-day OEE summary with day-over-day trend, cumulative loss Pareto, top 5 loss events ranked by duration, and OEE by line or product family. Used for weekly operations reviews.
OEE Reports — Automated at Every Cadence
iFactory Generates Shift, Daily & Weekly OEE Reports from Live Data
Pre-built OEE report template with automatic loss categorization, live data connectors, and role-based views for every stakeholder. A 30-minute demo connects the template to your production data and shows live OEE reports at all three cadences.
OEE Calculation — Three Factors, One Formula
The template applies the standard OEE formula defined by the OEE Industry Standard. Each factor is calculated independently from shop floor data so that improvement teams can identify exactly which factor is dragging down the overall score. The calculation blocks below show how each factor is computed and how they combine.
Run Time = Planned Production Time minus Downtime (breakdowns + setup + adjustment). The template pulls planned time from the production schedule and downtime from the CMMS or MES automatically.
Performance compares actual production speed to the ideal (designed) cycle rate. The template pulls the ideal cycle time from the equipment specification and calculates actual speed from production counts.
Quality measures the percentage of units that meet specification on first pass. The template pulls total production counts from the MES and defect counts from the quality system or inspection data.
Overall Equipment Effectiveness is the product of three factors. If any factor drops, OEE drops proportionally. The template highlights which factor is the primary constraint for each reporting period.
13-Week OEE Trend — Weekly Performance History
The weekly OEE trend view shows 13 weeks of performance history at a glance. Each vertical bar represents one week's OEE score, with the world-class target of 85% shown as a reference line. Plant managers use this view to assess whether OEE is improving, declining, or holding steady — and to correlate changes with specific improvement initiatives.
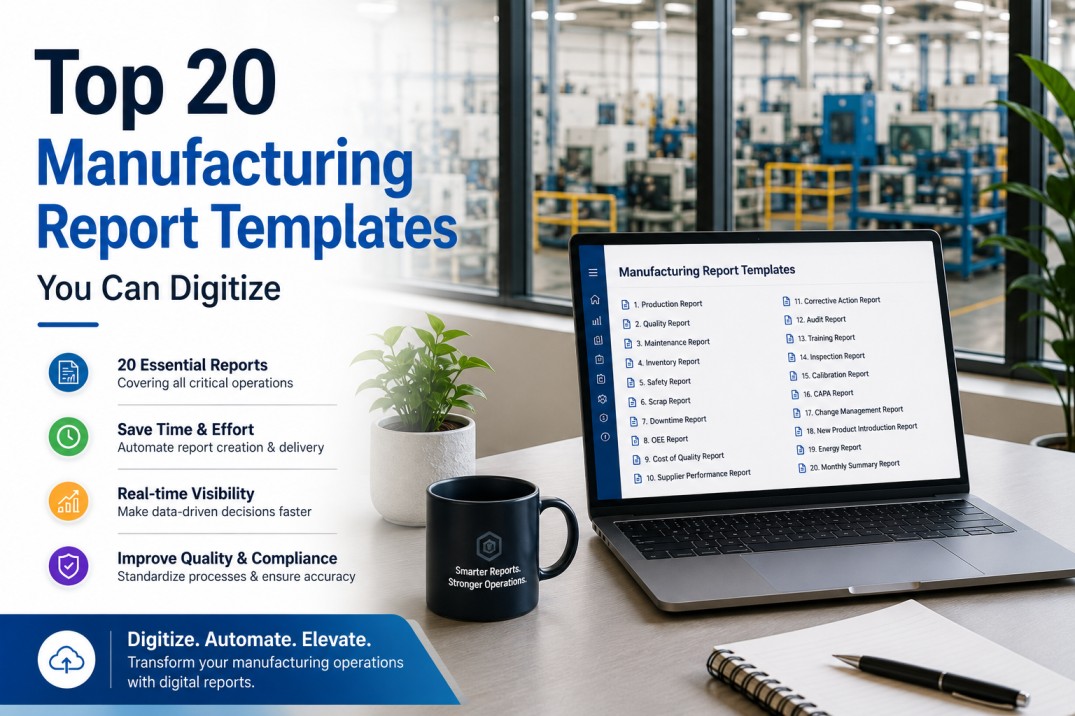
What the OEE Report Template Includes
The OEE report template ships with a complete set of pre-built components that connect to your production data and deliver role-appropriate OEE reports at every cadence. Every component is designed for zero-manual-effort operation — connect once, and reports generate automatically from that point forward.
Automated OEE calculation at shift, daily, and weekly cadences. Computes Availability, Performance, and Quality from raw production data with transparent, auditable formulas.
Automatically classifies every downtime event, speed loss, and quality defect into one of the six big loss categories using rules that you configure to match your plant's loss taxonomy.
Automatic loss Pareto chart and 13-week OEE trend. Both views update with every new data point so that improvement teams always have the current picture without manual chart updates.
Automated report generation at shift, daily, and weekly cadences. Reports are delivered via dashboard, email, or mobile notification depending on stakeholder preference.
Shift supervisor sees real-time OEE with live loss events. Plant manager sees weekly trends with cross-line comparison. Corporate sees consolidated OEE across plants.
One-click export to PDF, Excel, and PowerPoint. Automated email distribution schedules so that every stakeholder receives their OEE report at the right cadence without manual effort.
Frequently Asked Questions About the OEE Report Template
What data sources does the OEE template connect to?
The template connects to your MES or SCADA system for real-time production counts, cycle times, and downtime events; your CMMS for planned maintenance downtime and work order data; and your ERP for production schedules and order information. iFactory's pre-built connectors handle all major MES, SCADA, CMMS, and ERP platforms. If your system is not on the supported list, a custom connector can be built in 2-3 business days.
How does the template handle the six big losses classification?
The template uses a configurable rule engine to classify every downtime event, speed loss, and quality defect into one of the six big loss categories. You define the rules based on your plant's loss taxonomy — for example, any downtime event lasting more than 5 minutes with a maintenance work order is classified as a breakdown, while events under 5 minutes with a material-related cause code are classified as idling and minor stops. The classification is applied automatically and consistently across all shifts and lines.
Can the template handle OEE calculation for multiple production lines?
Yes. The template is designed for multi-line environments from day one. Each line has its own OEE calculation, loss categorization, and trend view. The template also provides a plant-wide OEE rollup that aggregates across all lines, as well as cross-line benchmarking views that show which lines are performing best and which need improvement. There is no limit to the number of lines or production cells the template can support.
How does the template distinguish between shift, daily, and weekly reports?
The template uses a time-window configuration that defines shift boundaries, day boundaries, and week boundaries for your plant. Each report cadence applies a different time window and aggregation level. Shift reports show real-time data for the current shift with comparison to the previous shift. Daily reports aggregate the last 24 hours across all shifts. Weekly reports aggregate the last 7 days. All three views draw from the same underlying data so the numbers are always consistent.
How long does it take to deploy the OEE report template?
A basic deployment with one production line and two data source connections typically takes 3-5 business days. This includes connector configuration, OEE calculation validation, loss category rule setup, and user access configuration. A full deployment with multiple lines, all three cadences, role-based dashboards, and automated distribution is typically 10-15 business days. The biggest variable is the number of data sources and the complexity of the loss classification rules.
Is the OEE calculation compliant with industry standards?
Yes. The template uses the OEE calculation methodology defined by the OEE Industry Standard, which is the most widely adopted OEE standard in global manufacturing. The formula is OEE = Availability × Performance × Quality, where each factor is calculated using the standard definitions. The template's calculation engine has been validated against the OEE Industry Standard reference implementation and produces identical results when given the same input data.
Your OEE reports are ready to deploy.
Get the OEE Report Template — Live on Your Production Data
A 30-minute demo with an iFactory manufacturing analytics specialist. We'll connect the template to your MES or SCADA data, show you live OEE scorecards at shift, daily, and weekly cadences, and deliver a customized deployment roadmap for your plant.