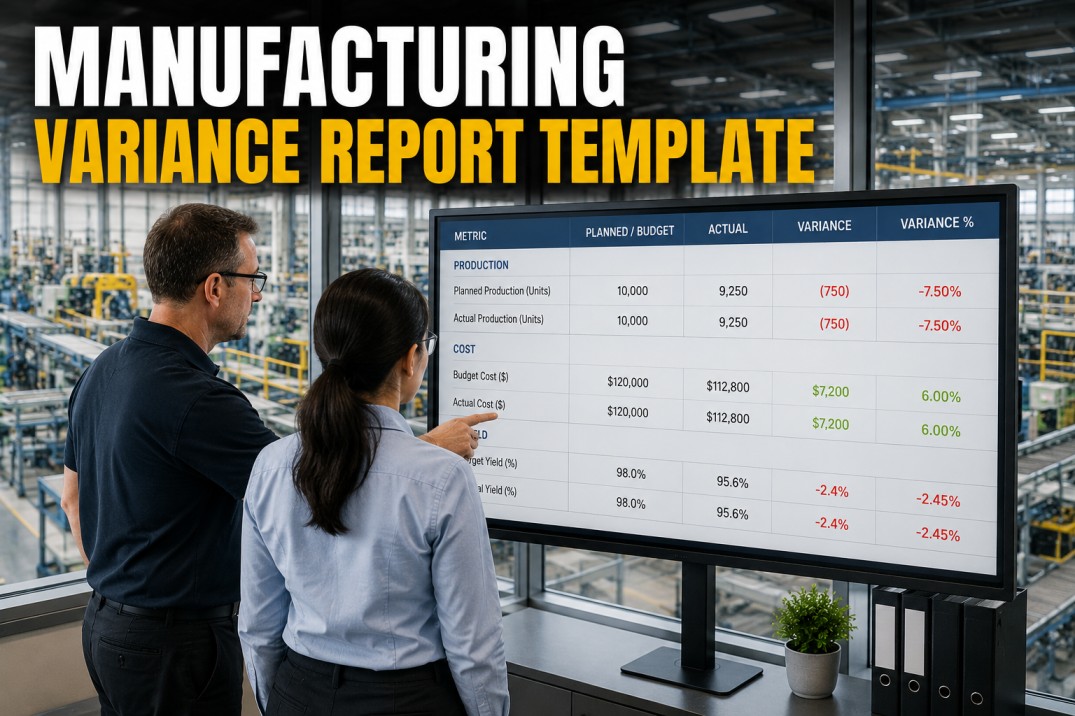
A manufacturing variance report compares actual production costs against standard or budgeted costs, breaking down each difference into actionable categories — volume, mix, price, and efficiency. Without a structured template, variance analysis becomes a reactive exercise: teams chase the biggest number rather than understanding the pattern behind it. This page provides a ready-to-use manufacturing variance report template with seven analytical structures you can adopt directly. Each section mirrors the approach iFactory uses when helping plants replace spreadsheet-based variance tracking with automated, drill-down reporting.
Variance Report Health Scoreboard
Before diving into individual variance lines, establish the overall picture. These four aggregate metrics tell you whether your variance reporting process is healthy — and where to focus your next analysis session. iFactory recommends tracking these at the start of every variance review meeting to set context before drilling into line-by-line detail.
Four Manufacturing Variance Categories
Standard manufacturing variance analysis decomposes the gap between budget and actual into four primary drivers. Every variance in the report falls into one (and sometimes a combination) of these categories. Understanding which category dominates tells you where to invest your cost-reduction effort. iFactory applies this framework automatically, tagging every variance line by driver on ingestion.
Line-by-Line Variance Analysis Table
The core of any variance report template is the line-by-line breakdown. Each production line or cost centre is listed with its budgeted cost, actual cost, variance in dollars and percentage, and a status indicator. This table is designed to be sorted by variance magnitude (largest first) so that the biggest deviations demand attention first. iFactory auto-generates this table from ERP and production data, eliminating manual cut-and-paste entirely.
| Production Line | Budget $ | Actual $ | Variance $ | Variance % | Status |
|---|---|---|---|---|---|
| Assembly A | 184,200 | 201,800 | +17,600 | +9.6% | Unfavorable |
| Assembly B | 156,000 | 148,200 | −7,800 | −5.0% | Favorable |
| Paint Shop | 92,100 | 101,300 | +9,200 | +10.0% | Unfavorable |
| Fabrication | 213,500 | 207,800 | −5,700 | −2.7% | Favorable |
| Packaging | 67,800 | 72,100 | +4,300 | +6.3% | Unfavorable |
| Welding | 128,400 | 119,800 | −8,600 | −6.7% | Favorable |
| Quality Lab | 45,600 | 48,900 | +3,300 | +7.2% | Unfavorable |
| Warehouse | 38,900 | 36,700 | −2,200 | −5.7% | Favorable |
Budget-to-Actual Variance Waterfall
The waterfall chart visualises how the standard cost evolves into the actual cost through each variance driver. Starting from the budgeted standard cost, each variance component either increases (unfavorable, red) or decreases (favorable, green) the cumulative total, arriving at the final actual cost. This view answers the question "How did we get here?" at a single glance.
Variance by Department
Rolling variance up to the department level reveals systemic patterns that individual line analysis may miss. If three different production lines all show unfavorable price variance, the root cause is likely procurement-related rather than line-specific. The department view below aggregates variance across cost centres, showing the net variance percentage and the proportion of lines that are over or under budget. iFactory applies this roll-up automatically, with one-click drill-down into the lines that comprise each department total.
Variance Threshold & Alert Reference
Not every variance demands action. Setting clear thresholds separates signals from noise and prevents teams from wasting time on statistically normal fluctuations. The table below defines five variance bands with corresponding alert levels, response actions, and escalation paths. iFactory allows each plant to configure these thresholds per cost centre and variance category, so procurement teams see different alerts than production teams for the same data.
| Threshold Band | Alert Level | Action Required | Escalation |
|---|---|---|---|
| < 2% variance | Normal | Monitor — no action required. Expected statistical variation. | None |
| 2–5% variance | Watch | Review driver category. Confirm if trend or one-off event. Log in variance register. | Shift supervisor notified |
| 5–10% variance | Warning | Root cause analysis initiated. Assign owner. Set target resolution date within 5 days. | Production manager notified |
| 10–20% variance | Critical | Formal corrective action plan required. Daily review until resolved. Cross-functional team assigned. | Plant manager notified |
| > 20% variance | Severe | Executive escalation. Business case review. Budget re-forecast triggered if sustained. | VP Operations + Finance notified |
Variance Investigation Action Checklist
A variance report is only valuable if it leads to action. Without a structured investigation process, the same variances appear month after month — reviewed but never resolved. The checklist below provides a standardised workflow for investigating and closing out variance items. Each action includes a recommended owner and target completion window. iFactory's platform tracks these actions directly from the variance report, sending reminders and escalating overdue items automatically.
Manufacturing Variance Report FAQ
What is a manufacturing variance report?
A manufacturing variance report compares actual production costs against standard or budgeted costs, breaking down each difference by driver — volume, mix, price, and efficiency. It answers the question "Why did we spend more or less than planned?" and provides the data needed to take corrective action. Unlike a simple budget vs actual report, a variance report categorises each deviation so teams can identify root causes rather than just tracking dollar amounts.
How often should a variance report be generated?
Most manufacturing plants run variance reports monthly, aligned with the financial close cycle. However, leading plants are moving to weekly variance snapshots for critical cost centres, especially when material prices are volatile or production volumes are fluctuating. Daily variance tracking is reserved for high-cost or high-variance lines where rapid response is needed. iFactory supports all three cadences simultaneously — monthly financial reports, weekly operational reviews, and daily alerts for threshold breaches.
What is the difference between favorable and unfavorable variance?
Favorable variance occurs when actual costs are lower than budgeted (cost savings) or actual revenue is higher than planned. Unfavorable variance means costs exceeded the budget or revenue fell short. However, context matters: a favorable material price variance might indicate good procurement, but it could also mean a cheaper material was substituted without formal approval — which might create downstream quality issues. Intelligent variance analysis always checks favorable variances for hidden risks rather than celebrating them immediately.
How do you calculate variance percentage?
Variance percentage is calculated as: ((Actual Cost − Budget Cost) / Budget Cost) × 100. A positive percentage indicates unfavorable variance (over budget), while a negative percentage is favorable (under budget). For volume and efficiency variances, the formula adjusts for the actual quantity produced versus the standard quantity. iFactory calculates all variance formulas automatically from the underlying ERP and production data, eliminating the common spreadsheet errors that plague manual variance reporting.
What is the best tool for manufacturing variance reporting?
Excel remains the most common tool for variance reporting, but it has significant limitations: manual data entry errors, broken formula links, no version control, and a lack of drill-down capability. Purpose-built manufacturing analytics platforms like iFactory automate variance calculation, provide real-time drill-down from aggregate to transaction level, maintain a governed KPI definition library, and generate variance reports on any cadence without manual effort. The most effective approach is often a phased migration: start with your top 10 variance lines in iFactory while keeping the rest in Excel, then expand as the team builds confidence in the automated reports.
Implement This Template
Stop Chasing Variance in Spreadsheets. Automate It.
You now have a complete manufacturing variance report template — four category definitions, a line-by-line analysis table, a waterfall visualisation, department roll-ups, threshold rules, and an investigation action checklist. The next step is automating these structures so your team spends time fixing variances instead of calculating them. iFactory connects directly to your ERP and production systems to generate variance reports in real time, with drill-down from aggregate plant performance to individual transaction data. Book a 30-minute personalised demo and we will build a sample variance report using your own data.