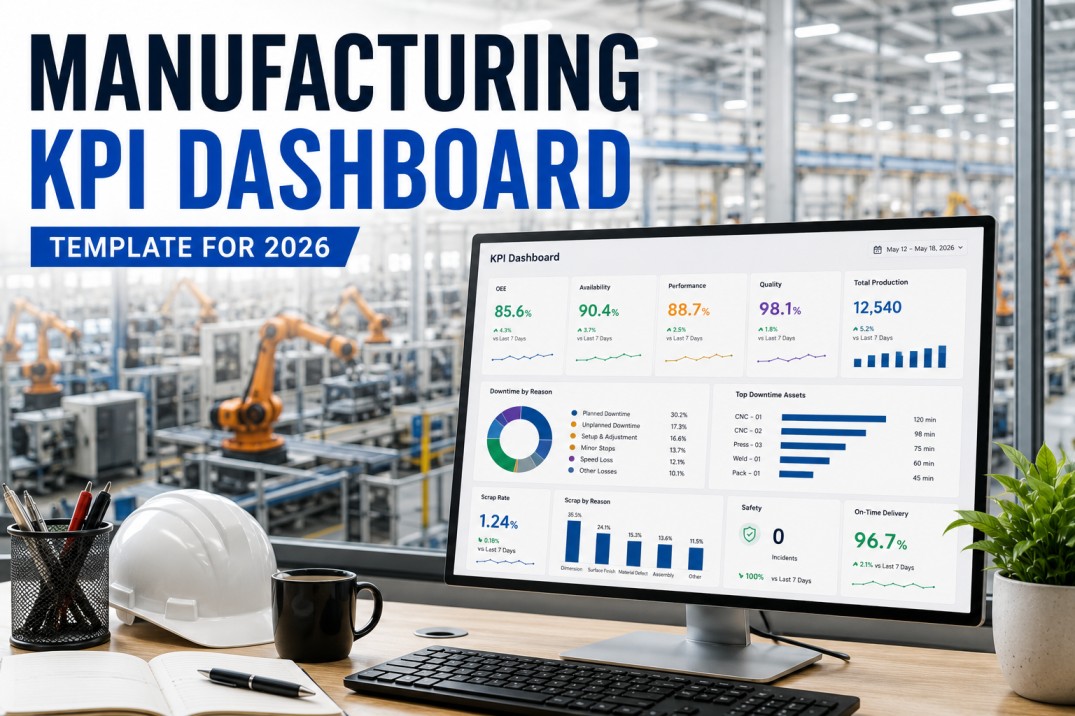
Manufacturing dashboard templates are not one-size-fits-all — an operator monitoring shift production needs a fundamentally different view than a COO tracking enterprise-wide OEE trends. Yet most analytics platforms deliver the same dashboard to every user, forcing each role to filter, pivot, and reinterpret the same data for their specific decision horizon. The fifteen manufacturing dashboard templates in this guide are organized by role and decision cadence, from real-time operator boards through strategic executive summaries. Every template ships pre-built in iFactory with role-specific KPIs, data sources, and visual layouts that match each user's natural workflow.
Fifteen Manufacturing Dashboards — One for Every Role
Get the complete library of 15 role-based manufacturing dashboard templates — pre-built and connected to your plant data. An iFactory analytics specialist will walk you through the full library and help you select the right dashboards for each role in your organization in a 30-minute live demo.
The 15 Dashboard Templates — Organized by Role
The template library covers four decision-making levels in the manufacturing organization. Each level has a different time horizon, data granularity, and set of KPIs. The tiered structure below shows how dashboards cascade from real-time operations to strategic enterprise management — every dashboard feeds the level above it.
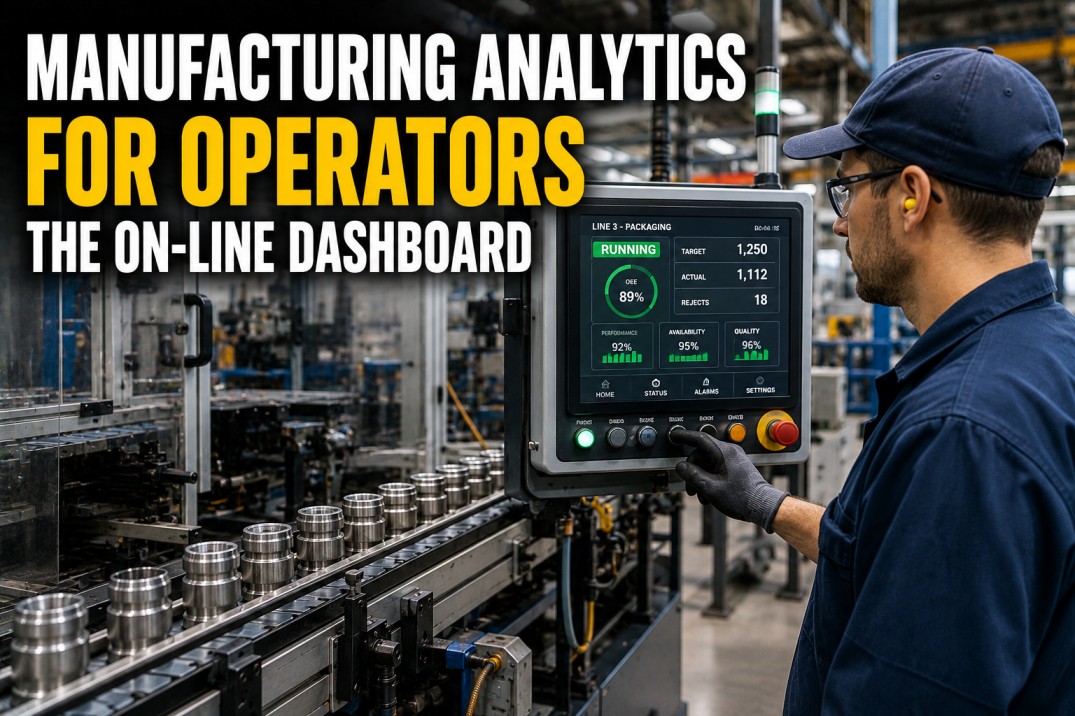
Real-time, machine-level views that operators use to monitor production, spot problems immediately, and stay on track for shift targets. Every dashboard updates in seconds and lives on the plant floor terminal.
Real-time OEE, production count vs target, downtime events, and current run status. The primary dashboard for every production operator.
Live status of every machine on the line: running, idle, stopped, or in changeover. Color-coded tiles with elapsed time in each state.
Defect rate, pass/fail by inspection point, spec limit violations, and immediate containment alerts. Every quality issue is visible within seconds.
Material consumption vs plan, waste tracking, and replenishment alerts. Helps operators avoid starving the line or over-consuming expensive materials.
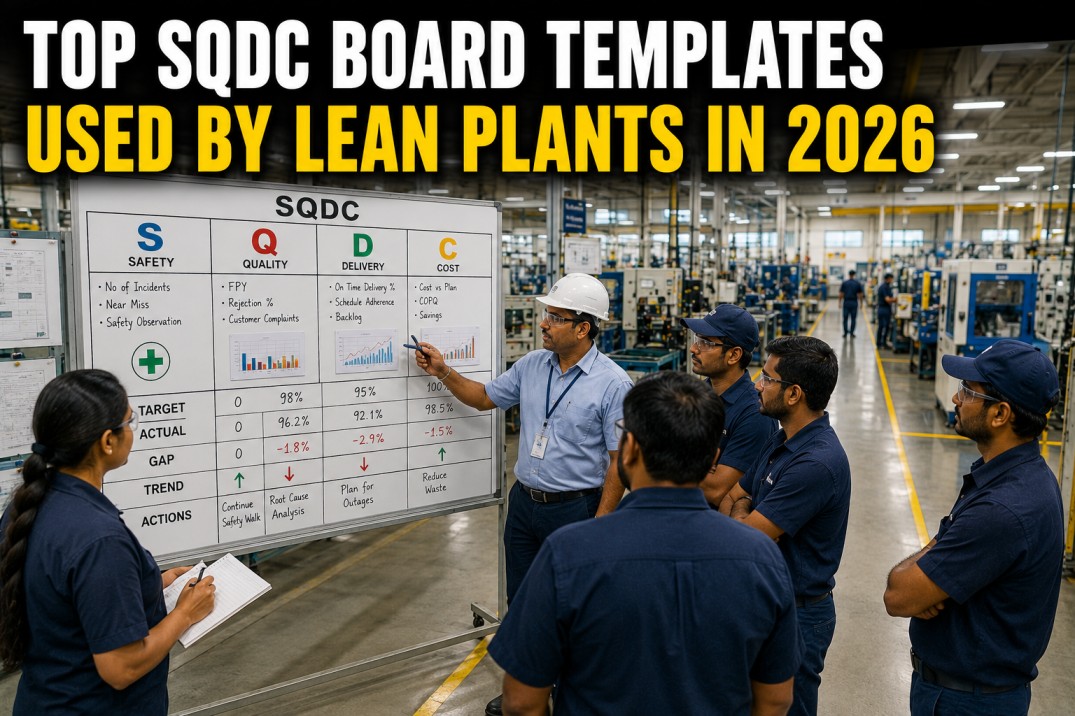
Shift-level summaries that production supervisors use during handoff meetings and daily stand-ups. These dashboards consolidate data across machines and lines within a single shift or day.
OEE by line, downtime Pareto for the shift, quality summary, and top loss events. The primary dashboard for shift handoff meetings.
Headcount vs plan, labor utilization by line, overtime tracking, and efficiency by team. Used to adjust crewing decisions mid-shift.
Open work orders, pending PMs completed in the shift, asset alerts generated, and equipment handed off with known issues.
Yield trends for the day, defect Pareto by cause code, containment actions in progress, and first-pass yield by product.
Cross-line, cross-shift views that plant managers use in weekly operations reviews. These dashboards aggregate shift-level data into weekly and monthly trends, enabling comparison across lines and identification of systemic issues.
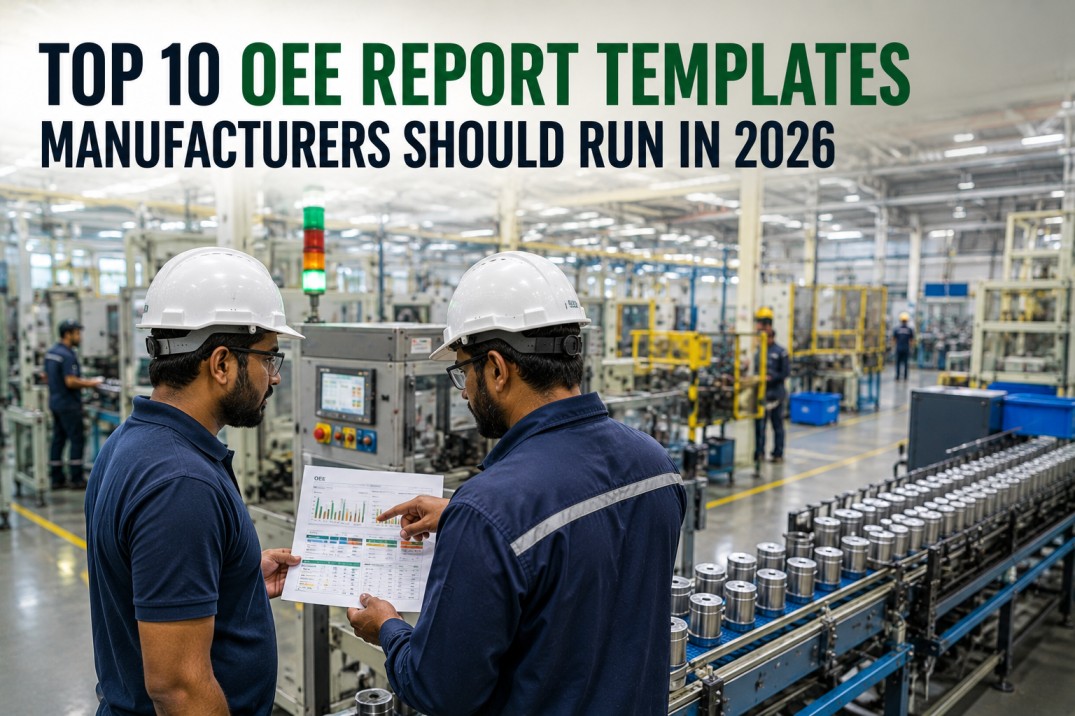
OEE trend across all lines, factor breakdown (A × P × Q), loss Pareto, and comparison to target. The primary dashboard for weekly plant reviews.
Plan attainment by line and product, variance waterfall, schedule adherence, and forward-looking risk assessment for the coming week.
MTBF and MTTR trends by asset class, PM compliance calendar, backlog aging, and top failure modes. Links maintenance performance to production impact.
Production cost per unit, scrap and rework costs, energy intensity, and waste disposal costs. Connects operational performance to financial outcomes.
All 15 Dashboards — Pre-Built and Role-Ready
iFactory Ships the Complete Manufacturing Dashboard Library for Every Role
Fifteen role-specific dashboard templates with live data connectors, role-based access control, and automated report distribution. A 30-minute demo walks you through the full library and shows you the dashboards that match each role in your plant.
Enterprise-level dashboards that executives use for monthly business reviews, board reporting, and strategic decision-making. These dashboards aggregate data across plants, business units, and time periods.
Multi-plant OEE comparison, production vs target by site, top operational issues, and cross-plant benchmarking. The single dashboard for enterprise operations reviews.
Inventory turns by plant, supplier on-time delivery performance, fill rates, and raw material availability risk. Links plant performance to supply chain health.
Revenue per employee, operating margin, OEE trend, sustainability metrics (energy, water, waste), and year-over-year improvement trajectory. The board-ready dashboard.
Dashboard Template Quick Reference — Role × Domain Matrix
The matrix below shows which manufacturing domains each dashboard template covers. Use this reference to identify gaps in your current dashboard deployment. A green dot means the template has dedicated views and KPIs for that domain. A hollow dot means the domain is visible in supporting charts but is not the primary focus.
| # | Dashboard Template | Production | Maintenance | Quality | Inventory | Labor | Cost |
|---|---|---|---|---|---|---|---|
| 1 | Shift Production Dashboard | ||||||
| 2 | Machine Status Board | ||||||
| 3 | Quality At-a-Glance | ||||||
| 4 | Material Usage Tracker | ||||||
| 5 | Shift Production Summary | ||||||
| 6 | Labor & Productivity Board | ||||||
| 7 | Maintenance Shift Handoff | ||||||
| 8 | Daily Quality Dashboard | ||||||
| 9 | Plant OEE Scorecard | ||||||
| 10 | Production vs Plan Dashboard | ||||||
| 11 | Maintenance KPI Dashboard | ||||||
| 12 | Cost & Waste Dashboard | ||||||
| 13 | Enterprise Operations Dashboard | ||||||
| 14 | Supply Chain Dashboard | ||||||
| 15 | Strategic KPI Scorecard |
What the Dashboard Template Library Includes
The full dashboard template library ships with everything needed to deploy role-specific dashboards across your entire manufacturing organization. Each template is pre-configured with the correct data sources, KPIs, visual layouts, and access permissions for its target role.
Fifteen ready-to-deploy dashboard templates covering every manufacturing role from operator to COO. Each template has the correct KPIs, data sources, and visual layout for its audience.
Each template is locked to its target role out of the box. Operators see only operator dashboards. Plant managers see only plant manager views. No configuration required.
Every template connects to your existing plant data sources — MES, SCADA, CMMS, ERP, and quality systems. Data flows in automatically without manual exports.
The library supports multi-plant deployments. Each plant gets its own set of role-based dashboards. Corporate users see consolidated views across all plants.
Every template can be customized to match your plant's specific KPIs, loss taxonomy, and reporting hierarchy. iFactory's drag-and-drop builder makes changes easy.
Every dashboard supports one-click export to PDF, Excel, and PowerPoint. Automated distribution ensures each role receives their dashboard at the right cadence.
Frequently Asked Questions About Manufacturing Dashboard Templates by Role
How do you decide which dashboard goes to which role?
Dashboard templates are assigned to roles based on decision horizon, data granularity, and accountability scope. An operator needs real-time data at the machine level because their decisions affect the next few minutes of production. A plant manager needs aggregated weekly data across all lines because their decisions affect next month's performance. A COO needs monthly enterprise-wide trends because their decisions affect the next quarter's business results. The iFactory template library follows this three-tier decision framework, with each template's data refresh rate, aggregation level, and KPI set matched to its role's natural decision cadence.
Can the same dashboard template be used at multiple plants?
Yes. All 15 dashboard templates are designed for multi-plant deployment. Each plant receives the same template but with its own data context — the shift production dashboard at Plant A shows Plant A's data, and the same template at Plant B shows Plant B's data. Corporate users can view a single dashboard that consolidates data from all plants using the same template layout, enabling apples-to-apples comparison across sites.
How long does it take to deploy the full template library?
A full deployment of all 15 templates across a single plant with connected data sources typically takes 3-4 weeks. This includes connector configuration, template customization for your specific KPIs, role-based access setup, and user training. A phased deployment — starting with operator and supervisor dashboards in week one, then plant manager dashboards in week two, and executive dashboards in week three — is the most common approach and delivers value from day one.
Can we customize the templates for our plant-specific KPIs?
Absolutely. Every template in the library is fully customizable. You can add plant-specific KPIs, modify the visual layout, change the data refresh rate, adjust the loss taxonomy, and create custom views for roles that exist in your organization but are not covered by the standard library. The iFactory platform includes a drag-and-drop dashboard builder that enables customization without developer support. All customizations are preserved when the template is updated by iFactory.
What data sources are required to use the templates?
The minimum data source requirement varies by template. Operator and supervisor dashboards need real-time or near-real-time data from your MES or SCADA system. Plant manager and executive dashboards need access to your CMMS, ERP, and quality systems. Each template in the library lists its required data sources in the template description. iFactory's pre-built connectors support all major MES, SCADA, CMMS, and ERP platforms — if your system is not supported, a custom connector can be built in 2-3 business days.
Do the templates work for both discrete and process manufacturing?
Yes. The 15 dashboard templates are designed to work across both discrete and process manufacturing environments. Operator dashboards can show machine states for assembly lines or process parameters for chemical plants. Plant manager dashboards can track OEE for discrete lines or overall equipment effectiveness for continuous processes. The KPI definitions and data connectors are configurable for your manufacturing type. iFactory has reference deployments in automotive, electronics, food and beverage, pharmaceuticals, chemicals, and metals manufacturing.
Your role-based dashboard library is ready.
Get the Full Library of 15 Manufacturing Dashboard Templates
A 30-minute demo with an iFactory manufacturing analytics specialist. We'll walk you through all 15 templates, select the right dashboards for each role in your organization, and show you live dashboards connected to your plant data.