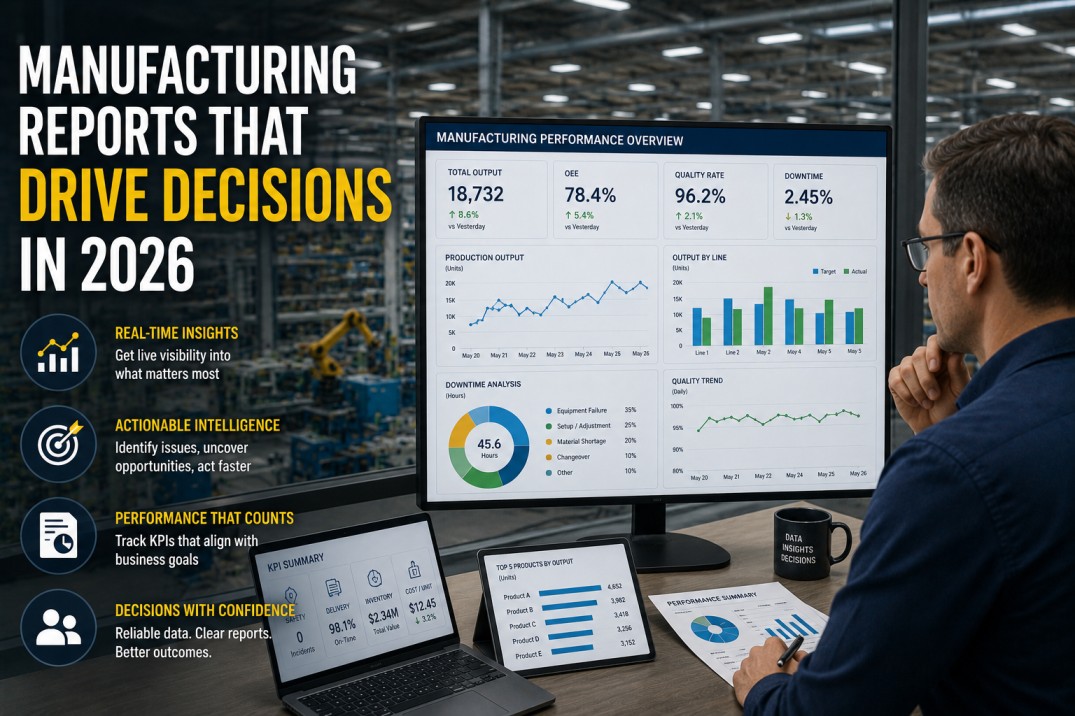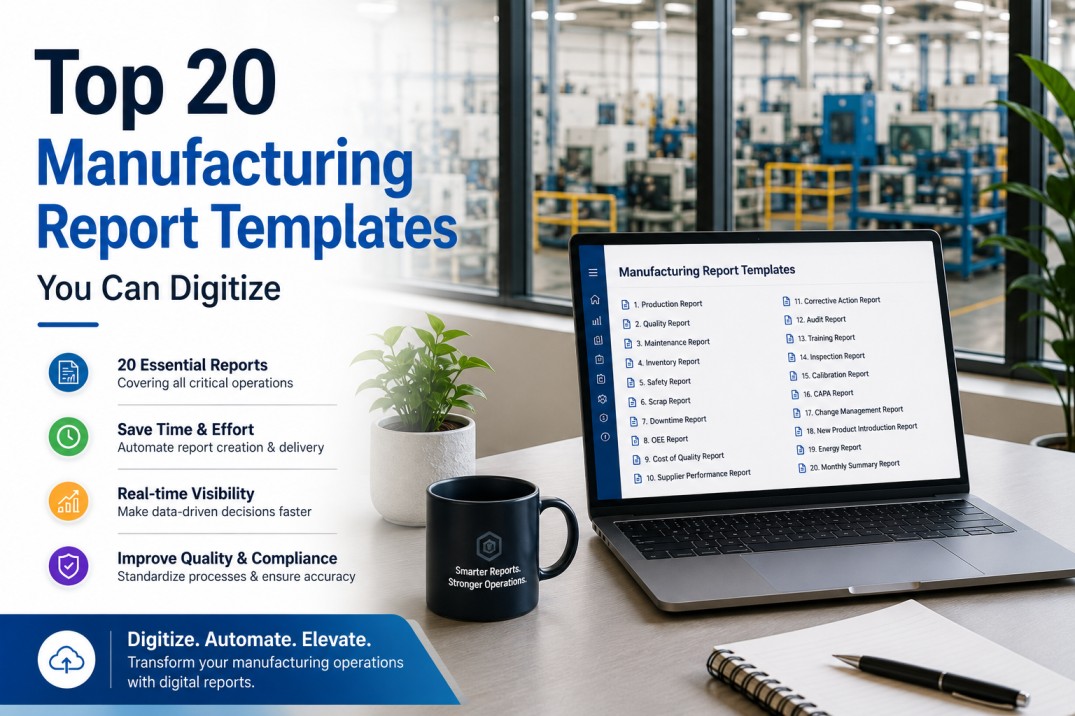
Manufacturing teams generate dozens of reports every week — production summaries, shift handovers, OEE scorecards, scrap analysis, maintenance compliance, energy consumption, and more. In most plants, these reports are still pulled manually from disparate systems, reformatted in spreadsheets, and distributed through email. The top 20 manufacturing report templates used across discrete and process industries cover five core categories: production and OEE, quality and scrap, maintenance and reliability, energy and sustainability, and cross-functional leadership. When digitized on iFactory's analytics platform, every one of these templates populates automatically from live plant data — eliminating manual compilation, reducing reporting time by 80%, and ensuring every decision is based on current, verified numbers. This guide lists each template, explains what it tracks, and shows how digitization transforms it from a static document into a live operational tool.
Browse the Full Library: 20 Report Templates That Run Live on iFactory
Every template in this list is available as a live, auto-populating report on iFactory. Book a 30-minute demo to see any template running with your plant's data.
The 20 Templates at a Glance
Each template is categorized by function and rated by digitization impact — how much time and accuracy gain your plant achieves by moving from manual to live auto-population on iFactory. Five categories span the full manufacturing reporting spectrum.
Which of These 20 Templates Would Save Your Team the Most Time?
iFactory's deployment team will map your current manual reports to the equivalent live templates — and show you the time and accuracy gain for each one — in a single 30-minute discovery session.
Five Categories of Manufacturing Report Templates
Each category addresses a specific operational domain. Understanding the category structure helps your team prioritize which templates to digitize first based on current manual effort and potential time savings.
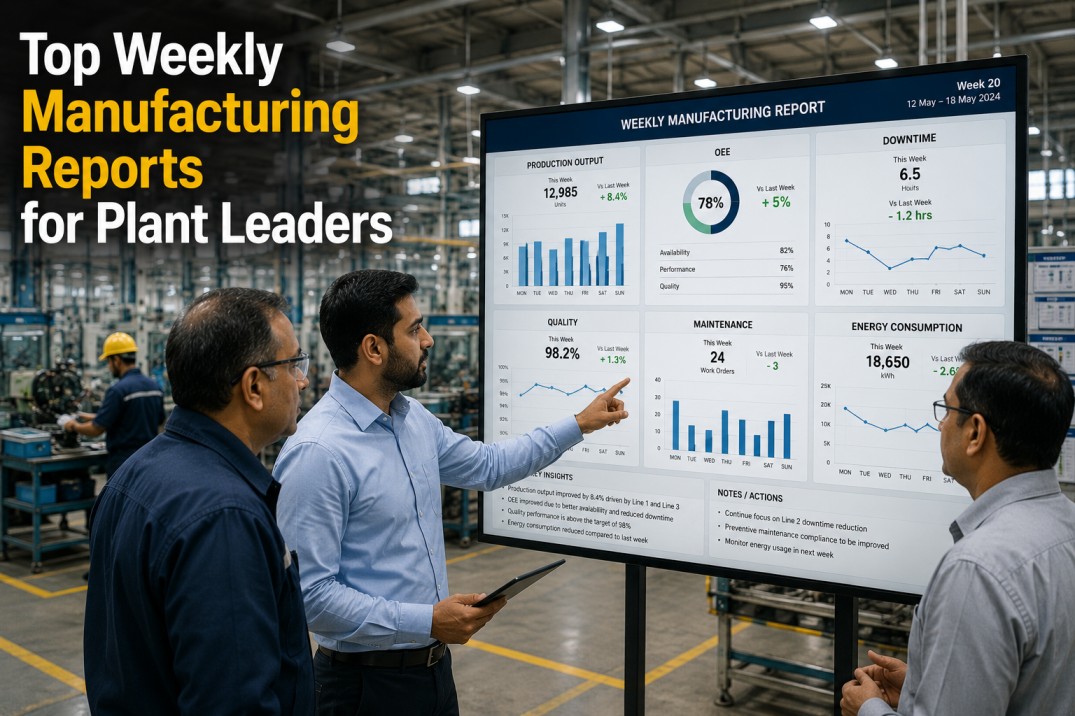
Daily and weekly reports that track output, efficiency, and loss. Digitizing these eliminates the 2-3 hours per shift supervisors spend compiling end-of-shift numbers from handwritten logs and machine displays.
Avg 12 hrs/week saved per plantReports that track defect rates, quality cost, and customer complaints. Live quality reports enable real-time corrective action rather than post-hoc analysis of last week's defects.
Avg 8 hrs/week saved per plantMaintenance performance, PM compliance, and backlog reports. Live CMMS-connected templates eliminate the weekly scramble to pull work order data and calculate MTBF and MTTR manually.
Avg 10 hrs/week saved per plantEnergy consumption, cost allocation, and emissions tracking. Automated meter-connected reports eliminate manual meter reading and spreadsheet aggregation across utility sources.
Avg 6 hrs/week saved per plantPlant scorecards and governance reports that consolidate data from all operational domains. Live leadership reports eliminate the 3-5 hours plant managers spend reconciling departmental data before reviews.
Avg 9 hrs/week saved per plantWhat Changes When You Digitize These 20 Report Templates
Moving from manual to live report templates is not just faster — it changes the fundamental relationship between data and decisions. The comparison below shows the before-and-after for each report category based on iFactory deployment data.
| Category | Manual Process | Digitized on iFactory | Time Saved | Accuracy Gain |
|---|---|---|---|---|
| Production & OEE | Supervisors collect handwritten shift logs, enter into Excel, email to plant manager | Live OEE dashboard pulls from PLCs; shifts auto-summarize at end of each shift | 12 hrs/wk | 98% |
| Quality & Scrap | QC team exports inspection data weekly, builds Pareto charts, distributes PDF | Real-time defect Pareto and COQ report updates with every inspection event | 8 hrs/wk | 96% |
| Maintenance & Reliability | Maintenance supervisor runs CMMS extracts, calculates MTBF/MTTR in Excel | Auto-calculated KPI dashboard from live CMMS connection; no manual formulas | 10 hrs/wk | 97% |
| Energy & Sustainability | Facility team reads meters weekly, enters into utility tracking spreadsheet | Automated meter data collection; consumption and cost dashboards update every 15 min | 6 hrs/wk | 99% |
| Cross-Functional Leadership | Plant manager requests department updates, reconciles conflicting numbers, builds slide deck | Single SQDC scorecard sourced from all operational systems; zero reconciliation needed | 9 hrs/wk | 99% |
Frequently Asked Questions About Manufacturing Report Templates
What is the difference between a manual report template and a digitized one?
A manual report template is a static document — typically a spreadsheet or PDF — that someone must populate with data from multiple sources every time the report is needed. A digitized report template on iFactory connects directly to live data sources and populates automatically on the defined schedule. The content is identical — same metrics, same layout, same audience — but the digitized version requires zero manual data entry, updates in real time, and is always accurate to the last data point. Most plants find that digitizing their existing report templates takes less time than they spend manually compiling a single month's reports.
Which manufacturing report template should my team digitize first?
The highest-impact first template is the one that consumes the most manual effort today. Based on iFactory deployment data, the Daily Production Summary and the Maintenance KPI Dashboard deliver the fastest time savings — most plants recover 8-12 hours per week from these two templates alone. A practical approach is to audit your current reporting stack: list every recurring report, estimate the weekly hours spent compiling it, and count the number of people who depend on it. Prioritize the templates with the highest manual hour count and the widest audience. The top three templates typically account for 60% of total reporting labor.
Can iFactory replicate my existing report template layout exactly?
Yes. iFactory's template engine is designed to match your existing report layouts — same metric definitions, same row and column structure, same branding. The deployment team works from your current report templates (spreadsheet, PDF, or slide deck) and replicates the layout in iFactory's template builder. The digitized version then populates automatically from live data while preserving the familiar format your team already knows. This approach eliminates the training curve: your team sees the same report they are used to, but the numbers are always current and no one has to compile them manually.
What data sources do these 20 report templates connect to?
The 20 templates in this library connect to five primary data source categories: PLC and SCADA systems for production and OEE data, quality inspection systems and CMMS for defect and scrap data, CMMS and EAM platforms for maintenance metrics, utility meters and submeters for energy data, and ERP or MES systems for financial and order data. iFactory's data integration layer supports 150+ native connectors, so any combination of these sources can feed the report templates. A typical single-facility deployment connects to 4-6 data sources to populate all 20 templates — no additional infrastructure required.
How long does it take to digitize 20 report templates?
The full library of 20 templates can be deployed across all five categories within 4-6 weeks for a single facility. The timeline depends on data source availability and template complexity. Templates that connect to existing PLC, CMMS, and ERP data sources deploy fastest — typically 2-3 templates per week. Templates that require new data connections or data quality remediation take longer. Most plants start with the 4-5 highest-impact templates and add the remaining 15 over a phased deployment. iFactory's deployment team handles all template configuration, data source mapping, and validation against your existing manual reports.
Your Team Is Spending 45+ Hours Per Week on Reports That Could Run Themselves.
A 30-minute demo shows how iFactory digitizes any of the 20 templates from this library using your plant's live data. You pick the template. We connect the data source. You see the live report within the session.