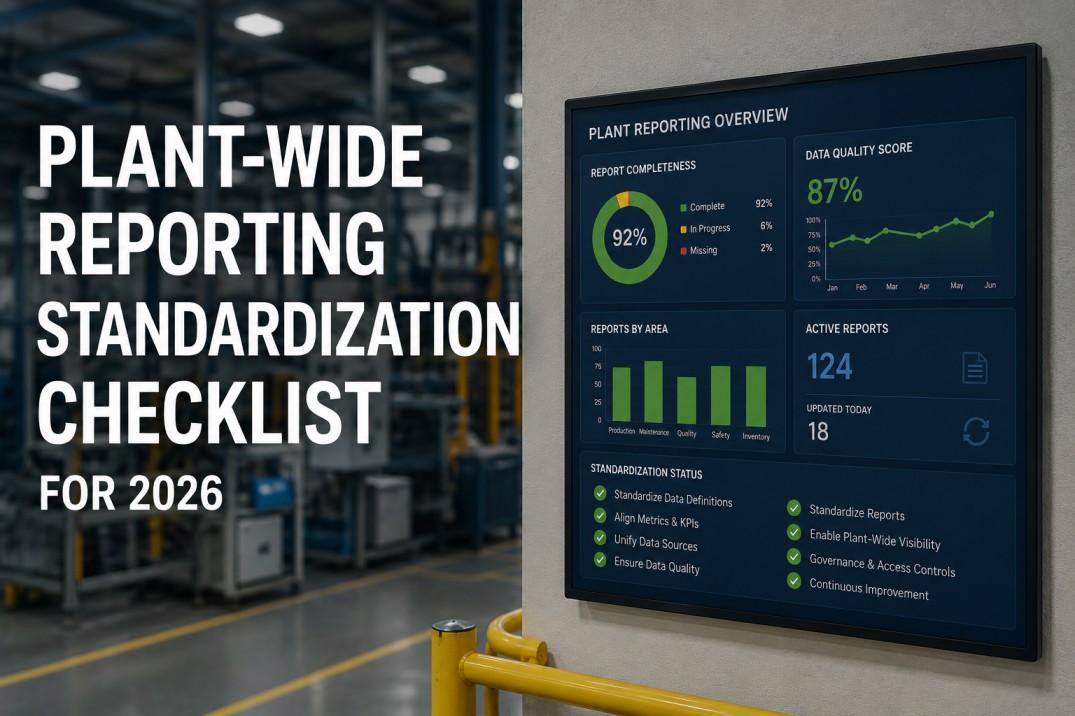
Plant-wide reporting standardization is the single highest-leverage initiative a multi-plant manufacturer can undertake in 2026. When every site reports OEE, downtime, and quality using the same KPI definitions, data sources, and visualization standards, the enterprise analytics team can finally compare performance across locations, aggregate metrics for leadership dashboards, and deploy reports once instead of rebuilding them N times. This checklist covers the seven dimensions of a complete plant-wide reporting standardization program — from KPI harmonization through governance and rollout.
Your Plants Are Probably Not as Standardized as You Think
Get a 30-minute reporting standardization assessment. An iFactory analytics specialist will audit your current multi-plant reporting landscape, identify KPI definition gaps, and show you how global enterprises enforce consistency across sites using iFactory's centralized reporting platform.
How Standardized Is Multi-Plant Reporting Today?
Most manufacturing enterprises operate with fragmented reporting standards. A 2025 industry survey revealed that the average manufacturer with three or more plants operates with fewer than four out of ten core production KPIs defined identically across sites. The result is a reporting environment where corporate dashboards are built on inconsistent data and plant-level comparisons are misleading at best.
Plant-Level Standardization Maturity Checklist
Before standardizing reports, assess where each of your plants currently stands. The four profiles below represent the typical range of reporting maturity found in multi-plant manufacturing organizations. Identify which profile fits each of your sites to prioritize the standardization roadmap.
Each KPI is defined locally. Spreadsheet-based reporting with no connection to corporate analytics. Plant manager owns reporting and changes definitions at will.
Some KPIs follow corporate guidelines but local teams override definitions for "plant-specific" reasons. Data flows to a central warehouse but reports are still built per-site.
All KPIs follow global definitions. Reports use corporate-approved templates and data sources. Plant managers can view their peers' dashboards with confidence in the numbers.
Real-time standardized dashboards with automated anomaly detection. Reporting standards are enforced at the data layer, not the presentation layer. New plants onboard in days, not months.
KPI Definition Harmonization Checklist
The most common roadblock in multi-plant reporting is not data availability — it is definition inconsistency. The same KPI name often means different things in different plants. This table shows the typical variation found across sites and the global standard that every plant should adopt.
| KPI | Plant A Definition | Plant B Definition | Plant C Definition | Global Standard |
|---|---|---|---|---|
| OEE | A × P × Q (actual output / planned) | A × P × Q (actual run time / planned) | A only (availability × quality) | A × P × Q — planned vs actual |
| Planned Downtime | Includes changeovers & PM | PM only; changeovers tracked separately | All non-production time | PM + changeovers only |
| First Pass Yield | Units passing first inspection / total units | Units without rework / total units | Good units / total started | Units without rework / total started |
| MTBF | Total runtime / number of failures | Total calendar time / failures | Runtime excluding PM / failures | Total runtime / number of failures |
| Changeover Time | Last good piece to first good piece | Stop to start of production | Scheduled changeover duration | Last good piece to first good piece |
| Schedule Attainment | Actual units / scheduled units | Actual hours / scheduled hours | Orders completed on time / total orders | Actual units produced / scheduled units |
| Scrap Rate | Scrap weight / total weight processed | Scrap units / total units produced | Material variance / expected material | Scrap units / total units produced × 100 |
Standardization Readiness Audit Checklist
Use this audit to evaluate each plant's readiness for reporting standardization. For each item, mark the compliance level based on your current state. A plant with fewer than six items in Compliant status needs significant standardization work before it can participate in enterprise-level reporting.
Reporting Governance Responsibility Matrix
Standardization requires clear ownership. Without a defined governance structure, definition drift is inevitable — plant teams will revert to local conventions within months of a standardization initiative. The matrix below assigns responsibilities for each dimension of reporting standardization.
| Domain | Defines Standard | Approves Changes | Implements | Audits Compliance |
|---|---|---|---|---|
| KPI Definitions | Corporate Analytics | Data Governance Council | Plant Data Leads | Corporate Analytics |
| Data Sources & Schemas | Enterprise Data Engineering | Data Governance Council | Plant IT / OT | Enterprise Data Engineering |
| Report Templates & Visuals | Corporate Analytics | Corporate Analytics | Report Developers | Corporate Analytics |
| Data Quality Rules | Enterprise Data Engineering | Data Governance Council | Plant Data Leads | Enterprise Data Engineering |
| Access & Security Policies | IT Security | IT Security + Legal | Plant IT / OT | IT Security |
| Change Management | Corporate PMO | Steering Committee | Plant Managers | Corporate PMO |
Built for Multi-Plant Standardization
iFactory Enforces Reporting Consistency Across Every Site
Centralized KPI library, template-based report deployment, automated data validation, and cross-plant benchmark dashboards — all in a single platform. New plants connect in hours and immediately inherit your global reporting standards.
Standardization Gap Analysis Scorecard
For each of the four key dimensions of reporting standardization, assess your current state against the target. The gap score helps you prioritize which dimension delivers the most value from standardization investment.
Standardization Rollout Plan — 4 Phases
A phased rollout ensures that each plant reaches reporting standardization without disrupting ongoing production. The four-phase plan below is designed for an organization with 3–10 plants and can be compressed or extended based on the current maturity of your sites.
- Audit KPI definitions across all plants
- Document data source landscape per site
- Identify definition conflicts and gaps
- Establish data governance council charter
- Publish global KPI definition standard v1.0
- Migrate plant data to centralized schema
- Rebuild KPI calculations per global standard
- Deploy standardized report templates
- Configure data validation rules
- Train plant data leads on new standards
- Launch cross-plant benchmark dashboards
- Establish bi-weekly governance reviews
- Implement automated anomaly detection
- Track compliance scores per plant
- Iterate KPI definitions based on feedback
- Package templates for one-click plant onboarding
- Automate compliance auditing with alerts
- Expand standardized reporting to new sites
- Integrate with supply chain and financial reporting
- Annual KPI governance council review
Frequently Asked Questions About Plant-Wide Reporting Standardization
Why is reporting standardization harder than most manufacturers expect?
Most manufacturers underestimate the degree of KPI definition drift across their plants. Two plants reporting the same KPI name — OEE, for example — may calculate it using different formulas, data sources, time windows, and exclusion rules. Fixing this requires not just technical work (data integration, report template changes) but organizational change management: plant teams must agree to give up local definition flexibility for enterprise consistency. The human dimension is typically the harder half of the problem.
How long does it take to standardize reporting across 5–10 plants?
A structured four-phase rollout typically takes 16–20 weeks for an organization with 5–10 plants, assuming each plant has basic data infrastructure (sensors, CMMS, ERP) in place. Plants that lack digital infrastructure will require additional time for data source readiness. The timeline depends heavily on organizational readiness — the biggest variable is how quickly plant managers adopt the new standards rather than how long the technical integration takes.
What is the single most impactful step toward reporting standardization?
Publishing a global KPI definition document and enforcing it through the reporting platform — not through policy alone. When the reporting system itself prevents a plant from using a non-standard KPI definition, standardization becomes automatic. This is the difference between a "standardization initiative" that fades after six months and a genuinely standardized reporting environment that persists across leadership changes and plant acquisitions.
How do we handle plant-specific KPIs that do not apply to other sites?
Plant-specific KPIs should be treated as an extension layer on top of the global standard — not as replacements for it. Each plant can maintain a set of local KPIs that are visible only within that site, while the core 10–15 enterprise KPIs are locked at the global level. The reporting platform should support this layered model: a global KPI library that every plant inherits, with an optional local overlay that cannot override global definitions.
What is the ROI of reporting standardization?
Manufacturing enterprises that complete a full reporting standardization program typically report: 60–80% reduction in the time required to produce consolidated enterprise reports, 40–50% decrease in data reconciliation effort (teams no longer arguing about whose numbers are right), 25–35% improvement in cross-plant OEE through benchmarking and best practice sharing, and 70% faster onboarding of new plants into the enterprise reporting framework. The payback period is typically 6–9 months from program start.
Should we standardize reports or standardize the data layer first?
Standardize the data layer first. If two plants calculate OEE differently at the source, forcing them to use the same report template will produce misleading comparisons — the report will show the same KPI name with different underlying formulas. The correct sequence is: (1) agree on global KPI definitions, (2) align data source calculations to those definitions, (3) deploy standardized report templates on top of the unified data layer. Skipping step 2 is the most common reason standardization initiatives fail.
Your standardization roadmap is ready.
See iFactory's Multi-Plant Reporting Platform in Action
A 30-minute demo with a manufacturing analytics specialist. We'll audit your current multi-plant reporting landscape, show you how iFactory enforces global KPI standards, and deliver a customized standardization roadmap for your enterprise.