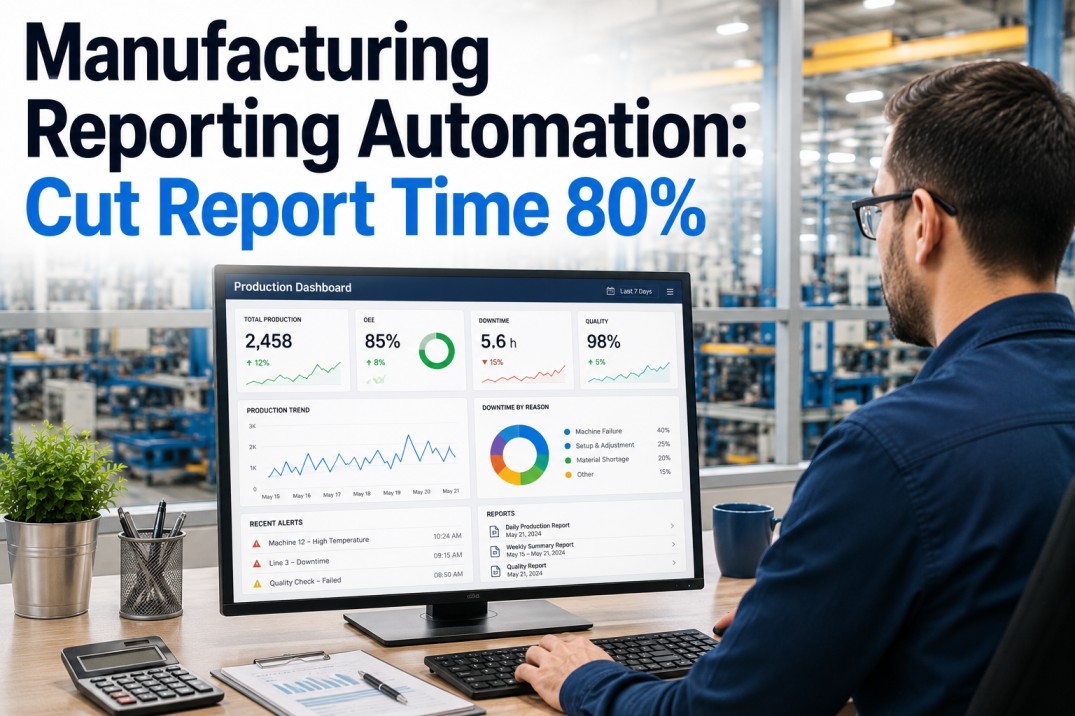
Manufacturing teams spend an estimated 30–40% of their week creating, formatting, and distributing reports instead of analyzing them. The data is already in your MES, ERP, and SCADA systems — but pulling it together into a coherent picture still means spreadsheets, email chains, and manual formatting. This guide breaks down exactly which reports to automate first, which ones should stay manual, and how to build a reporting operation that cuts time by 80% without sacrificing the context your team needs.
See Exactly How Much Time Your Team Can Save
Get a personalized 30-minute assessment of your current reporting workflow. We'll map your report inventory, identify the top 3 automation opportunities, and project the hours saved — using your actual plant data.
Manual Reporting Is Eating 12+ Hours per Person per Week
A typical plant manager, production supervisor, or quality engineer spends the equivalent of one full shift every week on reporting tasks that could be automated. The 2025 IndustryWeek manufacturing survey found that 68% of plant-floor data is still moved manually between systems. That manual handling introduces errors, delays decisions, and burns time that should go toward improvement work.
The gap is not a data problem — it is a pipeline problem. The data exists, the tools exist, but the connection between them is manual. Every spreadsheet copy-paste, every email attachment, every reformatted table is a cycle that automation can eliminate in full.
Where to Start: The Automation Priority Matrix
Not every report deserves automation. The key is to score each report on two dimensions: time consumed (how many hours per week it takes to produce) and decision impact (how much the business relies on getting it right and fast). Reports that score high on both are automation-ready. Those low on both should stay manual or be eliminated.
- Daily OEE reports
- Shift handoff summaries
- Scrap & rework dashboards
- Production vs. schedule variance
- Monthly cost variance
- Quarterly sustainability reports
- Annual capacity reviews
- Detailed downtime logs
- Raw data exports to stakeholders
- Shift-level consumable usage
- Duplicate weekly printouts
- Reports nobody discusses
- Manually recreated system screens
Which Manufacturing Reports Should You Automate First?
Based on deployment data from over 400 US manufacturing plants, the following five report categories deliver the fastest time-to-value when automated. Each entry shows the typical weekly time burden and the savings achievable with a reporting automation platform like iFactory.
Every shift change produces a status report. Manual OEE reports require pulling machine data, calculating availability/performance/quality, formatting for each audience, and emailing attachments. Automation pulls live from the MES, applies the OEE formula, and distributes role-specific views — operator wallboard, supervisor panel, manager digest — with zero manual steps.
SPC charts, defect Pareto analyses, and first-pass-yield reports are typically recreated each week from raw inspection data. Automating these eliminates transcription errors and gives the quality team a live view of defect trends instead of a weekly retrospective. Alerts can be triggered when defect rates cross control limits.
End-of-shift reports capture what happened, what broke, and what is still pending. These are nearly always typed into spreadsheets or emailed as free text. Automation captures machine state transitions, downtime codes, and operator notes from the line and assembles a structured handoff document that the next shift can read in under two minutes.
The weekly operations review deck — OEE, throughput, scrap, safety incidents, downtime — is often a Friday afternoon scramble of copy-pasting from multiple sources. Automation consolidates all KPIs into a single dashboard that updates continuously, freeing that Friday time for actually reviewing the numbers with the team.
Material usage variance, inventory reconciliation, and WIP tracking reports are typically run from the ERP and then reformatted for plant management consumption. Automation links the MES consumption events directly to the ERP inventory view, producing a reconciled material picture at any frequency without manual adjustments.
Built for the Plant Floor
iFactory Automates Your Top 10 Reports in Under 30 Days
Pre-built connectors for major MES and ERP platforms, role-based dashboard templates, and a library of 50+ manufacturing-specific report views. No custom code required.
What Manufacturing Reporting Looks Like Before and After Automation
The most dramatic change is not speed — it is who owns the report. In a manual environment, reporting is a dedicated task assigned to supervisors or analysts. After automation, the report produces itself and the team shifts from gathering to acting.
How to Roll Out Reporting Automation in 90 Days
The fastest path to automated reporting follows a phased approach. Each phase delivers measurable time savings within the first week, building momentum for the next stage.
Map your full report inventory — every recurring report, its data source, audience, frequency, and the time it takes to produce. Connect iFactory to your primary MES or ERP data source. This phase requires zero changes to existing workflows and produces the baseline for measuring savings.
Deploy the first three automated report views from the "Automate First" quadrant — typically daily OEE, shift handoff, and quality dashboards. These represent the highest time burden and deliver immediate visible savings to the operations team.
Add weekly KPI boards, material consumption views, and supervisor panels. Configure role-based access so operators see machine-level data, supervisors see line-level trends, and managers see plant-wide summaries — all from the same data pipeline without duplicate effort.
Configure threshold-based alerts (e.g., OEE drops below 75%, scrap rate exceeds target), scheduled PDF/email distribution for stakeholders who need offline copies, and self-service access so plant teams can explore data without requesting ad-hoc reports.
Add remaining report categories, integrate secondary data sources (CMMS, IIoT sensors, quality systems), and retire manual reporting processes. At this stage the reporting operation runs fully automated, and the team's focus shifts from producing reports to acting on insights.
Frequently Asked Questions About Manufacturing Reporting Automation
What types of manufacturing reports are best suited for automation?
Reports that are recurring (daily or weekly), use structured data from MES, ERP, or SCADA systems, and require the same calculations each time are the strongest candidates. Daily OEE reports, shift handoff summaries, quality dashboards, and weekly KPI board reports typically deliver the fastest ROI. Ad-hoc analytical reports that vary significantly in structure and audience are better left for manual or semi-automated approaches.
How long does it take to automate manufacturing reports?
With a purpose-built manufacturing reporting platform like iFactory, the first reports can be live within a week. Most plants go from manual to fully automated reporting in 8–12 weeks. The timeline depends on the number of data sources, report complexity, and how quickly the team adapts to the new workflow. Pre-built connectors and report templates reduce deployment time by 60% compared to building from scratch.
Will automation replace the need for analysts or supervisors?
No — automation shifts the role from report producer to data interpreter. The same people who spent 12+ hours per week gathering and formatting data now spend that time analyzing trends, investigating anomalies, and driving improvement initiatives. Plants that automate reporting typically see higher engagement from their supervisory teams because the work becomes more strategic and less clerical.
How do we handle reports that require context or narrative?
Automation handles the data layer — numbers, charts, tables, trends. Context and narrative are added by the team where needed. Many plants adopt a hybrid model: automated data delivery with manual commentary for shift notes, exception explanations, and forward-looking assessments. The key is that automation removes the 80% of report production that is purely mechanical, leaving only the 20% that requires human judgment.
What if our data sources are inconsistent or messy?
Data quality issues are common in multi-system environments. A good automation platform includes data validation, normalization, and reconciliation layers that clean and standardize incoming data before it reaches the report. Most manufacturing reporting automation projects uncover and resolve long-standing data inconsistencies as a side benefit — the reports become more accurate than the manual versions they replaced.
How do we maintain automated reports when systems change?
Purpose-built platforms (as opposed to custom-coded scripts) include connectors that automatically adapt to schema changes, version upgrades, and field renames in upstream systems. Maintenance overhead is typically under one hour per month for an entire plant reporting operation. This is a significant advantage over spreadsheet-based or custom-coded reporting, where a single system change can break dozens of reports.
Your reporting workflow is ready to upgrade.
Cut Report Time 80% — Starting Monday
iFactory connects to your existing MES and ERP in hours, not months. See a live demonstration using your plant's actual data and walk away with a prioritized automation roadmap for your team.






.jpg)
