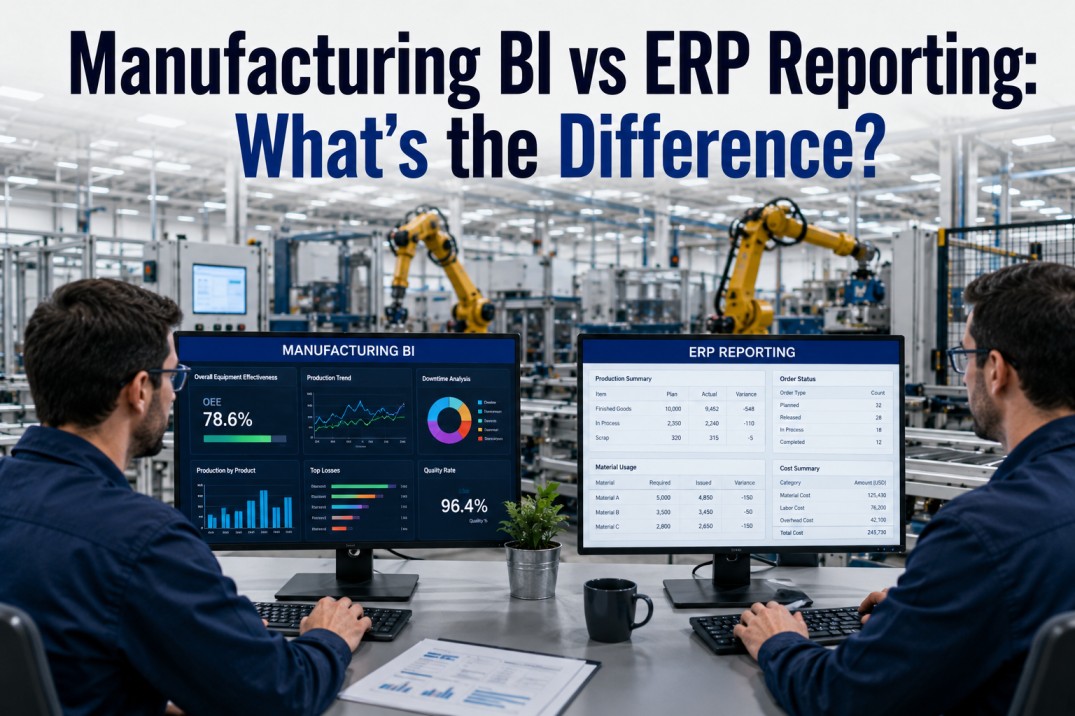
Manufacturing organisations rely on two distinct but overlapping reporting layers — ERP reporting for transactional accuracy and compliance, and BI reporting for cross-source analytics and decision support. The line between them is often misunderstood: ERP reports are not BI dashboards, and BI dashboards cannot replace ERP reports. Each serves a fundamentally different purpose, built on different data models, serving different users, and delivering different outcomes. This page breaks down the key differences between manufacturing BI and ERP reporting, when to use each, where ERP reporting falls short, and how integrated platforms like iFactory bridge both worlds for a single source of decision-ready truth.
Get Started
Connect Your ERP to Modern BI — Without Replacing Either
iFactory connects directly to your ERP system's transaction tables and CDS views, extracting data into a unified analytics platform alongside MES, SCADA, quality, and maintenance data. Users keep ERP for compliance and transactions, and gain BI dashboards for cross-source analytics — all without replacing the ERP or building custom integrations.
ERP Reporting vs BI Reporting: Three Approaches Compared
Manufacturing organisations typically approach reporting from one of three perspectives — pure ERP reporting, standalone BI, or an integrated ERP+BI architecture. Each approach serves a different primary purpose: ERP reporting prioritises transactional accuracy and operational compliance, BI prioritises cross-source analytics and visual exploration, and integrated approaches combine both for a single source of decision-ready truth. The three pillar cards below break down the defining characteristics of each approach.
ERP vs BI Reporting: Feature Comparison
The scrollable table below compares thirteen dimensions across ERP reporting and BI reporting in manufacturing. The green-highlighted cells indicate the approach that typically wins for each criterion. Neither approach is universally better — the right choice depends on whether the primary need is transactional accuracy (ERP wins) or cross-source analytical flexibility (BI wins). iFactory bridges both by connecting directly to ERP transaction tables while layering BI-grade dashboards on top.
| Criteria | ERP Reporting | BI Reporting |
|---|---|---|
| Primary purpose | Transactional record-keeping | ✓ Cross-source analytics & exploration |
| Data scope | Within ERP modules (FI, CO, PP, MM, SD) | ✓ Multiple sources (ERP, MES, SCADA, IoT, CMMS) |
| Update frequency | Batch (daily/monthly close) | ✓ Real-time / near-real-time / on-demand |
| Report structure | Fixed templates, parameter-driven | ✓ Ad-hoc, drag-and-drop, fully customisable |
| Data volume handling | Optimised for transactional rows | ✓ Optimised for analytical aggregation |
| Schema flexibility | Rigid — changes require IT projects | ✓ Flexible — business users add fields |
| Drill-down capability | Within module transactions | ✓ Cross-source hierarchical and sliced |
| User interface | Form-based, pre-defined layouts | ✓ Visual, interactive dashboards & charts |
| Self-service | Limited — IT/consultant dependent | ✓ Strong — business analyst friendly |
| Governance model | Centralised IT control | ✓ Distributed with shared stewardship |
| Mobile readiness | Limited / desktop-first | ✓ Responsive / mobile-first dashboards |
| Cost to modify | High — customisation projects | ✓ Low — configurable within hours |
| Deployment | On-premise / private cloud | ✓ Cloud / hybrid / edge |
Compare Approaches
Which Reporting Approach Fits Your Plant?
Not every plant needs the same reporting mix. A Tier 1 automotive plant with 50+ PLCs and a data science team will lean heavily on BI. A mid-size batch processor with SAP and a small IT team may rely primarily on ERP reports. iFactory helps you evaluate your current reporting maturity and design the right ERP+BI architecture for your specific operations.
ERP vs BI: Side-by-Side Reporting Architecture
The architecture diagram below contrasts the ERP reporting pipeline (left) with the BI reporting pipeline (right). ERP reporting draws directly from transactional modules through fixed report templates with limited visualisation capability. BI reporting ingests data from multiple sources — including ERP — into a central warehouse or lakehouse, enabling cross-source dashboards and ad-hoc exploration. The iFactory bridge connects both pipelines so users can drill from a BI dashboard directly into the underlying ERP transaction without switching tools.
When to Use ERP Reporting vs BI Reporting
Six common manufacturing scenarios mapped to the recommended reporting approach. ERP reporting is best when the primary need is transactional accuracy, compliance, and standardised operational reports. BI reporting wins when the need is cross-source analysis, visual exploration, and ad-hoc dashboard creation. Hybrid scenarios require both — and are where an integrated ERP+BI platform like iFactory delivers the most value.
Bridge the Gap
Stop Exporting to Excel — Connect ERP to BI Directly
The most expensive reporting workflow in manufacturing is "export from ERP, manipulate in Excel, present in PowerPoint." iFactory eliminates this by connecting ERP transaction data directly to BI dashboards — no exports, no manual data prep, no version-control nightmares. See it in action in a 30-minute demo.
How Manufacturing Data Flows from ERP to BI
The data journey from an ERP transaction to a BI dashboard involves four stages. Understanding this flow is essential for designing reporting architecture that preserves transactional accuracy while enabling cross-source analytics. Each stage has specific implications for latency, data quality, governance, and user access.
Where ERP Reporting Falls Short — and How BI Fills the Gap
ERP reporting systems are essential for transactional accuracy and compliance, but they have well-known limitations when used as the sole reporting layer for manufacturing analytics. The five gap cards below highlight specific areas where ERP reporting falls short — and how BI and integrated platforms like iFactory fill each gap with modern analytics capabilities.
Deploy Today
One Truth Across ERP and BI — With iFactory
Stop choosing between ERP compliance and BI flexibility. iFactory gives you both: ERP for transaction-level accuracy and audit trails, BI for cross-source dashboards and ad-hoc analytics. One platform, one data model, one source of truth. Start with a single plant and scale across your enterprise.
Frequently Asked Questions
What is the difference between ERP reporting and BI reporting in manufacturing?
ERP reporting refers to the standard reports generated by an ERP system (SAP, Microsoft Dynamics, IFS, Oracle) from its own transactional data — production orders, inventory movements, financial postings, purchase orders. These reports are pre-defined, IT-governed, and optimised for transactional accuracy and audit compliance. BI reporting refers to analytics performed on data extracted from multiple sources (including but not limited to ERP) and loaded into a separate data warehouse or lakehouse. BI reports are ad-hoc, visually interactive, and optimised for cross-source analysis and decision support. The key difference is scope: ERP reports are module-specific; BI reports are enterprise-wide.
Can BI replace ERP reporting entirely?
No. BI cannot replace ERP reporting because ERP reports serve a fundamentally different purpose — they provide the audit-trail, transaction-level detail, and compliance documentation that regulatory bodies and financial auditors require. BI is designed for analytical exploration and decision support, not for legal record-keeping. The best approach is an integrated one: ERP reports satisfy compliance and transaction-level needs, while BI provides the cross-source dashboards and analytics that ERP cannot. Platforms like iFactory connect both layers so users can move seamlessly from a BI dashboard to the underlying ERP transaction.
What manufacturing data should go through ERP vs BI?
Data that requires transaction-level audit trails, financial reconciliation, and regulatory compliance should remain in ERP (production orders, goods movements, invoices, purchase orders). Data that supports analytical decision-making across multiple sources should go through BI (OEE trends, quality SPC charts, energy consumption analysis, cross-plant benchmarks). Most data flows through both: transactional events originate in ERP, are extracted into the BI pipeline, and appear in dashboards alongside plant-floor data from MES, SCADA, and IoT systems.
How does iFactory connect ERP and BI reporting?
iFactory connects to ERP systems at the data layer — extracting transactional tables, CDS views, or ODP extracts into its analytics platform. It normalises ERP data alongside MES, SCADA, quality, maintenance, and energy data in a unified data model. Users access BI dashboards that combine all data sources and can drill through from any KPI to the underlying ERP transaction. iFactory does not replace the ERP — it connects to it, so both systems serve their optimal purpose.
How often should manufacturing data sync from ERP to BI?
The sync frequency depends on the use case. Real-time dashboards (production tracking, OEE, downtime alerts) need CDC (change data capture) or streaming ingestion every 1-15 minutes. Operational reports (daily production summaries, shift handovers) can sync hourly or at shift boundaries. Financial and compliance reports (month-end close, inventory valuation) typically sync daily or weekly. iFactory supports all three cadences — real-time CDC for operational analytics, batch for financial reporting — within a single pipeline.
What are the signs that your plant needs BI in addition to ERP?
The clearest signs are: (1) users are exporting ERP data to Excel for analysis — indicating the ERP cannot answer the questions they have; (2) report backlogs exceed two weeks because every new report requires IT involvement; (3) plant managers cannot get cross-source views (e.g., OEE + cost per unit + quality yield) without manual data merging; (4) operators need real-time dashboards on the plant floor that ERP dashboards cannot deliver; (5) the same KPI is calculated differently in different departments because there is no single source of analytical truth.
Start Today
From ERP Data to BI Dashboards — Without the IT Backlog
Whether your plant runs SAP, Dynamics 365, IFS, or Oracle — iFactory connects to your ERP data layer and delivers BI dashboards in days, not months. No more waiting for IT to build custom reports. No more exporting to Excel. No more duplicate KPI calculations across departments. Book a 30-minute demo to see it on your data.