OEE loss categorization is the foundation of effective overall equipment effectiveness tracking — yet most operators struggle to classify downtime, speed losses, and quality defects consistently across shifts. Without a structured OEE loss categorization checklist, plants end up with misclassified losses, unreliable OEE calculations, and improvement efforts aimed at the wrong targets. This checklist covers seven essential dimensions of OEE loss categorization — from scorecards and category references to detailed loss breakdowns, decision guides, and actionable implementation tasks — enabling operators to log losses correctly and iFactory to automate the rest.
Automate OEE
Automated OEE Loss Categorization with iFactory
iFactory's manufacturing analytics platform automatically classifies downtime, speed losses, and quality defects into the correct OEE loss category — reducing operator logging errors by up to 80% and ensuring your OEE calculations reflect true equipment performance.
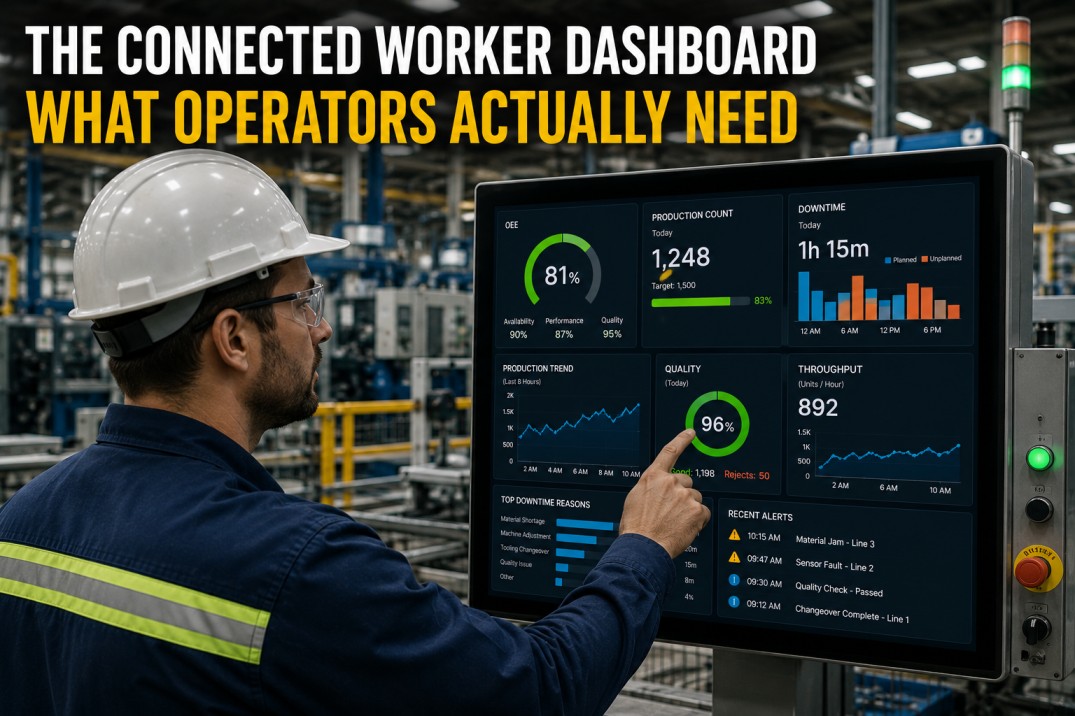
OEE Loss Categorization Scoreboard: Plant Performance Overview
Tracking OEE alongside the three loss categories helps operators understand how classification quality affects overall equipment effectiveness. The scoreboard below shows current performance with progress bars and month-over-month trends for a typical manufacturing plant.
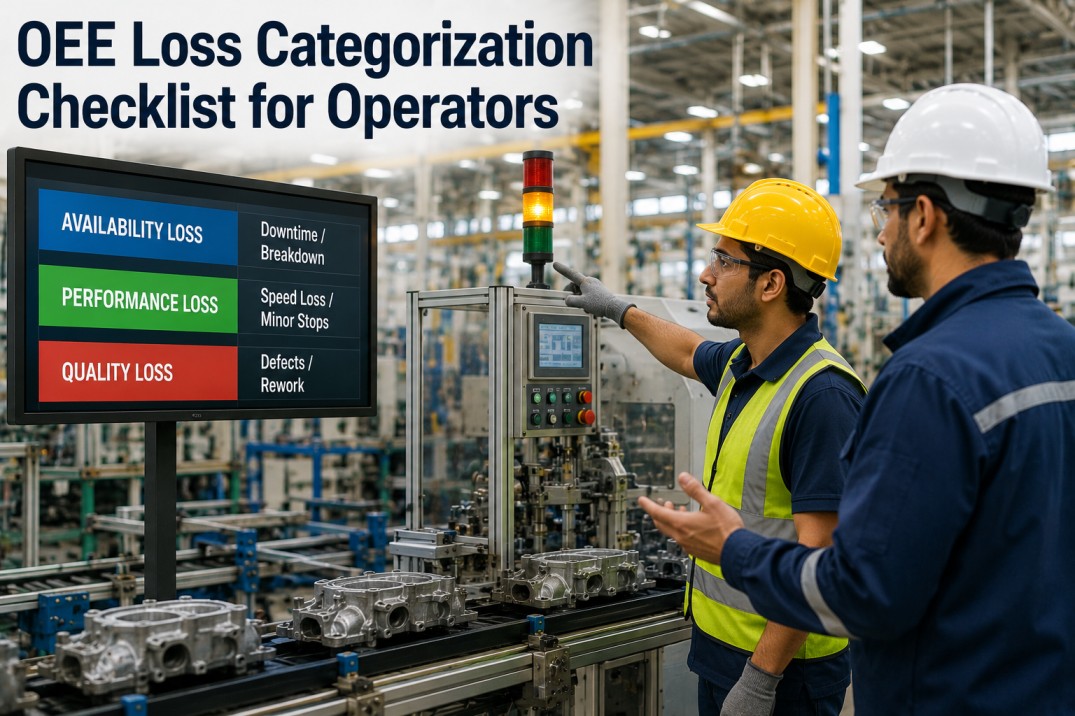
OEE Loss Category Reference Table: Availability, Performance, Quality
Every production loss falls into one of three OEE categories. Understanding the boundary between availability, performance, and quality losses is the first step toward consistent operator logging. The table below defines each category with typical examples and auto-detection capability.
| Category | Definition | Typical Examples | Auto-Detectable | Impact on OEE |
|---|---|---|---|---|
| Availability Loss | Any planned or unplanned event that stops production when the line is scheduled to run — including breakdowns, changeovers, and material shortages. | Equipment failure, setup/changeover, no material, no operator, planned maintenance, warm-up time | Mostly yes | 65% of total |
| Performance Loss | Any event where equipment runs below its ideal speed or cycle time — including micro-stops, idling, and slow cycles that reduce throughput without stopping production. | Micro-stops under 5 min, idling, slow cycles, reduced speed, operator inefficiency, material jams | Partially | 22% of total |
| Quality Loss | Any event where produced units do not meet quality specifications — including scrap, rework, and yield loss that consumes production time without producing saleable output. | Scrap, rework, start-up defects, in-spec but downgraded, yield loss, sorting/rejection | Mostly yes | 13% of total |
Classify Losses
Automated Loss Classification with iFactory's OEE Engine
iFactory automatically maps production events to the correct OEE loss category using machine state data, cycle time analysis, and quality inspection results — eliminating manual classification errors and ensuring consistent OEE calculation across all shifts and production lines.
Availability Loss Breakdown Table: Downtime Events by Type
Availability losses have the largest impact on OEE in most manufacturing plants. The table below lists eight common availability loss types with typical duration ranges, operator logging instructions, and whether iFactory can auto-detect each event.
| Loss Type | Loss Code | Typical Duration | Operator Action | Auto-Detect | Frequency |
|---|---|---|---|---|---|
| Equipment Failure | AVL-01 | 15 min – 4 hrs | Log machine ID, fault code, and start/end time | High | |
| Setup / Changeover | AVL-02 | 10 min – 2 hrs | Log product change, start time, and first good part time | High | |
| Planned Maintenance | AVL-03 | 30 min – 8 hrs | Log work order number and scheduled duration | Medium | |
| Material Shortage | AVL-04 | 5 min – 1 hr | Log material SKU and whether shortage is upstream or external | Medium | |
| No Operator | AVL-05 | 5 min – 2 hrs | Log reason (break, training, meeting, absence) and coverage plan | Low | |
| Warm-Up Time | AVL-06 | 5 min – 30 min | Log start of warm-up and when line reaches stable operation | High | |
| External Utility Failure | AVL-07 | 10 min – 6 hrs | Log utility type (power, air, water, gas) and service ticket number | Low | |
| Quality Hold / Rework Loop | AVL-08 | 15 min – 2 hrs | Log if line stopped due to QC hold — otherwise classify as Quality loss | Medium |
Performance Loss Detail Cards: Speed and Efficiency Losses
Performance losses reduce throughput without stopping the line — making them harder to detect and often overlooked in manual tracking. Each card below describes a common performance loss type with its typical speed impact and detection method.
Detect Losses
Automatic Performance Loss Detection with iFactory
iFactory continuously monitors cycle times and machine states to detect micro-stops, speed reductions, and idling events automatically — capturing performance losses that operators often miss or fail to log, and ensuring your OEE Performance score reflects true equipment efficiency.
Quality Loss Breakdown Table: Defect Events by Type
Quality losses consume production capacity without generating saleable output. The table below lists six common quality loss types with typical defect rate ranges, root causes, and operator logging guidance.
| Loss Type | Loss Code | Defect Rate Impact | Common Root Causes | Operator Action | Auto-Detect |
|---|---|---|---|---|---|
| Start-Up Scrap | QLT-01 | 0.5–3% | Temperature instability, pressure ramp-up, material flow settling | Log quantity and whether scrap is from warm-up or recipe change | |
| Process Defect | QLT-02 | 1–5% | Parameter drift, tool wear, contamination, material variation | Log defect type, quantity, affected station, and timestamp | |
| Rework / Rerun | QLT-03 | 1–4% | Out-of-spec but salvageable — requires additional processing time | Log rework hours and whether rework runs on same line or offline | |
| Downgraded Output | QLT-04 | 0.5–2% | Aesthetic defects, off-spec but functional, grade B output | Log downgrade grade and whether product is sold at reduced price | |
| Sorting / Inspection | QLT-05 | 0.5–1.5% | Manual or automated sorting of mixed-quality output — consumes line time | Log sorting duration and number of units sorted per hour | |
| Yield Loss (First Pass) | QLT-06 | 0.5–3% | Inherent process yield below 100% — non-defective but non-saleable | Track via production order — typically auto-calculated from good vs total units |
Loss Classification Decision Grid: Operator Scenarios
Ambiguous loss events are the most common source of OEE misclassification. The decision grid below maps real-world production scenarios to the correct OEE loss category — helping operators classify consistently across shifts.
| Production Scenario | Line State | Loss Category | Loss Code | What to Log |
|---|---|---|---|---|
| Line stopped for 20 min — operator cleaning material jam | Stopped | Availability | AVL-01 | Machine fault code, duration, jam location |
| Line running — operator clears minor jam in 2 min, no stop | Running (slow) | Performance | PRF-04 | Jam type, duration (manual) |
| Line running at 80% of ideal speed — worn tooling | Running (slow) | Performance | PRF-02 | Auto-detected by iFactory |
| Line stopped — QC places production on hold | Stopped | Availability | AVL-08 | QC hold number, reason, expected release |
| Line running — output has 3% scrap from parameter drift | Running | Quality | QLT-02 | Defect type, quantity, station |
| Line stopped — no raw material available for 30 min | Stopped | Availability | AVL-04 | Material SKU, shortage cause |
| Line running — changeover in progress, 45 min | Stopped (setup) | Availability | AVL-02 | Product change, first good part time |
| Line running — 1% rework due to temperature drift | Running | Quality | QLT-03 | Rework quantity, root cause |
| Line running — intermittent 30-sec micro-stops every 10 min | Running (cycling) | Performance | PRF-01 | Auto-detected by iFactory |
| Line stopped — 1-hour planned PM per schedule | Stopped | Availability | AVL-03 | PM work order, scheduled duration |
Standardise
Standardised OEE Classification Across All Shifts with iFactory
iFactory enforces consistent OEE loss classification across every shift, line, and plant — using automated machine-state detection, cycle time analysis, and quality data integration to eliminate manual classification errors and ensure your OEE data is trustworthy for decision-making.
Operator Quick-Reference Cards: What to Log vs What iFactory Detects
Operators need clear guidance on what to log manually versus what the OEE system captures automatically. The quick-reference cards below summarise the logging responsibility for each OEE loss type — helping operators focus their attention on events that require human judgment.
OEE Loss Categorisation Setup Checklist
Use this checklist to implement structured OEE loss categorisation across your plant — from defining loss codes to training operators and validating classification accuracy. Each task includes the implementation category, responsible owner, estimated duration, and priority level.
| # | Task | Category | Owner | Duration | Priority |
|---|---|---|---|---|---|
| 1 | Define OEE loss code taxonomy with all three categories (AVL, PRF, QLT) | Standards | OEE Champion | 2 days | Critical |
| 2 | Configure loss code mapping in OEE tracking system with auto-classification rules | System | IT / MES | 3 days | Critical |
| 3 | Create operator quick-reference sheets with loss code descriptions and examples | Training | Training Lead | 1 day | High |
| 4 | Train operators on OEE loss classification with real production scenarios | Training | Shift Supervisors | Half-day | High |
| 5 | Set up automated micro-stop detection threshold (e.g., < 5 min = performance loss) | System | Analytics | 1 day | Critical |
| 6 | Configure quality inspection integration to auto-classify quality losses | System | IT / Quality | 2 days | Critical |
| 7 | Establish 30-day classification accuracy audit with cross-shift validation | Process | OEE Champion | Ongoing | High |
| 8 | Define ideal cycle time baselines for every product on every line | Standards | Process Engineering | 1 week | Critical |
| 9 | Create escalation rule for misclassification patterns (auto-alert on anomalies) | System | Analytics | 1 day | Medium |
| 10 | Publish monthly OEE classification accuracy report with improvement actions | Reporting | Plant Manager | Half-day monthly | High |
Get Started
Implement OEE Loss Categorisation Across Your Plant Network
iFactory's OEE analytics module provides automated loss classification, real-time OEE dashboards, and operator-friendly reason code interfaces — helping you implement consistent OEE categorisation across every shift, line, and plant in your network. From hardware-agnostic data collection to executive OEE reporting, iFactory handles the complexity so your operators can focus on improvement.
Frequently Asked Questions
What is the difference between availability loss and performance loss?
Availability loss occurs when the line is completely stopped — the machine is not running at all, and no parts are being produced. Performance loss occurs when the line is running but producing at a slower rate than its ideal speed — the machine is still operating, but throughput is reduced. The general rule is: if the machine stopped, it is availability loss; if it continued running but slower, it is performance loss. Micro-stops under five minutes can be ambiguous and are typically classified as performance loss by convention unless the line fully stopped.
How do I classify a quality-related line stop?
If the line stops because of a quality issue — for example, QC places a hold on production or an inspector requires the line to stop for sampling — the time should be classified as availability loss (AVL-08 Quality Hold). The quality loss category is reserved for defects and scrap produced while the line is running. The key differentiator is whether the line is physically stopped. If stopped, it is availability. If running but producing defective output, it is quality.
Should planned maintenance be included in OEE calculation?
There are two schools of thought. The OEM definition excludes planned maintenance from OEE availability loss (subtracting planned downtime from total available time before calculating Availability). Many manufacturers, however, include planned maintenance as an availability loss to capture the full impact of maintenance activities on production capacity. The key is consistency — choose one approach, document it in your OEE standard, and apply it uniformly across all lines and shifts. iFactory supports both approaches and can be configured to match your chosen methodology.
How do I handle changeover time in OEE?
Changeover time is classified as availability loss (AVL-02 Setup/Changeover) in standard OEE methodology. The changeover duration is measured from the last good part of the previous product to the first good part of the next product at full speed. Some manufacturers exclude changeover time from OEE availability if they consider it planned downtime, but the industry standard is to include it as an availability loss because changeover represents time the line could otherwise be producing.
What is the ideal micro-stop threshold for performance loss?
The most common threshold is five minutes — any stop under five minutes is classified as a micro-stop (performance loss PRF-01), and any stop of five minutes or longer is classified as availability loss. Some industries use a three-minute or ten-minute threshold depending on typical cycle times and process characteristics. Whatever threshold you choose, it must be consistently applied across all lines and shifts. iFactory allows configurable micro-stop thresholds per machine or production line.
How does iFactory automate OEE loss classification?
iFactory uses three data streams to classify OEE losses automatically. Machine state data from PLCs and sensors determines whether the line is running, stopped, or idling — automatically classifying availability vs performance losses. Cycle time analysis detects speed reductions and micro-stops by comparing actual cycle times to ideal baselines. Quality inspection integration from vision systems, gauges, and manual inspection stations feeds defect data directly into the quality loss category. Operators only need to log contextual information such as defect root cause or fault descriptions — reducing classification errors and freeing operator time for improvement activities.
Ready to Start
Deploy OEE Loss Categorisation Across Your Plant in Weeks
iFactory's OEE analytics module connects to any PLC, MES, or manual data entry system to provide automated loss classification, real-time OEE dashboards, and operator-friendly reason code interfaces. From single-line pilots to multi-plant rollouts, iFactory handles the complexity so your team can focus on improving OEE — not debating how to classify losses.


.png)
.png)