.png)
Production loss is the single largest hidden cost in manufacturing — every minute of unplanned downtime, every second of speed loss, every unit of rework represents capacity and margin that can never be recovered. Yet most plants track losses inconsistently across different systems, leaving plant managers without a unified view of where value is actually being lost. This checklist covers seven critical dimensions of production loss analysis — from loss categorisation and Pareto prioritisation to line-level breakdowns, financial valuation, 5-why root cause deep-dives, and a complete implementation checklist — enabling manufacturers to build a structured loss analysis framework that turns every lost minute into a dollar impact and a clear reduction action plan.
Analyse Losses
Uncover Hidden Production Losses with iFactory's Loss Analysis Engine
iFactory's production loss analysis module automatically captures, classifies, and values every production loss across your plant — from unplanned downtime and speed losses to quality defects and startup waste — with a unified loss register that rolls up OEE impact and dollar value per loss type, per line, and per shift. Plant managers get a single source of truth for loss data that drives targeted improvement actions with clear ROI.
Production Loss Scoreboard: Four-Metric Loss Overview
The loss scoreboard provides a four-metric snapshot of your plant's production loss landscape — total hours lost to all loss categories, the estimated financial impact of those losses, the OEE percentage point impact, and the dominant loss category that should be the primary focus of improvement efforts. These leading indicators help plant managers quickly assess whether loss reduction programmes are on track or need renewed focus.
Loss Category Classification Table: Six Standard Loss Types Defined
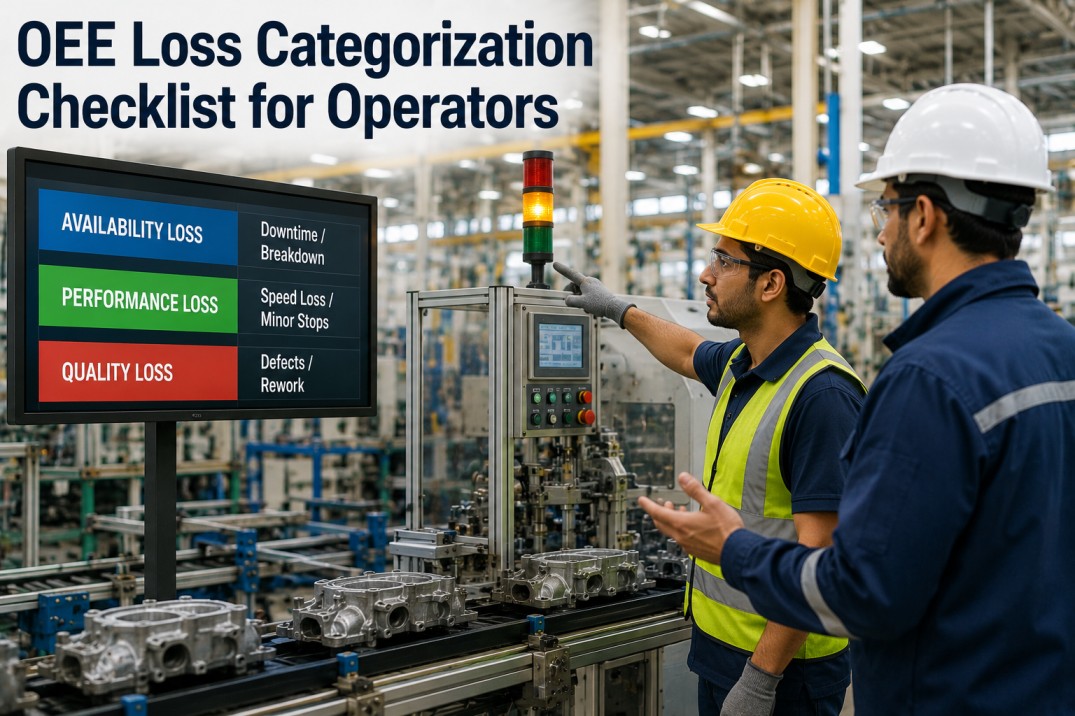
Standardised loss categorisation is the foundation of consistent production loss analysis. Every loss event must be classified into one of six standard categories — with clear definitions, typical causes, OEE impact on the availability/performance/quality trifecta, and the recommended recovery strategy for each. The table below provides a complete reference for loss classification across your plant.
| Category | Definition | Typical Causes | OEE Dimension | OEE Impact | Recovery Strategy |
|---|---|---|---|---|---|
| Breakdown Loss | Unplanned equipment stops that halt production — any duration from minutes to hours | Mechanical failure, electrical fault, sensor malfunction, tool breakage, jam | Availability | High — directly stops production | TPM, predictive maintenance, spare parts optimisation |
| Setup & Adjustment | Planned time to change over equipment between product runs, including adjustments and warm-up | Tooling change, recipe change, fixture setup, calibration, warm-up cycles | Availability | Moderate — planned but non-value-add | SMED, standardised changeover procedures, quick-change tooling |
| Idling & Minor Stops | Short unplanned stops (typically under 5 minutes) that do not trigger a formal breakdown code | Material jam, sensor trip, operator adjustment, conveyor pause, PLC fault | Performance | Moderate — frequent but short duration | Root cause elimination, sensor recalibration, operator training |
| Speed Loss | Operating below designed cycle time — machine runs but slower than ideal rate | Worn tooling, material variation, sub-optimal settings, operator pace, conveyor speed | Performance | Moderate — continuous loss per part | Cycle time analysis, OEE performance monitoring, process optimisation |
| Defect & Rework | Units produced that fail quality inspection — including scrap and units requiring rework | Process variation, material defect, operator error, tool wear, contamination | Quality | High — material and capacity wasted | SPC, root cause analysis, process capability improvement, poke-yoke |
| Startup Loss | Yield loss during equipment warm-up, ramp-up, and stabilisation after a changeover or restart | Thermal stabilisation, process settling, parameter tuning, scrap at restart | Quality | Low-Moderate — discrete per start event | Standardised startup procedures, parameter pre-sets, warm-up optimisation |
Loss Pareto Breakdown Ranking: Hours Lost by Loss Type with Cumulative Impact
Not all losses are equal — a Pareto analysis of loss hours by type reveals the few loss types that drive the majority of lost production time. The ranking below sorts ten loss types by total hours lost in the current period, with cumulative percentage bars and severity indicator dots that help plant managers prioritise which loss types to tackle first for the greatest impact.
| Rank | Loss Type | Category | Hours Lost | % of Total | Cumulative % | Severity |
|---|---|---|---|---|---|---|
| 1 | Mechanical breakdown — conveyor system | Breakdown | 78 | 22.8% | 22.8% | |
| 2 | Speed loss — worn tooling on Line B | Speed Loss | 52 | 15.2% | 38.0% | |
| 3 | Setup — extended changeover Line C | Setup | 41 | 12.0% | 50.0% | |
| 4 | Defect — dimensional tolerance on SKU-D | Defect | 33 | 9.6% | 59.6% | |
| 5 | Idling — sensor false trigger on Line A | Idling | 28 | 8.2% | 67.8% | |
| 6 | Breakdown — electrical fault on Line D | Breakdown | 22 | 6.4% | 74.2% | |
| 7 | Rework — surface finish on Line A | Defect | 18 | 5.3% | 79.5% | |
| 8 | Speed loss — conveyor speed reduction | Speed Loss | 14 | 4.1% | 83.6% | |
| 9 | Startup loss — post-changeover scrap Line C | Startup | 9 | 2.6% | 86.2% | |
| 10 | Setup — recipe change calibration time | Setup | 6 | 1.8% | 88.0% |
Prioritise Losses
Pareto-Based Loss Prioritisation with iFactory's Analytics Engine
iFactory's loss analysis module automatically ranks every loss type by hours lost, frequency, and financial impact — generating dynamic Pareto breakdowns that highlight the 20% of loss types driving 80% of lost production time. Plant managers get clear prioritisation with cumulative impact bars and severity indicators that guide improvement teams directly to the highest-value loss reduction opportunities.
Loss Breakdown by Production Line: Six-Line × Five-Category Matrix
Loss patterns vary significantly across production lines — equipment age, product complexity, operator experience, and maintenance history create unique loss profiles per line. The matrix below maps six production lines against five loss categories with colour-coded cells indicating severity and total loss hours per line, enabling plant managers to identify which lines need the most urgent loss reduction attention.
| Production Line | Breakdown | Setup | Idling | Speed Loss | Defect | Total Loss | % of Loss |
|---|---|---|---|---|---|---|---|
| Line A — Assembly | 42 hrs | 18 hrs | 28 hrs | 12 hrs | 33 hrs | 133 | 23.2% |
| Line B — Machining | 78 hrs | 14 hrs | 10 hrs | 52 hrs | 8 hrs | 162 | 28.3% |
| Line C — Packaging | 12 hrs | 41 hrs | 4 hrs | 8 hrs | 9 hrs | 74 | 12.9% |
| Line D — Moulding | 32 hrs | 16 hrs | 8 hrs | 6 hrs | 22 hrs | 84 | 14.7% |
| Line E — Finishing | 14 hrs | 12 hrs | 6 hrs | 3 hrs | 10 hrs | 45 | 7.9% |
| Line F — Sub-Assembly | 8 hrs | 5 hrs | 2 hrs | 4 hrs | 14 hrs | 33 | 5.8% |
Loss Valuation Cards: Financial Impact by Loss Type
Translating production losses into financial terms creates urgency and enables data-driven prioritisation. Each loss valuation card below shows the hourly cost rate, total hours lost MTD, the resulting financial impact, and a realistic cost reduction target — giving plant managers the dollar context needed to build a compelling business case for loss reduction investments.
5-Why Root Cause Deep-Dive Cards: Loss Scenario Analysis
Effective loss reduction requires understanding not just what was lost, but why. The five-why deep-dive cards below walk through four common loss scenarios — tracing each from the visible symptom through successive layers of cause to the fundamental root cause, with a clear corrective action that prevents recurrence. This structured approach turns loss data into actionable improvement insights.
Production Loss Analysis Implementation Checklist
Use this checklist to implement structured production loss analysis across your plant — from loss categorisation and Pareto prioritisation to line-level breakdowns, financial valuation, root cause deep-dives, and ongoing tracking. Each task includes a tick column for completion tracking, implementation category, responsible owner, estimated duration, and priority level.
| # | Task | Category | Owner | Duration | Priority | |
|---|---|---|---|---|---|---|
| 1 | Establish standardised loss category definitions aligned with OEE framework across all production lines | Standards | Plant Manager | 1 week | Critical | |
| 2 | Configure automated loss capture system to classify each downtime event into the correct loss category with duration and reason code | System | Analytics Lead | 2 weeks | Critical | |
| 3 | Build loss Pareto ranking dashboard sorted by hours lost with cumulative percentage and severity classification | Reporting | BI Analyst | 1 week | Critical | |
| 4 | Deploy loss breakdown by production line matrix with colour-coded severity for each loss category | Reporting | BI Analyst | 1 week | High | |
| 5 | Calculate hourly cost rate per production line and configure automatic financial valuation of all loss events | Financial | Cost Accountant | 1 week | High | |
| 6 | Establish 5-why root cause analysis process for top 3 loss types each month with standardised template and corrective action tracking | Process | Continuous Improvement | 2 weeks | High | |
| 7 | Create loss reduction target dashboard with cost reduction targets per loss category and progress tracking | Reporting | BI Analyst | 1 week | Medium | |
| 8 | Configure shift-level loss reporting so operators can see their shift's loss performance and contribute to root cause identification | System | Analytics Lead | 1 week | Medium | |
| 9 | Train operators and supervisors on loss category classification standards with written definitions and real-world examples | Training | Training Lead | 1 week | Medium | |
| 10 | Schedule monthly loss review meeting to review Pareto trends, evaluate corrective action effectiveness, and set next-month reduction targets | Sustain | Plant Manager | 1 day | Medium |
Frequently Asked Questions
What is the difference between a loss category and a loss type?
A loss category is a broad OEE-aligned classification — Breakdown, Setup, Idling, Speed Loss, Defect, and Startup — that groups similar loss events for high-level analysis. A loss type is a specific, named loss event within a category, such as "Conveyor bearing failure — Line B" within the Breakdown category. The category provides strategic structure; the type provides operational specificity for root cause analysis and corrective action.
How do I calculate the hourly cost of production losses?
The standard approach is to divide total production-related costs (labour, equipment depreciation, energy, overhead allocated to production) by total planned production hours. For example, if a line costs $12,000 per shift to operate and runs 20 planned production hours per day, the hourly cost rate is $600/hr. This rate is then multiplied by loss hours to calculate the financial impact of each loss event. iFactory automates this calculation with configurable cost rates per line, per shift, and per product family.
How often should loss Pareto analysis be updated?
Loss Pareto analysis should be updated in real time — every loss event captured by the system should immediately recalculate the ranking, cumulative percentages, and severity classification. This enables plant managers to see shifting loss patterns as they emerge rather than waiting for end-of-month reports. In iFactory, the loss Pareto dashboard updates dynamically with each new event, with period-over-period comparison views (daily, weekly, monthly) to track improvement trends.
What is the difference between idling losses and speed losses?
Idling losses (minor stops) occur when the machine stops completely for a short duration — typically under 5 minutes — such as a sensor false trigger or a material jam that is quickly cleared. Speed losses occur when the machine continues running but below its designed cycle time, such as worn tooling causing slower cutting speeds or reduced conveyor speed. Both affect OEE Performance, but idling is about frequency of short stops while speed loss is about sustained reduced speed during running time.
How does iFactory handle loss classification automatically?
iFactory applies rule-based classification using machine data: duration, stop type, reason codes from operator input, and cycle time deviation. Stops longer than a configurable threshold (e.g., 5 minutes) with a downtime reason code are classified as Breakdown or Setup based on the reason code category. Short stops below the threshold are classified as Idling. Speed losses are detected when the machine is running but the actual cycle time exceeds the ideal cycle time by a configurable percentage. Defect losses come from quality inspection results linked to the production run. All classifications can be overridden by operators for continuous improvement of the rule set.
Ready to Start
Deploy Production Loss Analysis Across Your Plant Network with iFactory
iFactory's production loss analysis module provides all seven loss analysis dimensions out of the box — from automated loss capture and classification to Pareto prioritisation, line-level breakdown matrices, financial valuation, 5-why root cause templates, and continuous improvement tracking with measurable reduction targets. From single-line loss pilots to multi-plant loss reduction programmes, iFactory turns every lost minute into a dollar impact and a clear action plan for recovery.