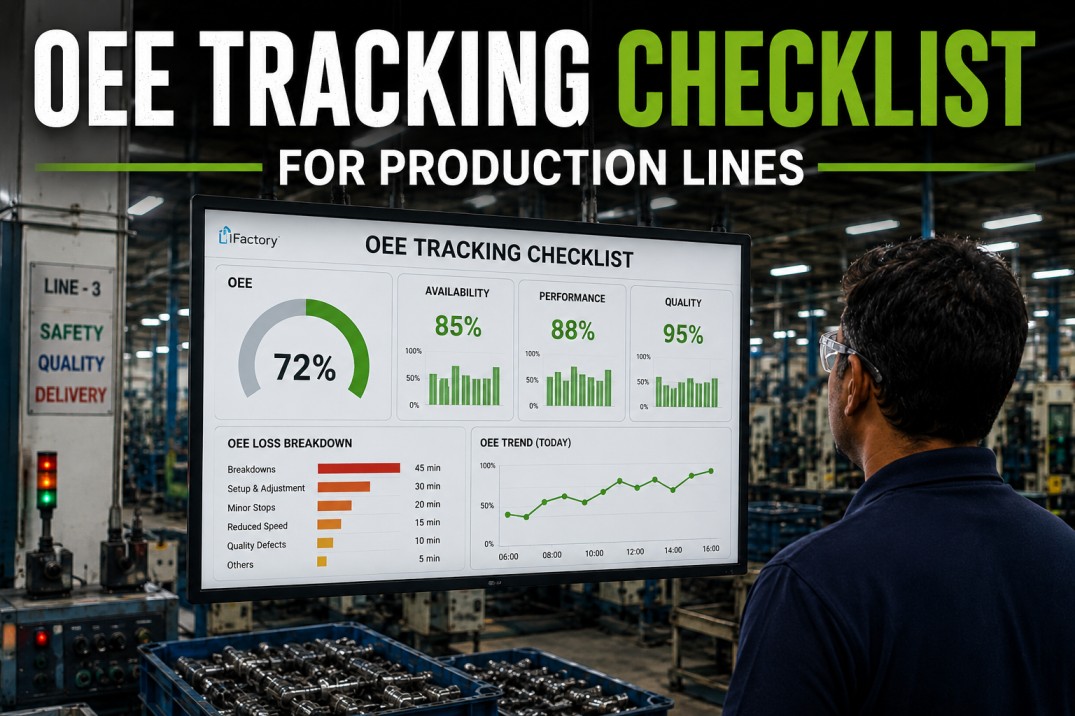
OEE — Overall Equipment Effectiveness — is the industry-standard metric for measuring manufacturing productivity, defined as the product of Availability, Performance, and Quality. A world-class OEE of 85% means your equipment is available when needed, running at speed, and producing conforming parts. But OEE is only as useful as the data discipline behind it: an OEE number calculated from incomplete downtime records, an incorrect ideal cycle time, or a reject count that misses rework tells you nothing and drives wrong decisions. This OEE tracking checklist gives production teams a complete step-by-step framework for implementing accurate, actionable OEE measurement — from data infrastructure through the Six Big Losses, shift review cadence, and improvement action tracking.
Capture Every Loss Minute and Rank the Six Big Losses Automatically
iFactory calculates OEE in real time per shift and line — availability from timestamped downtime events, performance from machine counts, quality from inspection results. Six Big Losses ranked automatically every shift.
OEE Baseline — Defining the Measurement Correctly
The most common OEE implementation failure is measuring the wrong thing. OEE must be scoped to a specific asset or line with a clear definition of planned production time. Including planned stops — scheduled maintenance, breaks, no-order periods — in the denominator deflates the OEE score and makes the metric meaningless for benchmarking. The ideal cycle time must be the engineered or nameplate rate, not the rate operators are currently achieving — if you use actual speed as the baseline, Performance is permanently 100% and you have eliminated the most common loss category before you started.
Define Line Boundaries
One OEE score per clearly scoped asset or production line. Multi-machine lines require agreement on where the bottleneck is measured — OEE on the constraint asset, not averaged across all equipment.
Planned Production Time
PPT is the scheduled production time minus planned stops. Planned stops include: scheduled breaks, planned maintenance windows, no-order periods, and planned shutdowns. All must be excluded before OEE denominator is set.
Ideal Cycle Time
The maximum possible production rate — nameplate speed or engineered standard. Never the actual running rate. Locked by engineering and not adjustable without formal change control. This is the Performance baseline.
Good Count Definition
Good count = units conforming on first pass, before any rework. Reworked units that pass final inspection are NOT good count — they are quality losses that must appear in the OEE quality denominator.
Data Source Verification
Machine counter, MES output, or manual tally — whatever data source feeds OEE must be verified accurate before the OEE programme begins. Inaccurate source data produces an OEE score that nobody trusts and nobody acts on.
Baseline Before Targets
Run the OEE measurement for at least four weeks before setting improvement targets. An OEE baseline established before any improvement activity provides the only defensible reference point for measuring progress.
Availability — Capturing Every Downtime Minute
Availability is the ratio of actual run time to planned production time, and it is degraded by every unplanned downtime event and every changeover. The quality of your Availability data depends entirely on how rigorously downtime events are captured — their start time, end time, duration, and reason code. A downtime event logged as "machine fault" without a specific reason code is useless for Pareto analysis and improvement prioritisation. The Six Big Losses bucket unplanned downtime into Equipment Failure (sudden, unplanned stops) and Setup/Adjustment (changeovers, adjustments, trial runs).
Timestamp Every Event
Each downtime event needs a precise start and end timestamp — not approximate shift-level totals. Without timestamps, you cannot identify whether equipment failure is occurring early-shift (startup) or mid-run.
Reason Code Discipline
Operators must select a specific reason code — not "Other" or "Unknown" — for every downtime event. If more than 5% of events are coded "Other", the reason code list needs to be rebuilt from actual event history.
Changeover Capture
Changeover time must be captured separately from unplanned downtime. It is its own Six Big Losses category (Setup/Adjustment) and requires different improvement methodology — SMED versus maintenance root cause analysis.
Short Stops vs. Downtime
Stops under five minutes are minor stoppages — a Performance loss, not an Availability loss. Misclassifying short stops as downtime inflates Availability losses and understates Performance losses.
Availability Formula
Availability = Run Time / Planned Production Time. Run Time = PPT minus all downtime duration. Verify the formula is applied consistently and that planned stops are excluded from PPT before the calculation.
MTBF and MTTR Alongside OEE
Mean Time Between Failures and Mean Time To Repair are the diagnostic metrics behind Availability OEE. Track both per equipment class so maintenance teams have specific targets beyond the composite OEE score.
Performance — Measuring Speed Loss Without Excuses
Performance measures how close your production rate is to the ideal cycle time during the time the machine is actually running. A Performance of 75% means the machine is producing at three-quarters of its engineered speed — and that gap represents the Speed Loss category in the Six Big Losses. The two components of speed loss are reduced speed (running deliberately slower than ideal) and minor stoppages (brief interruptions under five minutes that operators clear without logging). Both are systematically under-reported in manual OEE systems because operators rationalise speed reductions as "process requirements" rather than losses.
Using the average running rate instead of the engineered ideal cycle time makes Performance permanently close to 100% and hides speed loss entirely. If your Performance rate never shows less than 95%, your ideal cycle time is wrong — not your process.
Stops under five minutes that operators clear themselves are almost never logged in manual OEE systems. In many operations, minor stoppages account for more lost production time than all logged downtime events combined. Automatic machine counters versus manual counts reveal the gap.
Run a time study on the line during a normal production run. Compare the observed cycle time to the ideal cycle time. Any gap greater than 5% that cannot be explained by minor stoppages indicates a speed-reduction practice that must be investigated and corrected.
OEE Performance above 100% is impossible if ideal cycle time is set correctly. It indicates the ideal cycle time is too conservative, the unit count is inflated, or both. Correct the root data error before using the OEE number for any performance comparison.
Quality — Counting Every Defect Including Rework
OEE Quality measures first-pass yield — the proportion of total units produced that are conforming without rework on the first attempt. The critical discipline is including reworked units in the quality loss total. A part that fails first inspection, gets reworked, and passes final inspection is a quality loss. It consumed machine time to produce incorrectly, consumed additional time to rework, and introduced a risk that the rework was incomplete. Including only final-inspection scrap in the quality calculation systematically overstates OEE quality and hides rework as a production cost.
Include All Rework
Rework is a quality loss even if the unit ultimately ships. Total count minus good count must include both scrapped and reworked units. Validate this definition is applied consistently across all shifts.
Startup Rejects Coded Separately
First-off parts rejected while the process is stabilising are Startup Rejects in the Six Big Losses — a different root cause from Production Rejects mid-run. Separate coding enables targeted improvement.
Defect Reason Codes
Every reject must have a reason code. Unlabelled rejects produce a quality OEE number with no actionable diagnostic information. Build the reason code list from the actual top defect types in your process.
First-Pass Yield vs. Final Yield
Track FPY alongside OEE quality rate. The gap between FPY and final yield reveals the rework workload that is invisible in final yield statistics.
Quality Formula Verification
Quality = Good Count / Total Count. Verify the formula includes rework in the "not good" count. A quality rate that never falls below 99.5% in a complex manufacturing process is almost certainly not including rework.
Defect Pareto Linked to OEE
The defect reason code Pareto should drive quality improvement priorities. If OEE quality drops on a specific shift or product, the defect reason code data should immediately identify the cause without further investigation.
OEE Review Cadence — Making the Number Drive Action
OEE is a lagging indicator — by the time the number is calculated, the loss has already occurred. The value of OEE is in the shift-level review process that uses the loss breakdown to direct improvement effort to the highest-impact opportunity. An OEE number reviewed only in a monthly management report produces no improvement. An OEE loss Pareto reviewed at every shift handover, with the top loss assigned to a named owner before the shift ends, produces compounding improvement over time.
At the end of each shift, the outgoing supervisor reviews OEE performance, availability loss events, and top quality losses with the incoming supervisor. The top loss for the shift is identified and either resolved or carried as an open action to the next shift.
A daily Pareto of OEE losses by category is generated automatically or manually. The top two or three loss categories are visible on the production board and in the shift review. Teams know which Six Big Losses category consumed the most production time.
In the weekly production meeting, OEE trend by line is reviewed alongside the loss Pareto. Improvement actions from the previous week are reviewed for completion. New actions are assigned for the current week's top losses.
Every OEE improvement action has a named owner, a specific target, and a due date. Actions without owners are not actions — they are observations. iFactory tracks open OEE improvement actions alongside live OEE data.
Monthly spot-check of OEE data quality — compare machine counter data to manual tally, verify reason codes are being used consistently, confirm ideal cycle time has not been changed without approval. A corrupt OEE data stream produces false confidence or false alarm.
iFactory Calculates OEE Live and Ranks Six Big Losses Every Shift
iFactory captures downtime events, machine counts, and defect data in real time — calculates Availability, Performance, and Quality automatically — and ranks the Six Big Losses by impact per shift. No spreadsheets, no manual Pareto.
OEE Tracking Checklist — 30 Items
Use this OEE tracking checklist to implement or audit an OEE measurement programme. Items cover data infrastructure, availability capture, performance measurement, quality counting, OEE calculation, and shift review cadence.
| # | Checklist Item | Type | Priority | Photo | Required | Critical |
|---|---|---|---|---|---|---|
| 1 | Production line boundaries defined — one OEE score per clearly scoped asset or line | Pass/Fail | High | — | ✓ | ✓ |
| 2 | Planned production time (PPT) recorded per shift — schedule loaded including planned stops | Pass/Fail | High | — | ✓ | ✓ |
| 3 | Planned stops excluded from OEE calculation: breaks, scheduled maintenance, no orders | Pass/Fail | High | — | ✓ | ✓ |
| 4 | Ideal cycle time (nameplate or engineered rate) defined and agreed for each product | Pass/Fail | High | — | ✓ | ✓ |
| 5 | Good count and reject count data sources identified and verified as accurate | Pass/Fail | High | — | ✓ | ✓ |
| # | Checklist Item | Type | Priority | Photo | Required | Critical |
|---|---|---|---|---|---|---|
| 6 | All unplanned downtime events captured with start time, end time, and reason code | Pass/Fail | High | — | ✓ | ✓ |
| 7 | Downtime reason code list covers all actual failure categories — no excessive use of "Other" | Pass/Fail | High | — | ✓ | ✓ |
| 8 | Setup and changeover time recorded separately and consistently across all shifts | Pass/Fail | High | — | ✓ | ✓ |
| 9 | Availability calculated as: Run Time / Planned Production Time — formula verified | Pass/Fail | High | — | ✓ | ✓ |
| 10 | Availability loss events linked to the Six Big Losses category — Equipment Failure or Setup/Adjustment | Pass/Fail | High | — | ✓ | ✓ |
| # | Checklist Item | Type | Priority | Photo | Required | Critical |
|---|---|---|---|---|---|---|
| 11 | Ideal cycle time locked — not adjustable by operators or supervisors without QA approval | Pass/Fail | High | — | ✓ | ✓ |
| 12 | Actual unit count recorded at machine level — not estimated from downstream | Pass/Fail | High | — | ✓ | ✓ |
| 13 | Minor stoppages (under 5 min) captured separately from unplanned downtime | Pass/Fail | High | — | ✓ | ✓ |
| 14 | Performance calculated as: (Ideal Cycle Time × Total Count) / Run Time | Pass/Fail | High | — | ✓ | ✓ |
| 15 | Performance consistently below 100% on any shift flagged for speed-loss investigation | Pass/Fail | Med | — | ✓ | — |
| # | Checklist Item | Type | Priority | Photo | Required | Critical |
|---|---|---|---|---|---|---|
| 16 | Reject count includes all scrapped and reworked units — not only final-inspection rejects | Pass/Fail | High | — | ✓ | ✓ |
| 17 | First-pass yield (FPY) tracked alongside OEE quality rate | Pass/Fail | High | — | ✓ | ✓ |
| 18 | Defect reason codes used consistently — no unlabelled rejects in data | Pass/Fail | High | — | ✓ | ✓ |
| 19 | Quality calculated as: Good Count / Total Count — formula verified | Pass/Fail | High | — | ✓ | ✓ |
| 20 | Startup rejects (first-off parts before process stabilises) coded separately | Pass/Fail | Med | — | ✓ | — |
| # | Checklist Item | Type | Priority | Photo | Required | Critical |
|---|---|---|---|---|---|---|
| 21 | OEE = Availability × Performance × Quality — formula applied consistently across all lines | Pass/Fail | High | — | ✓ | ✓ |
| 22 | Six Big Losses classified: Equipment Failure, Setup/Adjust, Minor Stops, Reduced Speed, Startup Rejects, Production Rejects | Pass/Fail | High | — | ✓ | ✓ |
| 23 | Largest loss category identified per shift — Pareto of losses generated | Pass/Fail | High | — | ✓ | ✓ |
| 24 | OEE score does not exceed 100% — any score above 85% validated against data quality | Pass/Fail | High | — | ✓ | ✓ |
| 25 | OEE baseline established for each line before improvement targets are set | Pass/Fail | High | — | ✓ | ✓ |
| # | Checklist Item | Type | Priority | Photo | Required | Critical |
|---|---|---|---|---|---|---|
| 26 | Shift OEE review completed at each shift handover — losses discussed with incoming shift | Pass/Fail | High | — | ✓ | ✓ |
| 27 | Daily OEE trend visible to operators and supervisors — not only management | Pass/Fail | High | — | ✓ | ✓ |
| 28 | Weekly OEE loss Pareto reviewed in production meeting — top loss actioned | Pass/Fail | High | — | ✓ | ✓ |
| 29 | OEE improvement actions assigned to named owner with due date — not left as observations | Pass/Fail | High | — | ✓ | ✓ |
| 30 | OEE data quality audited monthly — spot-check manual entries against machine data | Pass/Fail | Med | — | ✓ | — |
Frequently Asked Questions
What is OEE and how is it calculated?
OEE stands for Overall Equipment Effectiveness and is calculated as Availability × Performance × Quality. Availability measures the proportion of planned production time the machine was actually running. Performance measures how close the actual production rate was to the ideal cycle time. Quality measures the proportion of total units that were conforming on first pass without rework. A world-class OEE of 85% means the equipment was available 90% of the time, ran at 95% of ideal speed, and produced 99.5% conforming parts first pass.
What are the Six Big Losses in OEE?
The Six Big Losses are the six categories of production loss that reduce OEE. Under Availability: Equipment Failure (unplanned breakdowns) and Setup/Adjustment (changeovers and adjustments). Under Performance: Minor Stoppages (short stops under five minutes) and Reduced Speed (running below ideal cycle time). Under Quality: Startup Rejects (scrap and rework during process stabilisation) and Production Rejects (scrap and rework during steady-state production). Ranking the Six Big Losses by impact is the first step in OEE-based improvement.
What OEE is considered world-class?
World-class OEE benchmarks are typically 85% for discrete manufacturing and 65% for process manufacturing, though benchmarks vary by industry and asset type. More important than the absolute number is the trend — an OEE of 62% improving consistently month-over-month is a more positive signal than a static 78% with no improvement activity. The OEE benchmark is only meaningful when the measurement methodology is consistent and the data quality is audited. Book a Demo to see how iFactory benchmarks OEE across lines and plants.
What is the most common mistake in OEE measurement?
The most common OEE measurement mistake is using the actual running rate instead of the engineered ideal cycle time as the Performance baseline. This makes Performance permanently close to 100% and hides speed losses entirely — the most common and most recoverable OEE loss category in most manufacturing operations. The second most common mistake is excluding rework from the quality loss count, which overstates OEE quality and hides the true cost of process non-conformance.
How does iFactory capture OEE data automatically?
iFactory connects to machine PLCs, sensors, or operator input devices to capture production counts, downtime events, and defect data in real time at the machine level. Availability is calculated from timestamped downtime events with reason codes. Performance is calculated from machine counts against the locked ideal cycle time. Quality is calculated from inspection results including rework. OEE is calculated per shift, per line, and per plant automatically — with the Six Big Losses ranked by impact and visible on the shift dashboard. Book a Demo to see the OEE module.
Replace Your OEE Spreadsheet with Live iFactory OEE Tracking
iFactory gives production teams real-time OEE tracking — per shift, per line, per plant — with automatic Six Big Losses ranking and shift review dashboards. Implement OEE correctly from day one.