A production reporting setup checklist is the difference between reports that drive action and reports that get ignored. Most manufacturing plants attempt to build reports in Excel, BI tools, or ERP modules without a structured rollout plan — and end up with inconsistent data, missed shifts, and managers building their own shadow reports. This checklist covers every step required to deploy shift, daily, weekly, and monthly production reports that operators, supervisors, and plant managers will actually use. Each item is drawn from iFactory's deployment playbook used across 1,000+ manufacturing plants.
Get Your Production Reports Live in Two Weeks — Pre-Built and Pre-Configured
iFactory's deployment team will set up your shift, daily, weekly, and monthly production reports using your plant's data. See your first report in a 30-minute session.
Why a Structured Production Report Setup Matters
Manufacturing plants that follow a structured reporting rollout achieve 4x higher daily active usage within 90 days compared to ad-hoc report deployment. The four report tiers serve distinct audiences and decision cycles.
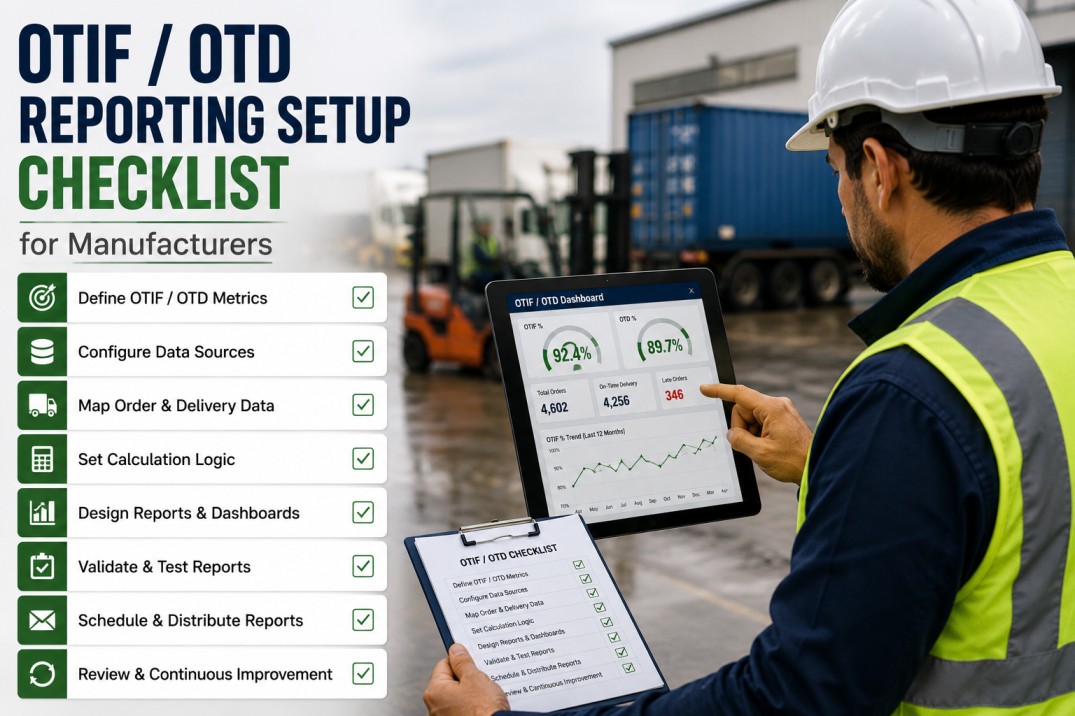
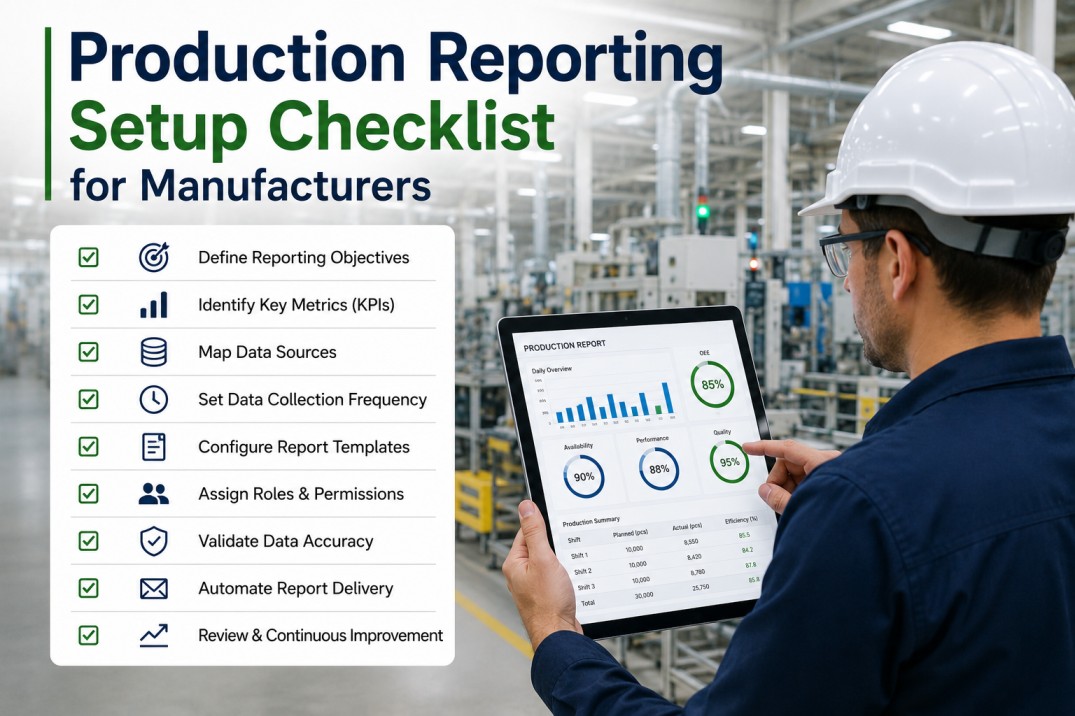
Production Reporting Setup Checklist — 28 Items
Each checklist item includes the specific action required, type, priority, and status toggles. The type indicates whether the item is a pass/fail check, a structured selection, or a numeric configuration. Priority marks implementation order. Use the Photo, Required, and Critical toggles to track completion.
| # | Checklist Item | Type | Priority | Photo | Req. | Crit. |
|---|---|---|---|---|---|---|
| 1 | Asset or line scope defined — each tracked asset has a unique ID in the tracker | Pass/Fail | High | — | ✓ | ✓ |
| 2 | Minimum event duration threshold defined — stops below threshold handled separately | Pass/Fail | High | — | ✓ | ✓ |
| 3 | Planned vs unplanned downtime categories defined — tracker separates them | Pass/Fail | High | — | ✓ | ✓ |
| 4 | Reason code list built from historical failure data — not a generic template | Pass/Fail | High | — | ✓ | ✓ |
| 5 | Data entry responsibility assigned: operator, maintenance tech, or supervisor | Pass/Fail | High | — | ✓ | ✓ |
| # | Checklist Item | Type | Priority | Photo | Req. | Crit. |
|---|---|---|---|---|---|---|
| 6 | Asset ID — which machine or line stopped | Selection | High | — | ✓ | ✓ |
| 7 | Start timestamp — time of stop recorded at the moment of occurrence | Pass/Fail | High | — | ✓ | ✓ |
| 8 | End timestamp — time of restart recorded at the moment of restart | Pass/Fail | High | — | ✓ | ✓ |
| 9 | Downtime duration auto-calculated or manually entered in minutes | Numeric | High | — | ✓ | ✓ |
| 10 | Reason code — from the structured 2-level hierarchy, not free text | Selection | High | — | ✓ | ✓ |
| 11 | Responsible party: maintenance, operator, process, material, or changeover | Selection | High | ✓ | ✓ |
| # | Checklist Item | Type | Priority | Photo | Req. | Crit. |
|---|---|---|---|---|---|---|
| 12 | "Other" reason code usage below 5% of all events — if higher, code list needs review | Pass/Fail | High | — | ✓ | ✓ |
| 13 | Reason codes reviewed monthly — new failure modes added within 5 working days | Pass/Fail | High | — | ✓ | ✓ |
| 14 | Two-level hierarchy: category (Electrical) to specific cause (Drive fault) | Pass/Fail | High | — | ✓ | ✓ |
| 15 | Changeover coded as separate category from unplanned breakdown | Pass/Fail | High | — | ✓ | ✓ |
| 16 | Sub-system field populated: electrical, mechanical, tooling, process, material | Pass/Fail | Med | — | ✓ | — |
| # | Checklist Item | Type | Priority | Photo | Req. | Crit. |
|---|---|---|---|---|---|---|
| 17 | Daily total downtime per asset calculated or auto-summed in tracker | Numeric | High | — | ✓ | ✓ |
| 18 | Daily Pareto of downtime by reason code generated — top 3 causes identified | Pass/Fail | High | — | ✓ | ✓ |
| 19 | MTBF calculated per asset: operating hours divided by number of failure events | Numeric | High | — | ✓ | ✓ |
| 20 | MTTR calculated per cause category: total repair time divided by number of events | Numeric | High | — | ✓ | ✓ |
| 21 | Repeat events (same asset, same code, 3+ in 30 days) flagged for RCA | Pass/Fail | High | — | ✓ | ✓ |
| # | Checklist Item | Type | Priority | Photo | Req. | Crit. |
|---|---|---|---|---|---|---|
| 22 | Shift downtime summary reviewed at shift handover — top cause noted | Pass/Fail | High | — | ✓ | ✓ |
| 23 | Weekly Pareto reviewed in production meeting — top cause has assigned owner | Pass/Fail | High | — | ✓ | ✓ |
| 24 | Actions from downtime review tracked to closure — not just noted and forgotten | Pass/Fail | High | — | ✓ | ✓ |
| 25 | Monthly data quality spot-check — manual entries verified against machine signal data | Pass/Fail | Med | — | ✓ | — |
All 28 Checklist Items Pre-Configured in iFactory — Go Live in 14 Days
Every shift, daily, weekly, and monthly report in this checklist is pre-built in iFactory and configured to your plant's data during onboarding. No blank templates. No manual setup.
Report Tier Reference: What Each Level Covers
Each report tier serves a specific audience and decision cycle. Understanding the tier structure ensures your checklist items map to the right report level.
Shift Reports
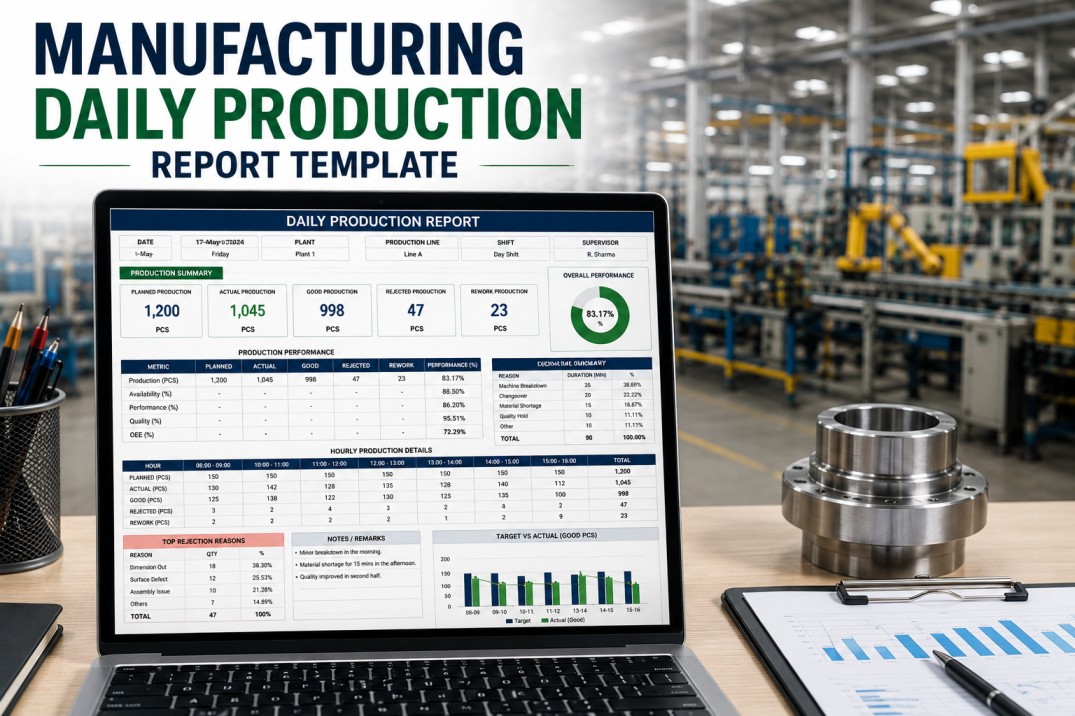
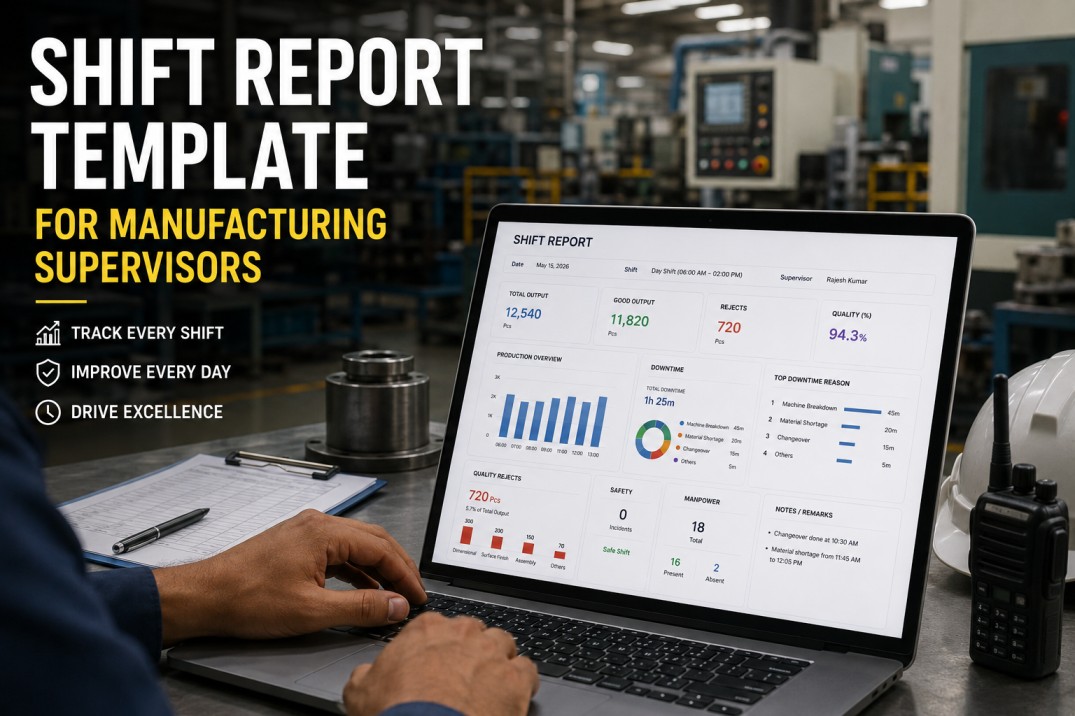
Operators and shift supervisorsReal-time OEE per line, downtime events with reason codes, production count vs target, shift handoff summary. Updated every shift. Primary data capture layer.
Daily Reports
Production managers and plant managersDaily production summary by line, OEE with 7-day trend, downtime Pareto top-5, first-pass yield and scrap cost, schedule attainment. Updated every morning.
Weekly Reports
Plant leadership and department headsOEE trend with 4-week rolling average, downtime Pareto by equipment class, quality trend by defect type, maintenance compliance ratio, labor productivity.
Monthly Reports
Plant manager and corporate stakeholdersOEE summary with YTD trend, production vs plan by product, cost of poor quality, maintenance cost vs budget, safety metrics, ROI summary vs investment.
Four-Stage Deployment: From Setup to Self-Sufficient Operation
Structured reporting deployment follows a proven four-stage path. Each stage builds on the previous one and includes measurable completion criteria before moving to the next.
- Connect data sources and validate signal quality
- Configure shift calendar and line definitions
- Set up OEE calculation parameters per line
- Establish baseline metrics from 30 days of data
- Deploy shift reports to operator workstations
- Launch daily reports for production management
- Train shift supervisors on report interpretation
- Verify data quality and correct signal issues
- Deploy weekly reports with trend analysis
- Launch monthly reports for plant leadership
- Configure automated distribution schedules
- Set up escalation rules and alert thresholds
- Review adoption metrics and report usage data
- Adjust KPIs and thresholds based on feedback
- Add custom views per role and audience
- Transition report ownership to plant team
Frequently Asked Questions About Production Reporting Setup
How long does it take to set up production reports from scratch?
With iFactory, all four report tiers can be live within 14 calendar days. The foundation stage (days 1-3) covers data source connections, signal validation, and OEE parameter configuration. Launch stage (days 4-7) delivers shift and daily reports to operators and supervisors. Expand stage (days 8-11) adds weekly and monthly reports with trend analysis. Optimize stage (days 12-14+) includes adoption review and custom view configuration. Setting up equivalent reports manually in Excel or a BI tool typically takes 6-12 weeks and requires ongoing maintenance for every data source change.
What data sources do I need to have in place before starting?
You need machine connectivity to PLCs or sensors for automated OEE and downtime data, or a structured manual entry process for production counts and downtime events. A CMMS with work order data accelerates maintenance reporting setup. ERP access for planned production targets and labor data enables schedule attainment and productivity reporting. iFactory's deployment team will assess your current data readiness during the kickoff session and recommend the most efficient connectivity approach for your specific plant infrastructure.
Which production reports should I prioritize first?
Start with shift-level reports. The shift report is the data capture layer that feeds every higher-level report. Without accurate shift-level data — OEE by line, downtime events with reason codes, production count vs target — your daily, weekly, and monthly reports will be built on unreliable data. Once shift reports are stable and operators are consistently entering defect and downtime reason codes, deploy daily reports. Weekly and monthly reports should follow only after the daily reports are being actively used and reviewed in shift handoff meetings.
How do I make sure operators and supervisors actually use the reports?
Three factors drive adoption in iFactory's deployment data. First, reports must be available at the point of decision — on shop floor workstations or mobile devices, not in an office or email attachment. Second, report content must match the user's decision horizon: operators need real-time data per line, supervisors need shift summaries, managers need trends. Third, the data must be trusted — which means automated capture rather than manual data entry wherever possible, and visible data quality metrics. Plants that follow these three principles achieve 87% daily active usage within 90 days of deployment.
Can I customize reports after they are deployed?
Yes. iFactory's report builder allows plant teams to modify existing reports and create new views without vendor involvement. Common post-deployment customizations include adjusting OEE target thresholds, adding new product family groupings, configuring additional downtime Pareto views by shift, and creating role-specific summary views for department heads. Report changes take effect immediately and do not require code deployment or platform updates. iFactory's support team provides ongoing report optimization guidance during the first 90 days to ensure reports evolve with the plant's needs.
All 28 Checklist Items Pre-Configured in iFactory — Go Live in 14 Days
Every shift, daily, weekly, and monthly report in this checklist is pre-built in iFactory and configured to your plant's data during onboarding. No blank templates. No manual setup.