The daily production report is the single most reviewed document in any manufacturing plant. The morning stand-up starts with it. The plant manager relies on it to track shift performance. The supervisor uses it to identify issues before they compound. Yet most daily production reports are manually compiled from whiteboard notes, spreadsheet entries, and verbal handoffs — creating a document that is often outdated before the meeting ends. This post examines what separates an effective daily production report from a compliance exercise, where most reporting efforts go wrong, and how leading plants have transformed their reporting from a manual chore into an automated source of operational intelligence.
iFactory Generates Your Daily Production Report Automatically at Every Shift End
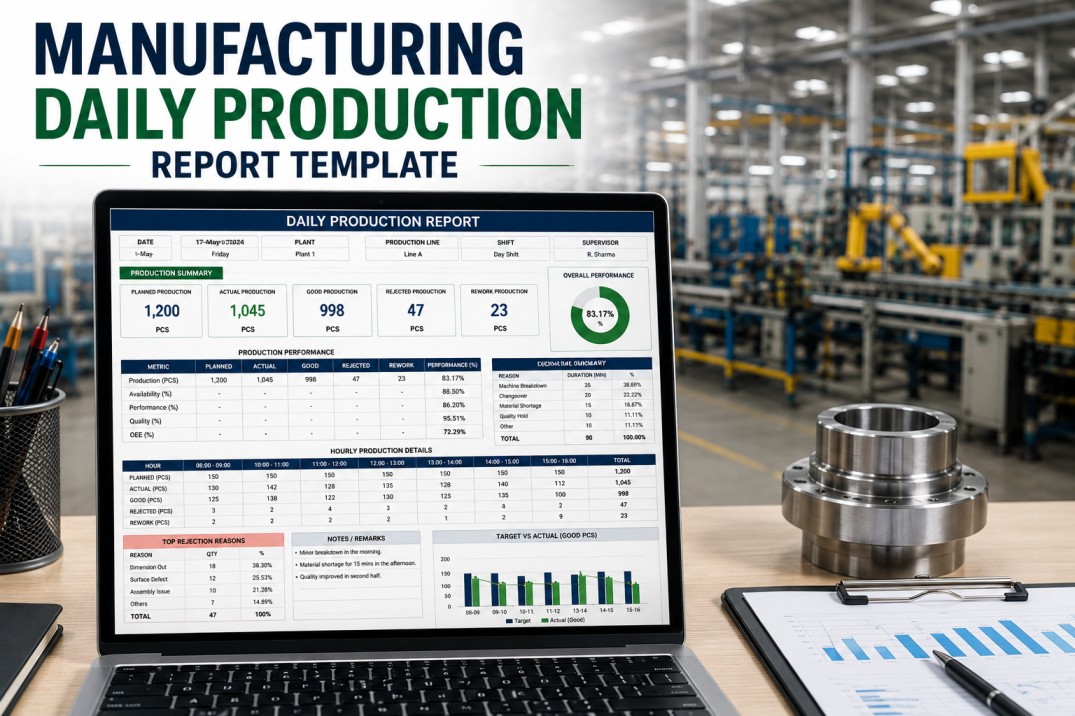
Planned vs actual output, downtime analysis, quality data, and shift notes — delivered at midnight without anyone touching a keyboard.
The Four Essential Elements of an Effective Daily Production Report
An effective daily production report does more than record what happened. It organizes data in a way that drives decisions within the first five minutes of review. Every complete daily report — whether manual or automated — should contain these four structural elements.
Production Summary with Variance
Planned versus actual output by line and product, expressed in both units and percentage variance. Cumulative week-to-date and month-to-date totals provide trend context. A color-coded variance indicator — green for on plan, yellow for within ten percent, red for behind — enables instant health assessment at the top of the report.
Exception-Based Downtime Analysis
Downtime events ranked by total duration with assigned reason codes and affected equipment. The Pareto principle applies: twenty percent of downtime reasons typically drive eighty percent of lost time. Surface the top five reasons prominently rather than burying them in a log that requires manual analysis to extract meaningful patterns.
Quality Metrics by Batch and Product
First-pass yield, scrap quantity, and defect categorization per shift. Quality data must be collected at the point of production — not at final inspection — to enable same-shift corrective action. Trend lines for yield and scrap over the past thirty days provide early warning of quality drift before it reaches customer-critical thresholds.
Action Register with Ownership
Open items from previous shifts with status updates, new issues requiring management attention, and escalated decisions with target resolution dates. The action register transforms the daily report from a historical record into a forward-looking management tool that drives accountability across shifts.
Common Daily Report Mistakes and How to Fix Them
Most plants already produce some form of daily production report, but the value varies dramatically depending on design and execution. The following four pitfalls are the most common reasons daily reports fail to drive improvement.
Too much data buried in dense tables with no variance highlighting
Surface exceptions and variances prominently using color coding and conditional formatting. Readers should find the problem in under five seconds.
Manual transcription errors from end-of-shift recall and whiteboard copying
Connect equipment to automated data collection so machine states, cycle counts, and quality results flow directly into the report without human transcription.
Delayed reporting that reaches managers hours after the morning stand-up
Configure automatic report generation at shift end with midnight delivery. The report reaches stakeholders before they arrive, eliminating the pre-meeting scramble.
Siloed production, quality, and maintenance data that hides cross-functional impacts
Integrate all three data domains into a single report view. A production slowdown caused by a quality issue or a maintenance delay should be visible in context, not buried in a separate report.
iFactory Generates All Four Report Elements Automatically at Every Shift Change
Production summary, exception-based downtime analysis, quality metrics, and an action register — compiled from real-time data without manual entry.
Manual vs Automated Daily Production Reporting
The gap between manual and automated daily reporting is not incremental — it is transformational. The table below compares the two approaches across the five dimensions that determine whether a daily report drives action or simply fills a binder.
| Dimension | Manual | Automated |
|---|---|---|
| Data collection | End-of-shift recall by operators | Real-time machine and sensor data |
| Data accuracy | Estimated at 70-80% reliable | Exceeds 99% accuracy at source |
| Report generation | 45 minutes of manual compilation | Generated instantly at shift end |
| Update frequency | Once daily, often delayed | Continuous, available on demand |
| Error rate | Up to 30% transcription error rate | Less than 1% with automated capture |
How to Transform Your Daily Reporting Process
Moving from a manual daily report to an automated system follows a clear progression. Each phase builds on the previous one and delivers measurable value before the next phase begins.
Compare your existing report against the four essential elements above. Identify which data fields are missing, which contain consistently inaccurate data, and which sections take the most manual effort to produce. Most plants discover at least three gaps between their current report and a complete production picture. Document these gaps as your improvement roadmap.
Connect equipment to automated data capture for machine state, cycle counts, and quality results. This eliminates the primary source of error in manual reporting — human transcription — and makes real-time report generation possible. A single line can typically be connected in one to two days with minimal production disruption.
Set up the report template with your plant's specific sections, metrics, and distribution list. Configure automatic generation at shift end or midnight delivery so the report reaches stakeholders by email or mobile dashboard before the morning meeting begins. This eliminates the pre-meeting scramble and ensures consistent, on-time delivery every day.
Frequently Asked Questions
What is the difference between a daily production report and a shift report?
A daily production report aggregates data across all shifts in a 24-hour period, providing a complete view of the day's production against plan. A shift report covers a single shift and is primarily used for shift handover. Many plants use both: the shift report for operator-level handoff and the daily report for management review and record-keeping. iFactory generates both automatically from the same data source.
How do I eliminate manual data entry errors from my daily report?
Manual data entry errors are eliminated by connecting the daily report to automated data sources. Machine cycle counts replace operator-entered production numbers. Sensor-based state detection replaces manual downtime logging. Automated quality data collection replaces handwritten inspection results. iFactory connects to existing equipment and PLC data to generate reports without manual transcription, reducing the error rate from an industry average of thirty percent to less than one percent.
How long does it take to set up an automated daily production report?
An automated daily production report with iFactory can be configured and generating data within hours of equipment connection. The initial setup includes connecting machines for real-time data collection, configuring the report template with your plant's specific sections and KPIs, and setting the automatic delivery schedule. Full deployment across a facility with multiple lines typically takes two to five days, with each line generating live reports within hours of connection.
What metrics should every daily production report include?
Every daily production report should include planned versus actual output, total downtime with top reasons, OEE percentage, first-pass yield, and shift notes. These five metrics answer the core questions every morning stand-up needs to address: did we hit the plan, what stopped us, how efficient were we, what quality did we produce, and what needs attention today. Additional metrics like labor efficiency and safety incidents can be added once the core five are reliable.
Can I customize the daily report for different roles in my plant?
Yes. An effective reporting system provides role-specific views from the same data set. The operator sees line-level detail and shift notes. The plant manager sees a summary across all lines with exception alerts. The executive sees weekly and monthly trends by facility. iFactory generates role-based daily reports from a single data source without requiring separate configurations for each audience, ensuring consistent data across all levels of the organization.
Book a Demo — See Your Daily Production Report Generated Automatically
iFactory connects to your equipment, configures your report template, and starts generating daily reports without manual data entry. Production summary, downtime analysis, quality metrics, and action register — all automated, all accurate, all delivered on time.