OEE is the one metric that tells you exactly how efficient your manufacturing operation really is. Unlike output alone — which can hide downtime, quality losses, and speed reductions — Overall Equipment Effectiveness distills availability, performance, and quality into a single percentage that plant managers, supervisors, and continuous improvement teams rely on to track improvement. Yet most OEE tracking starts in a spreadsheet: columns for run time, rows for stop events, manual calculations that consume hours each week. An OEE tracker template gives you a structured starting point for capturing the data you need to calculate OEE consistently across every shift and every line. This page covers what a complete OEE tracker template should include, how to use it to identify your biggest losses, and how to move from manual tracking to automated OEE in your plant.
iFactory Captures Availability, Performance, and Quality Automatically from Every Production Line
No manual calculations, no transcription errors, no end-of-shift recall. Your OEE is calculated in real time and reported automatically from machine data.
Understanding the Three Components of Overall Equipment Effectiveness
OEE is the product of three independent factors: Availability, Performance, and Quality. Each factor measures a distinct category of loss, and improving any one of them directly improves your overall OEE score. The formula is simple — OEE = Availability × Performance × Quality — but each component requires specific data that your tracker template must capture.
Measures the percentage of scheduled time the equipment is actually running. The primary loss factor is unplanned downtime — breakdowns, setup adjustments, and material shortages that stop production. Availability is the most visible and often the first target for OEE improvement programs because downtime events are immediately noticeable and directly measurable.
Measures actual operating speed against the equipment design speed. Performance losses include minor stops, reduced speed operation, and operator inefficiency. Unlike downtime, performance losses are often invisible without cycle-time data because the equipment is still running — just slower than it should be.
Measures the percentage of produced parts that meet specification. Quality losses include scrap, rework, and yield reduction during startup or changeover. Quality data must be captured at the point of production rather than at final inspection to provide accurate, timely OEE calculation and loss identification.
What an OEE Tracker Template Should Include
A complete OEE tracker template organizes data into logical sections that map to the three OEE components. The following four capabilities distinguish a template that drives action from a template that merely collects numbers.
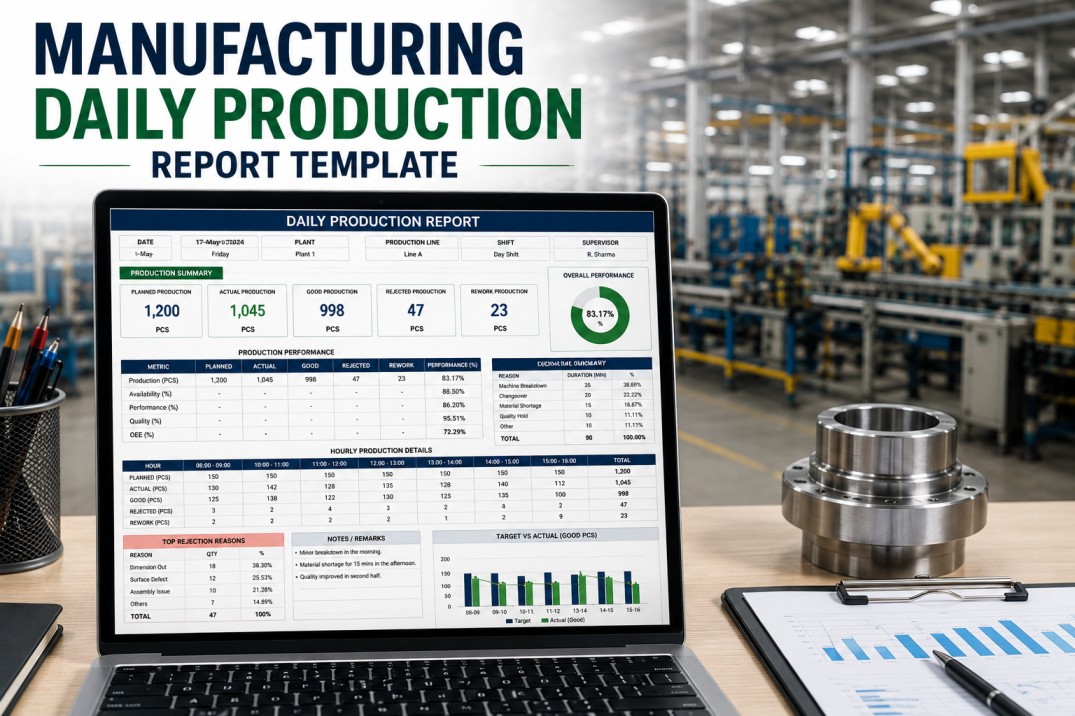
Shift-by-Shift Logging
Date, line or machine identifier, and shift designation as the primary record keys. Each row captures one shift of data with planned time, run time, parts produced, and quality counts. Running totals and week-to-date aggregates calculated automatically.
Downtime Reason Codes
Standardized reason code list for unplanned stops with start and end timestamps. Categorize downtime by type — equipment failure, setup, material shortage, operator absence — and track duration per event. Reason codes enable Pareto analysis of the biggest availability losses.
Quality Yield Tracking
Good parts, reject parts, and defect type recorded per batch or per shift. First-pass yield calculated automatically alongside total quality rate. Defect categorization — material, process, handling — helps identify whether quality losses are systemic or event-driven.
Trend and Comparison Views
Week-over-week and month-over-month OEE trend calculations embedded in the template with conditional formatting to flag declining or improving scores. Side-by-side shift and line comparisons surface performance gaps that might otherwise go unnoticed until quarterly reviews.
iFactory Replaces Your Spreadsheet Template with Real-Time OEE from Every Machine
Your OEE template is a starting point. iFactory makes it automatic — capturing every cycle, every stop, and every quality event without manual entry. See it live in a 30-minute walkthrough.
OEE Tracker — Complete Data Structure
The table below defines every data field your OEE tracker template should include, organized by the calculation step each field supports. Use this structure as a specification when building your template or evaluating an automated alternative.
| Field | Description | Source | Update |
|---|---|---|---|
| Date | Production date for the recorded shift | Auto-generated | Per shift |
| Line / Machine | Equipment identifier for OEE tracking | Fixed list | Static |
| Shift | Shift designation for multi-shift operations | Fixed list | Static |
| Planned production time | Total scheduled run time for the shift | Shift calendar | Per shift |
| Actual run time | Time equipment was in running state | Machine state data | Per event |
| Downtime duration | Total unplanned stoppage time per shift | Event log | Per event |
| Downtime reason | Standardized reason code for each stop | Operator entry | Per event |
| Ideal cycle time | Design cycle time per part from engineering spec | Engineering spec | Static |
| Total parts produced | Actual unit count from machine counter | Machine counter | Per shift |
| Good parts | Parts passing quality inspection | Quality system | Per batch |
| Reject parts | Non-conforming parts scrapped or reworked | Quality system | Per batch |
| Availability % | Run time ÷ planned production time | Calculated | Per shift |
| Performance % | (Ideal cycle × total parts) ÷ run time | Calculated | Per shift |
| Quality % | Good parts ÷ total parts produced | Calculated | Per shift |
| OEE % | Availability × Performance × Quality | Calculated | Per shift |
Four Steps to Deploy Your OEE Tracker Template
Getting accurate OEE data from your template requires a structured rollout. Skip any of these steps and your OEE numbers will include gaps, miscategorizations, or calculation errors that undermine the entire tracking effort.
Set up the template with your specific lines, shifts, and reason codes. Configure cycle times from engineering specs for each product or machine. Establish planned production time per shift based on your actual schedule rather than theoretical maximum.
Instruct each shift on how to record downtime events with correct reason codes, timestamps, and part counts. Consistency across shifts is the single biggest determinant of OEE data quality. A five-minute end-of-shift data review catches entry errors before they pollute the trend.
Run the template alongside your existing tracking method for two weeks. Compare calculated OEE values and investigate discrepancies. Adjust reason code mappings or cycle time assumptions based on what the validation reveals before relying on template data for decisions.
Review OEE trends every week with the production team. Identify which of the three OEE components is the biggest loss driver and which specific reason code or defect type contributes most. Prioritize one loss category at a time and track whether your improvement actions move the OEE number.
Frequently Asked Questions
What is the difference between OEE and overall line efficiency?
OEE measures how effectively equipment performs against its designed capability across three independent factors: availability, performance, and quality. Overall line efficiency is a broader metric that includes factors beyond the equipment itself — material flow, labor utilization, changeover time, and batch scheduling — to measure how effectively the entire production line converts inputs into output. OEE focuses on equipment effectiveness; line efficiency considers the complete production system including people, process, and materials.
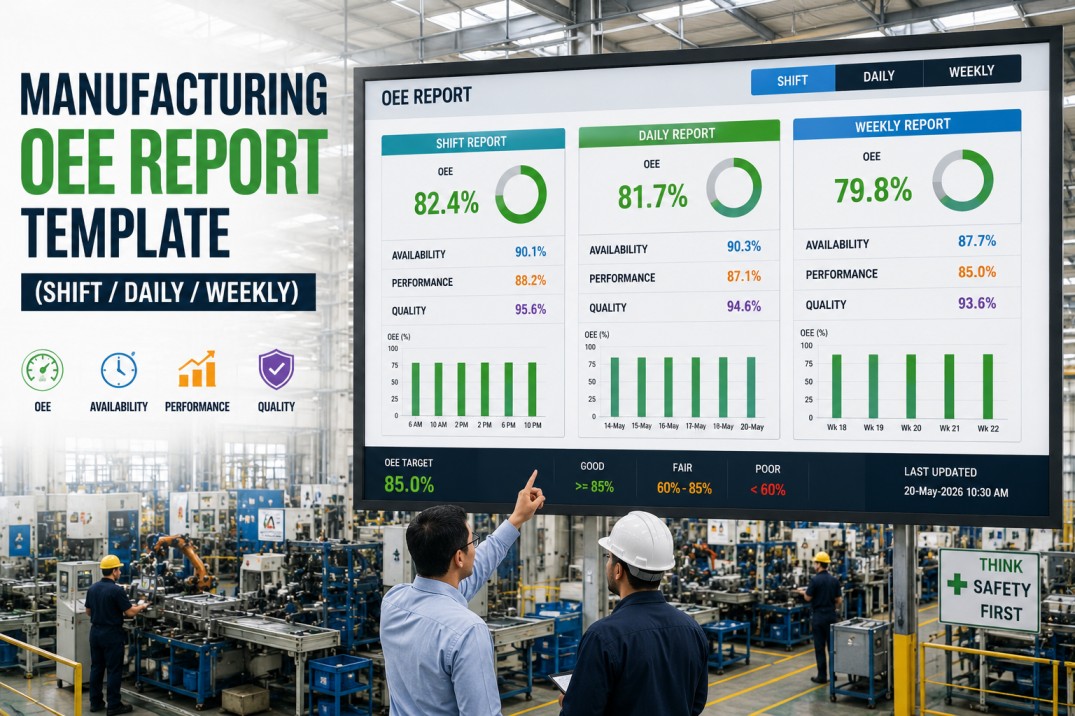
How often should OEE be calculated for each production line?
OEE should be calculated at least once per shift for every production line. Shift-level calculation provides sufficient granularity to identify performance trends and respond to issues while they are still fresh. Daily aggregation across shifts gives the plant manager a complete view. Weekly and monthly trends reveal whether improvement initiatives are working. Real-time OEE calculation — updated with every machine cycle — is the ideal state because it enables immediate response to emerging losses before they compound across a full shift.
What is a realistic OEE target for a small manufacturing plant?
A realistic OEE target for a small or mid-size manufacturing plant starts at the current baseline plus three to five percentage points. Industry data shows the average discrete manufacturing plant operates at approximately 60% OEE. A reasonable first-year target is 65%, achievable by addressing the single largest loss category — typically availability from unplanned downtime. World-class OEE is 85%, but that benchmark reflects top-quartile performance in high-volume, highly automated industries and is not an appropriate short-term target for most small to mid-size plants.
Can I track OEE accurately without automated sensor data?
Yes, you can track OEE manually using a well-designed template, but accuracy depends entirely on operator discipline. Manual OEE tracking requires operators to record run time, stop events with durations, and part counts at consistent intervals throughout the shift. The risk is that minor stops — those under five minutes — are frequently forgotten, and end-of-shift recall introduces systematic errors in both duration and frequency. A manual template is an excellent starting point for understanding the OEE framework and building the habit of data collection, but automated tracking is necessary for reliable, decision-grade OEE data.
How do I identify the biggest OEE loss using the tracker template?
Use the tracker template to calculate each of the three OEE components separately. The component with the lowest percentage is your biggest loss category. Within that category, drill into the underlying data: for availability, sort downtime reasons by total duration to identify the most costly stop types. For performance, compare actual cycle times to ideal across products and shifts. For quality, rank defect types by scrap quantity. The combination of lowest component and highest subcategory gives you a clear, data-supported improvement target to work on first.
Book a Demo — See Your OEE Calculated Automatically in Real Time
iFactory connects to your equipment, captures every production event, and calculates OEE automatically across all three components. No manual templates, no end-of-shift data entry, no calculation errors. See it live with your plant data in a 30-minute walkthrough.