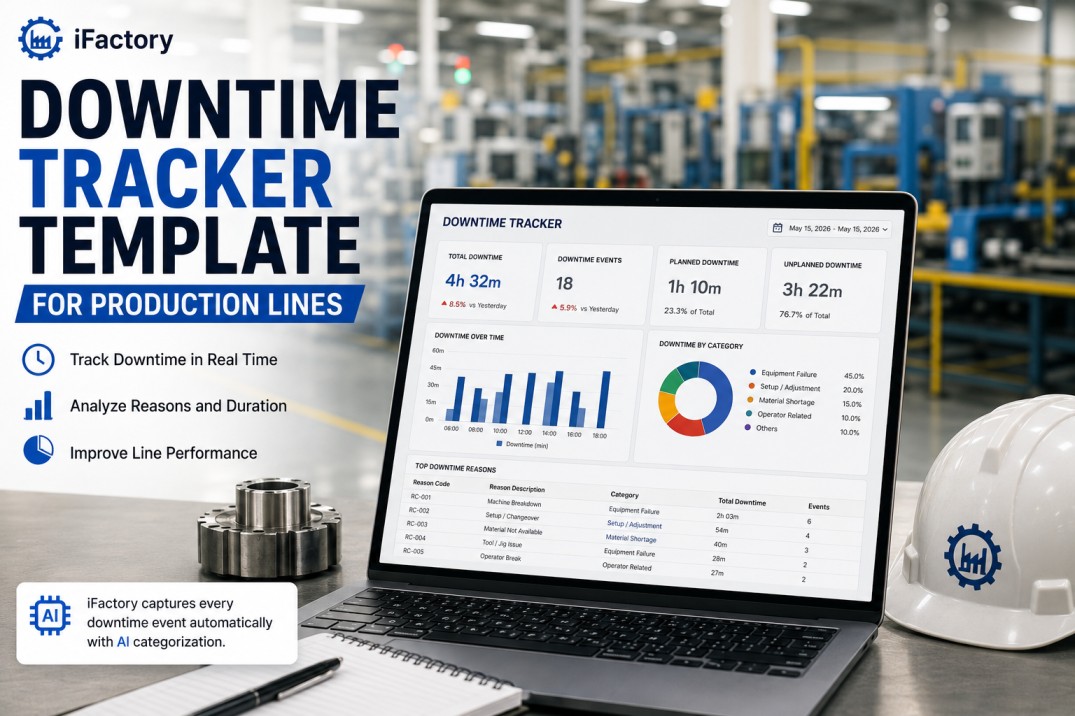
A downtime tracker template is the structured log that captures every production stop with the timestamp, duration, equipment identification, and reason code needed to calculate OEE Availability, identify chronic failure modes, and prioritise maintenance and improvement investment. The difference between a downtime tracker that drives improvement and one that just records losses is entirely in the reason code structure: a tracker where 35% of events are coded "Other" or "Unknown" produces a Pareto that shows "Other" as the top downtime cause — which is operationally useless. This template provides the complete downtime tracker field structure, a worked example log, a reference reason code hierarchy, and the analysis calculations — MTBF, MTTR, and Pareto — that turn downtime event data into reliability improvement priorities.
Every Downtime Event Auto-Captured With AI Categorisation
iFactory captures downtime events from PLCs — timestamp, duration, and asset ID automatic — with AI-assisted reason code suggestion for clean Pareto analysis.
Downtime Tracker — Live Event Log & Pareto Example
The tracker below shows a shift downtime log for VMC Cell 4 with four events — including a repeat drive fault that triggered an automatic RCA escalation flag. The Pareto panel shows the week's downtime ranked by total duration, with MTBF and MTTR summary at the bottom.
Downtime Tracker Field Structure
A complete downtime tracker requires seven fields per event: asset ID, start timestamp, end timestamp, duration, reason code, responsible party, and a notes or action field. Duration should be auto-calculated from timestamps wherever possible — manual duration entry introduces rounding errors that compound across hundreds of events and corrupt MTBF calculations. The reason code field is the most important: a free-text notes field is not a reason code. Only a structured selection from a defined list enables Pareto analysis and trend identification.
Asset ID
The machine, line, or cell that stopped. Uses the consistent asset identifier from your maintenance system — not "the big CNC" or "VMC next to stores". Consistent naming is what enables asset-level MTBF calculation.
Start Timestamp
Time of stop to the minute — recorded at the moment of occurrence, not estimated at shift end. Accurate timestamps enable true MTBF calculation and identify time-of-day patterns in failure occurrence.
End Timestamp
Time of restart to the minute. Auto-calculated duration = end − start. If the machine restarts but the root cause is not resolved (temporary fix pending maintenance), note this in the action field.
Duration (auto-calculated)
End timestamp minus start timestamp in minutes. Auto-calculation prevents rounding errors. Any event over 60 minutes should have an action or work order reference.
Reason Code (2-level)
Selection from the structured reason code hierarchy — Level 1 category (Electrical, Mechanical, Tooling, Process, Material, Changeover, Operator) and Level 2 specific cause. Free-text notes supplement but do not replace the reason code.
Action / WO Reference
What happened in response: maintenance work order raised, temporary fix applied, awaiting parts, no action required. Work order number referenced where applicable — links downtime event to maintenance record.
Downtime Log — Worked Example
The example below shows a shift downtime log for a machining cell with five events. The repeat VMC-04 drive fault at events 001 and 004 — same asset, same reason code, 37-minute duration each — is the type of repeat failure pattern that must trigger a formal root cause analysis. In a paper-based tracker, this pattern requires manual review to identify. In a digital tracker like iFactory, repeat events on the same asset with the same reason code are automatically flagged when the threshold (typically three occurrences in 30 days) is crossed.
| # | Asset ID | Start Time | End Time | Duration (min) | Reason Code | Sub-system | Responsible | Action |
|---|---|---|---|---|---|---|---|---|
| 001 | VMC-04 | 07:14 | 07:51 | 37 | Electrical → Drive fault | Electrical | Maintenance | WO #4421 raised |
| 002 | VMC-04 | 09:33 | 09:41 | 8 | Tooling → Insert change | Tooling | Operator | Preventive — schedule |
| 003 | CMM-01 | 10:05 | 10:09 | 4 | Process → Part load jam | Process | Operator | Fixture adjusted |
| 004 | VMC-04 | 13:18 | 13:55 | 37 | Electrical → Drive fault | Electrical | Maintenance | Root cause investigation — repeat event |
| 005 | Assy-02 | 14:42 | 15:03 | 21 | Material → Component shortage | Material | Process | Stores replenishment raised |
This shift produced 119 minutes of total downtime across five events. The VMC-04 drive fault (events 001 and 004) accounts for 74 minutes — 62% of total downtime from a single failure mode on a single asset. This is the improvement priority. A maintenance investigation into the VMC-04 drive fault root cause and a scheduled drive replacement or inspection would eliminate the majority of this line's Availability loss.
Reason Code Hierarchy — Build It From Your Data
The reason code hierarchy is the structural element of a downtime tracker that most directly determines whether the tracker produces actionable analysis or a useless aggregation. The hierarchy below is a standard manufacturing reference — it must be customised to your actual equipment failure modes before use. Build the Level 2 specific causes from your historical downtime records: what are the actual reasons your machines stop? Use the names your maintenance team and operators use, not generic engineering terminology.
| Level 1 Category | Level 2 — Specific Cause | Responsible Party |
|---|---|---|
| Electrical | Drive fault / Motor fault / Sensor fault / Control panel fault / Wiring fault | Maintenance |
| Mechanical | Bearing failure / Shaft wear / Seal failure / Coupling fault / Structural damage | Maintenance |
| Tooling | Insert wear / Tool breakage / Holder damage / Fixture fault / Gauge failure | Operator / Maintenance |
| Process | Part jam / Chip accumulation / Coolant blockage / Program error / Setup error | Operator |
| Material | Component shortage / Wrong part / Non-conforming material / Packaging fault | Supply / Process |
| Changeover | Product changeover / Tool change / Programme change / Fixture change | Operator |
| Operator | Absence / Skill gap / Method deviation / Unauthorised stop | Supervisor |
Downtime Analysis — MTBF, MTTR, and Pareto
Three calculations convert a downtime event log into reliability management data: Mean Time Between Failures (MTBF), Mean Time To Repair (MTTR), and a Pareto of downtime by reason code. MTBF and MTTR are the standard maintenance reliability metrics — together they define the reliability and maintainability of each asset class. The Pareto identifies which failure modes consume the most production time and therefore represent the highest-value improvement targets.
MTBF = Operating Time / Number of Failure Events. A VMC-04 running 400 hours per month with 8 unplanned failures has an MTBF of 50 hours. A declining MTBF trend month-over-month is an early signal for predictive maintenance intervention. MTBF is calculated per asset and per equipment class — not as a plant average that hides the worst performers.
MTTR = Total Repair Time / Number of Events. A high MTTR on a specific failure category indicates: wrong spare parts on hand, technician skill gap, undocumented repair procedure, or a diagnostic process that takes too long. MTTR improvement is a maintenance efficiency target — separate from MTBF improvement, which is a reliability target.
Sort the downtime event log by reason code, sum the total duration per code, and rank from highest to lowest. The top three reason codes typically account for 60–80% of total downtime. These three — and only these three — should receive active improvement projects in any given month. Spreading improvement effort across 15 reason codes simultaneously achieves nothing on any of them.
Any asset with the same reason code appearing three or more times in 30 days is a chronic failure requiring root cause analysis — not another reactive repair. The temporary fix that resolved events 001 and 004 in the worked example did not address the root cause. Formal investigation, a permanent corrective action, and a PM update are required before the third event becomes a production crisis.
Replace Excel Downtime Logs With Automatic PLC Capture
iFactory captures downtime from PLC signals, assigns reason codes with AI, and calculates MTBF / MTTR / Pareto automatically.
Downtime Tracker Implementation Checklist — 25 Items
Use this checklist when setting up or auditing a production downtime tracker. Items cover system scope, event capture fields, reason code quality, analysis calculations, and review cadence.
| # | Checklist Item | Type | Priority | Photo | Required | Critical |
|---|---|---|---|---|---|---|
| 1 | Asset / line scope defined — each tracked asset has a unique ID in the tracker | Pass/Fail | High | — | ✓ | ✓ |
| 2 | Minimum event duration threshold defined — stops below threshold handled separately | Pass/Fail | High | — | ✓ | ✓ |
| 3 | Planned vs. unplanned downtime categories defined — tracker separates them | Pass/Fail | High | — | ✓ | ✓ |
| 4 | Reason code list built from historical failure data — not a generic template | Pass/Fail | High | — | ✓ | ✓ |
| 5 | Data entry responsibility assigned: operator, maintenance tech, or supervisor | Pass/Fail | High | — | ✓ | ✓ |
| # | Checklist Item | Type | Priority | Photo | Required | Critical |
|---|---|---|---|---|---|---|
| 6 | Asset ID — which machine or line stopped | Selection | High | — | ✓ | ✓ |
| 7 | Start timestamp — time of stop recorded at the moment of occurrence | Pass/Fail | High | — | ✓ | ✓ |
| 8 | End timestamp — time of restart recorded at the moment of restart | Pass/Fail | High | — | ✓ | ✓ |
| 9 | Downtime duration (auto-calculated or manually entered) in minutes | Numeric | High | — | ✓ | ✓ |
| 10 | Reason code — from the structured 2-level hierarchy, not free text | Selection | High | — | ✓ | ✓ |
| 11 | Responsible party: maintenance / operator / process / material / changeover | Selection | High | — | ✓ | ✓ |
| # | Checklist Item | Type | Priority | Photo | Required | Critical |
|---|---|---|---|---|---|---|
| 12 | "Other" reason code usage below 5% of all events — if higher, code list needs review | Pass/Fail | High | — | ✓ | ✓ |
| 13 | Reason codes reviewed monthly — new failure modes added within 5 working days of first occurrence | Pass/Fail | High | — | ✓ | ✓ |
| 14 | Two-level hierarchy used: category (Electrical) → specific cause (Drive fault) | Pass/Fail | High | — | ✓ | ✓ |
| 15 | Changeover coded as separate category from unplanned breakdown | Pass/Fail | High | — | ✓ | ✓ |
| 16 | Sub-system field populated (electrical / mechanical / tooling / process / material) | Pass/Fail | Med | — | ✓ | — |
| # | Checklist Item | Type | Priority | Photo | Required | Critical |
|---|---|---|---|---|---|---|
| 17 | Daily total downtime per asset calculated — or auto-summed in tracker | Numeric | High | — | ✓ | ✓ |
| 18 | Daily Pareto of downtime by reason code generated — top 3 causes identified | Pass/Fail | High | — | ✓ | ✓ |
| 19 | MTBF calculated per asset: operating hours / number of failure events | Numeric | High | — | ✓ | ✓ |
| 20 | MTTR calculated per cause category: total repair time / number of events | Numeric | High | — | ✓ | ✓ |
| 21 | Repeat events (same asset, same code, 3+ in 30 days) flagged for RCA | Pass/Fail | High | — | ✓ | ✓ |
| # | Checklist Item | Type | Priority | Photo | Required | Critical |
|---|---|---|---|---|---|---|
| 22 | Shift downtime summary reviewed at shift handover — top cause noted | Pass/Fail | High | — | ✓ | ✓ |
| 23 | Weekly Pareto reviewed in production meeting — top cause has an assigned owner and action | Pass/Fail | High | — | ✓ | ✓ |
| 24 | Actions from downtime review tracked to closure — not just noted and forgotten | Pass/Fail | High | — | ✓ | ✓ |
| 25 | Monthly data quality spot-check — manual entries verified against machine signal data | Pass/Fail | Med | — | ✓ | — |
Frequently Asked Questions
What fields should a downtime tracker template include?
A complete downtime tracker template must include: asset ID (which machine stopped), start timestamp, end timestamp, duration (auto-calculated), reason code from a structured 2-level hierarchy, responsible party (maintenance / operator / process / material), and an action/work-order field. Free-text notes fields supplement but do not replace the structured reason code. Trackers with free-text only produce unanalysable data. Every field must be completed for every event — partial records corrupt MTBF calculations and Pareto analysis.
What is MTBF in manufacturing downtime tracking?
MTBF (Mean Time Between Failures) is the average time between unplanned production stops for a specific machine or equipment class. MTBF = total operating time / number of unplanned failure events. A machine running 400 hours per month with 8 failures has an MTBF of 50 hours. Declining MTBF is an early warning signal for predictive or preventive maintenance intervention. MTBF is most useful when tracked per asset over time as a trend — a single MTBF figure in isolation has limited value without a baseline for comparison.
How should downtime reason codes be structured?
Downtime reason codes should be structured in a two-level hierarchy: Level 1 is the broad failure category (Electrical, Mechanical, Tooling, Process, Material, Changeover, Operator) and Level 2 is the specific cause within the category (Electrical → Drive fault, Bearing failure, Sensor fault). The Level 2 codes should be built from your actual historical failure data — using terminology your maintenance team and operators recognise. Generic reason codes from a template produce low usage quality; codes built from actual failure history produce the Pareto that drives real improvement. Book a Demo to see iFactory's reason code configuration.
What is the minimum downtime duration that should be tracked?
Define a minimum threshold before starting — typically 2 to 5 minutes. Stops below the threshold are either excluded or tracked as minor stoppages in a separate category. The threshold should be consistent across all assets. A threshold that is too low (30 seconds) produces thousands of micro-events that overwhelm the tracker and mask the significant events. A threshold that is too high (15 minutes) misses the chronic short-stop patterns that in aggregate consume more production time than single long breakdowns. Most manufacturing operations set the threshold at 2 to 5 minutes.
How does iFactory automate downtime tracking?
iFactory captures downtime events directly from machine PLC signals — when a machine stops, the start timestamp is captured automatically. When it restarts, the end timestamp is captured automatically. Duration is auto-calculated. The operator or maintenance technician selects the reason code from the structured hierarchy on a mobile device or workstation. iFactory AI suggests the most likely reason code based on the asset and time of day pattern from historical data, reducing entry time while maintaining code quality. MTBF, MTTR, and Pareto are calculated automatically and visible on the shift dashboard. Book a Demo to see the downtime module.
Replace Downtime Excel Sheets With Auto Event Capture
iFactory captures downtime from machine signals, assigns reason codes with AI, and calculates MTBF / MTTR / Pareto — every event logged, every trend visible.