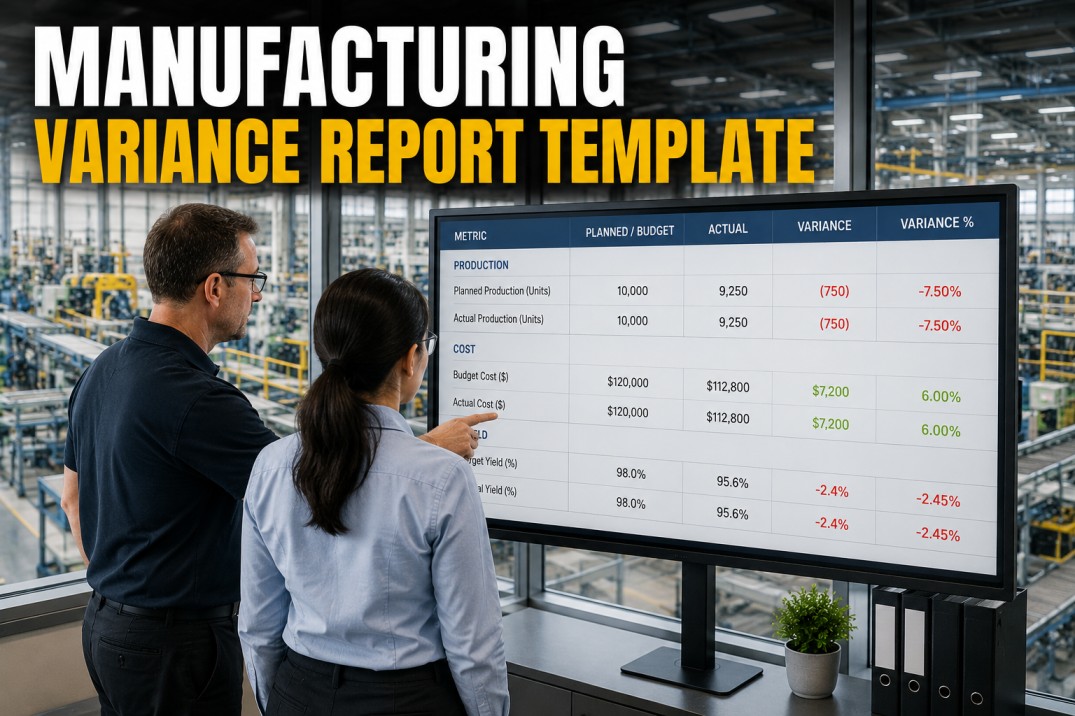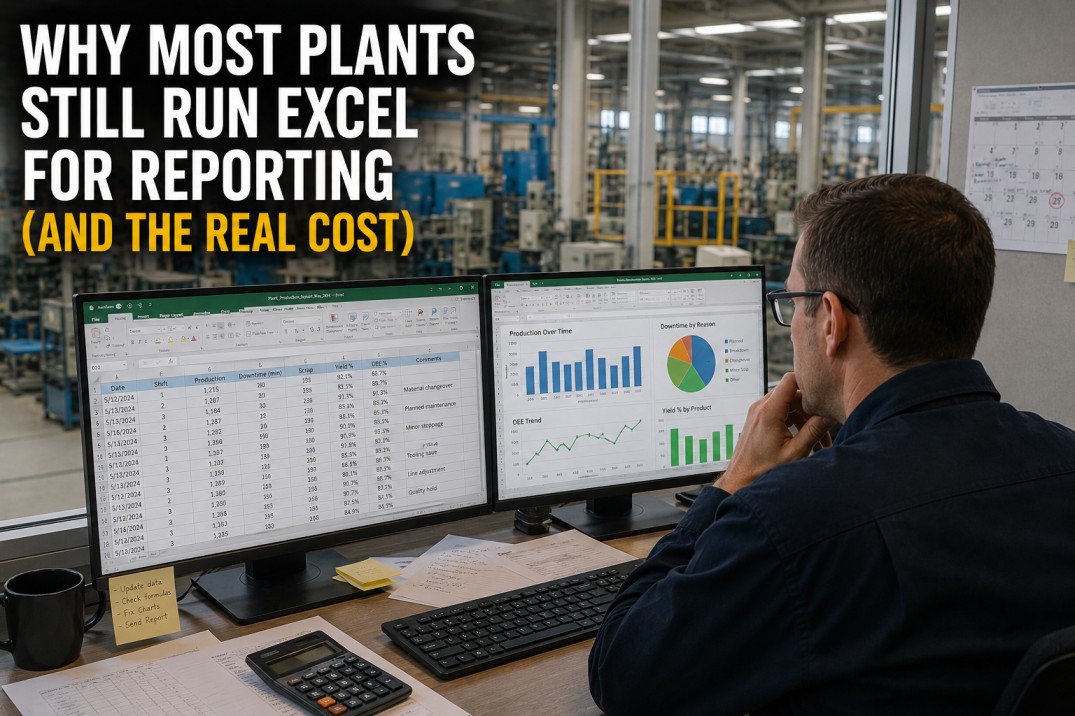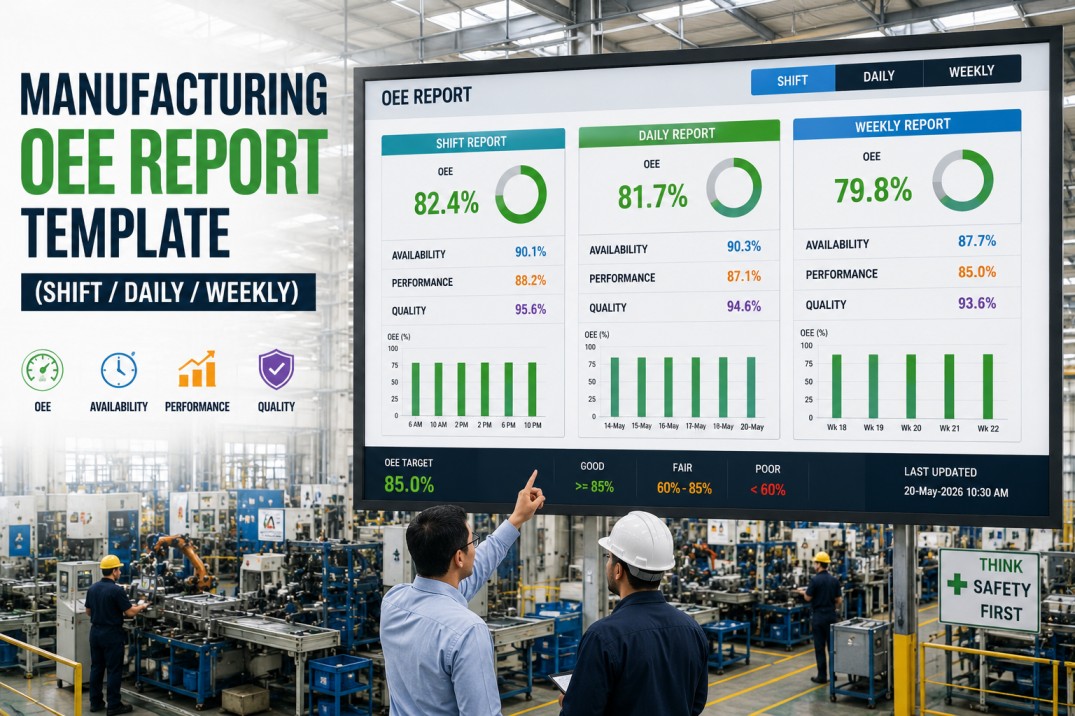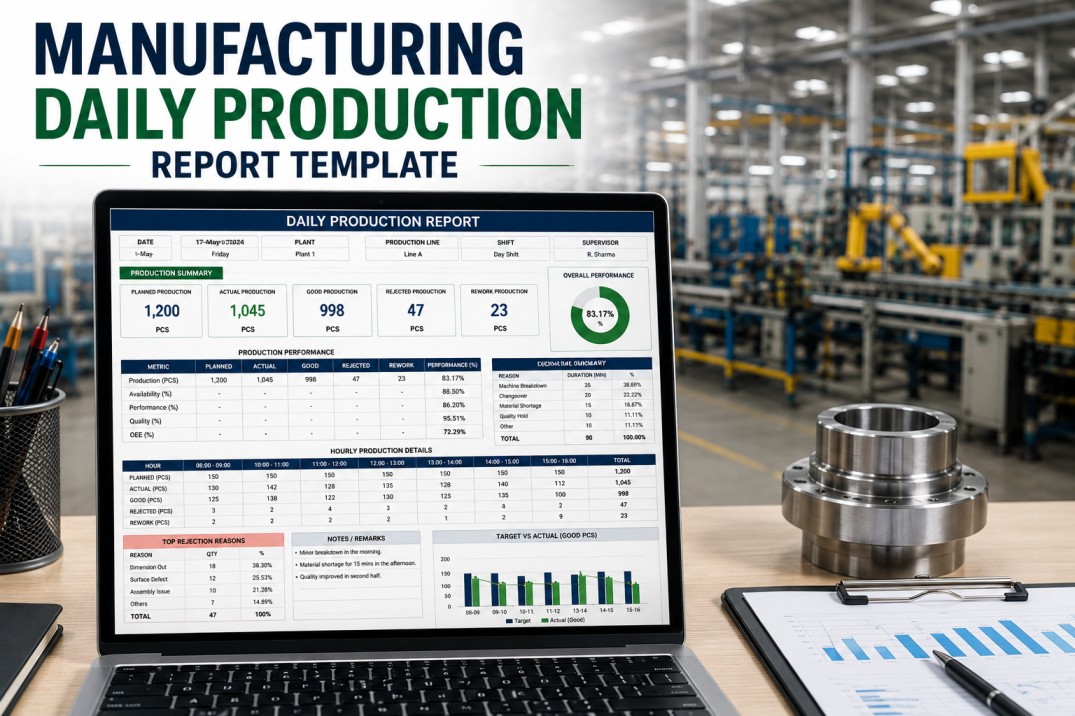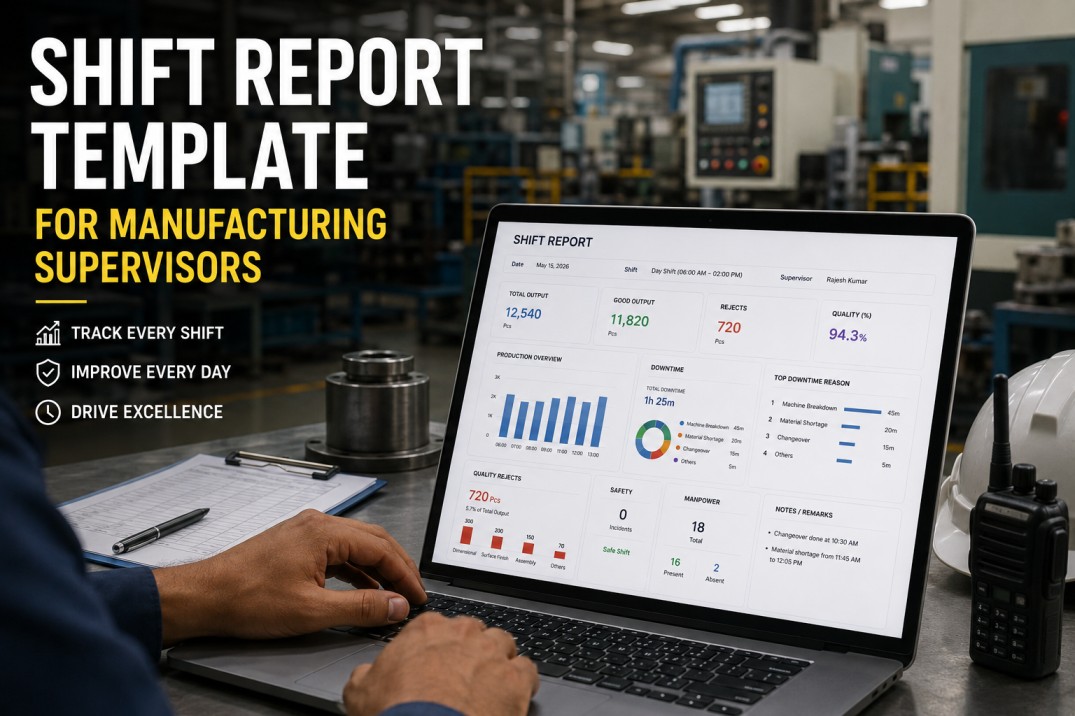
A production report template is the daily operational record that closes the loop between what the production schedule required and what the factory actually delivered — capturing output, downtime, scrap, quality, and shift notes in a single document that supervisors, production managers, and plant leaders use to manage performance and make the following day's decisions. The quality of a production report is not determined by its format; it is determined by the accuracy of the data it contains and the discipline with which it is completed at shift end. This page gives manufacturing supervisors and operations teams a complete daily production report template with every section, field definition, and completion standard — and explains how iFactory auto-generates production reports from live data, eliminating the manual entry that makes paper-based production reports unreliable.
Auto-Generate Production Reports — Complete at Shift End
iFactory builds your daily production report in real time from machine counters, downtime events, and inspection records. The report is complete the moment the shift ends.
Production Report Header — Identification and Accountability
Every production report must open with complete identification: date, shift, production line or cell, supervisor name, and the production orders covered by the report. Without complete header information, a production report cannot be traced to a specific shift when reviewed by a production manager, quality auditor, or customer representative. The header also establishes accountability — the supervisor who signs the report is the person who validates its accuracy, and that name must appear on every report regardless of whether the report is completed on paper, in a spreadsheet, or through a digital platform.
Report Date and Shift
Date in a consistent format (YYYY-MM-DD) and shift designation (Day / Afternoon / Night, or Shift 1/2/3). Consistent format enables digital sorting and historical search.
Line and Cell Identification
Production line name or number and cell or workstation identifier. Consistent naming — the same line is always called "Line 4" not "Line 4 / L4 / CNC Cell 4" depending on who completes the report.
Production Orders Covered
All work order or production order numbers active during the shift. Links the output quantities to the ERP production order — essential for WIP traceability and cost accounting.
Supervisor ID and Name
The supervisor responsible for the shift. This person validates every figure in the report. If a figure is disputed later, this person is the primary reference.
Shift Time Window
Exact start and end time of the shift reported. Critical for downtime duration calculations, hourly output analysis, and overtime boundary accounting.
Product Mix Summary
All part numbers produced in the shift with quantities per part. A shift producing multiple products requires a line per product, not a single total output figure that obscures product-level performance.
Output and Schedule Performance
The production output section compares actual units produced against the shift target, calculates schedule attainment, and documents the cause of any shortfall. Schedule attainment — actual output divided by target output — is the single most important performance indicator in a daily production report. A plant where schedule attainment is consistently below 95% without documented root causes and corrective actions is not managing its production performance — it is recording it.
Shift Target Output
The production schedule quantity for this shift and product — from the planning system, not estimated by the supervisor. Estimated targets produce unreliable schedule attainment figures.
Actual Output — Good Count Only
Units produced and confirmed good by end of shift. Not total units produced — rework and scrap are separate fields. Good count is the production output that counts toward the customer order.
Schedule Attainment %
Actual good count divided by shift target multiplied by 100. Calculated consistently using the same formula on every shift, every line.
Shortfall Root Cause
When schedule attainment is below 100%, the root cause must be documented — not left blank. Common causes: unplanned downtime (reference downtime section), material shortage, quality hold, staffing, changeover overrun.
Hourly Output Tracking
Cumulative output recorded at each hour mark during the shift. Hourly tracking identifies performance degradation mid-shift — not visible in end-of-shift totals alone.
Output vs. Prior Shift
Comparison of this shift's output to the same line's output in the previous equivalent shift. Trend context for shift supervisors and production managers.
Downtime and Stoppages
The downtime section is the diagnostic heart of a production report. Every unplanned stop that occurred during the shift must be recorded with a start time, end time, duration, and reason code. A production report that records only "total downtime: 47 minutes" without the individual events, their times, and their causes provides no useful information for reliability improvement or shift-to-shift learning. The downtime section of the production report feeds the OEE Availability calculation and the maintenance Pareto — it must be complete and accurate.
A downtime total without individual events is data, not information. The production report downtime section must list each stop as a separate row: start time, end time, duration, equipment, and reason code. This is the minimum required for a Pareto analysis that identifies the top downtime cause for the shift.
Changeover time and unplanned breakdown time are two different types of loss with two different improvement paths. Record them in separate fields. A production report that combines them into a single "downtime" figure prevents the plant from distinguishing a SMED opportunity from a maintenance reliability problem.
A single downtime event that consumed 30 minutes or more of shift time is significant enough to require a documented response: either a corrective action taken, a work order raised for maintenance, or an escalation to the production manager. Production reports with long downtime events and no corresponding action are incomplete.
The downtime data in the production report is the source of OEE Availability for the shift. If downtime is underreported or inaccurately recorded, the OEE Availability figure is wrong — and every improvement decision made from OEE data will be based on a false picture of the line's performance.
Quality, Scrap, and Rework
The quality section records first-pass yield, scrap count by reason code, and rework count for the shift. Including rework in the quality section is non-negotiable — a unit that fails first inspection and requires rework before it can ship is a quality loss, not a good unit. Production reports that capture only final scrap and omit rework systematically overstate quality performance and hide a significant element of production cost.
Scrap Count by Part and Reason
Total scrapped units per part number with reason code for each rejection. No unclassified scrap — every rejected unit has a documented cause.
Rework Count and Result
Units sent to rework: how many, for what reason, and the outcome — rework accepted, scrap after rework, or pending. Separate from scrap count.
First-Pass Yield
Good count divided by total count (good + scrap + rework) × 100. The most honest single quality metric for a shift.
Scrap Rate vs. Target
Shift scrap rate compared to the line's target scrap rate. Any shift above target scrap rate requires a noted cause and response.
New or Unusual Defect Types
Any defect type appearing for the first time or at higher frequency than normal flagged in the comments field. Early detection of quality trends enables rapid response.
NCR Reference if Raised
If any quality event during the shift resulted in a non-conformance report, the NCR number is referenced in the quality section so the production report and quality record are linked.
Shift Close, Safety, and Handover
The shift close section ensures that safety events are documented, open actions from the previous shift are reviewed and updated, and new actions for the incoming shift are clearly communicated. The handover is where production continuity either happens or breaks down. A production report that ends at the quality section without a structured handover block leaves the incoming supervisor without a clear picture of what was left unresolved and what requires immediate attention.
All safety incidents, near misses, and first-aid events recorded in the shift — or explicitly noted as zero-incident shift. A blank safety field is ambiguous and unacceptable.
Open actions from the previous shift's production report reviewed and status updated: closed, in progress, or still open with new escalation if required.
Any actions requiring follow-up by the incoming shift — maintenance follow-up, quality hold review, customer communication — documented with priority level and owner.
Completing supervisor signs and dates the report. Digital e-signature with timestamp preferred — provides audit trail and prevents backdating.
Production report distributed to production manager, quality manager, and maintenance (for any downtime events requiring follow-up) by end of shift. iFactory distributes automatically on supervisor sign-off.
Replace Excel Reports With Auto-Generated Digital Reports
iFactory builds the production report in real time from shift data — output, downtime events, inspection results, OEE. Complete and distributed on supervisor sign-off.
Production Report Completion Checklist — 25 Items
Use this checklist to verify production report completeness before sign-off. Every item must be completed on every shift. Incomplete reports should not be accepted by the production manager.
| # | Checklist Item | Type | Priority | Photo | Required | Critical |
|---|---|---|---|---|---|---|
| 1 | Report date, shift, and line/cell number recorded at the top of each report | Pass/Fail | High | — | ✓ | ✓ |
| 2 | Supervisor name and ID recorded — responsible for report accuracy and sign-off | Pass/Fail | High | — | ✓ | ✓ |
| 3 | Production order numbers linked to output quantities — traceability to work orders | Pass/Fail | High | — | ✓ | ✓ |
| 4 | Product / part numbers and descriptions recorded for each production run in the shift | Pass/Fail | High | — | ✓ | ✓ |
| 5 | Report time period clearly stated: shift start to shift end with exact times | Pass/Fail | Med | — | ✓ | — |
| # | Checklist Item | Type | Priority | Photo | Required | Critical |
|---|---|---|---|---|---|---|
| 6 | Target output for shift recorded — based on production schedule, not estimate | Numeric | High | — | ✓ | ✓ |
| 7 | Actual output recorded — units produced and confirmed good by end of shift | Numeric | High | — | ✓ | ✓ |
| 8 | Schedule attainment calculated: actual / target × 100 — result recorded as % | Numeric | High | — | ✓ | ✓ |
| 9 | Reason for any shortfall vs. schedule documented with specific cause — not blank | Text | High | — | ✓ | ✓ |
| 10 | Cumulative shift output tracked hourly — not only end-of-shift total | Numeric | Med | — | ✓ | — |
| # | Checklist Item | Type | Priority | Photo | Required | Critical |
|---|---|---|---|---|---|---|
| 11 | Total unplanned downtime duration recorded in minutes for the shift | Numeric | High | — | ✓ | ✓ |
| 12 | Each downtime event logged with start time, end time, and reason code | Pass/Fail | High | — | ✓ | ✓ |
| 13 | Changeover time recorded separately from unplanned downtime | Numeric | High | — | ✓ | ✓ |
| 14 | OEE Availability impact calculated from downtime total — or linked to OEE report | Pass/Fail | Med | — | ✓ | — |
| 15 | Any downtime event exceeding 30 minutes has corrective action or escalation noted | Pass/Fail | High | — | ✓ | ✓ |
| # | Checklist Item | Type | Priority | Photo | Required | Critical |
|---|---|---|---|---|---|---|
| 16 | Total scrap count recorded by part number for the shift | Numeric | High | — | ✓ | ✓ |
| 17 | Scrap reason codes used for every rejection — no unclassified scrap | Pass/Fail | High | — | ✓ | ✓ |
| 18 | Rework count recorded separately from scrap — units reworked and result | Numeric | High | — | ✓ | ✓ |
| 19 | First-pass yield calculated for shift: good / total × 100 | Numeric | High | — | ✓ | ✓ |
| 20 | Any quality trend or spike noted in comments — especially new defect types | Pass/Fail | Med | — | ✓ | — |
| # | Checklist Item | Type | Priority | Photo | Required | Critical |
|---|---|---|---|---|---|---|
| 21 | Safety incidents or near misses recorded — zero-incident shifts explicitly noted as such | Pass/Fail | High | — | ✓ | ✓ |
| 22 | Open actions from previous shift reviewed and status updated | Pass/Fail | High | — | ✓ | ✓ |
| 23 | New actions for incoming shift documented with owner and priority | Text | High | — | ✓ | ✓ |
| 24 | Supervisor sign-off with date and time on completed report | Pass/Fail | High | — | ✓ | ✓ |
| 25 | Report submitted to production manager or management system by end of shift | Pass/Fail | Med | — | ✓ | — |
Frequently Asked Questions
What should a daily production report include?
A complete daily production report includes: report header (date, shift, line, supervisor), production output (target, actual, schedule attainment %, shortfall cause), downtime events (each stop with start/end time, duration, reason code), quality data (scrap count by reason, rework count, first-pass yield), safety events or zero-incident notation, and shift handover notes with open actions for the incoming shift. A production report missing any of these sections is incomplete and should not be accepted as the official shift record.
What is the difference between a production report and a shift report?
In most manufacturing contexts the terms are used interchangeably. A production report emphasises output and productivity — schedule attainment, units produced, OEE. A shift report often has a broader scope including safety events, personnel issues, maintenance activities, and handover notes. iFactory generates both from the same live data source — the output format can be configured for the audience: a production report for the production manager and a shift report for the shift supervisor.
How often should production reports be completed?
Production reports should be completed at the end of every shift, without exception. In operations running 24/7 on three shifts, this means three reports per day per production line. Production reports completed the following morning from memory are significantly less accurate than reports completed while shift data is still current. iFactory generates the production report automatically at shift end, eliminating the end-of-shift completion workload entirely.
What is schedule attainment and how is it calculated?
Schedule attainment is the ratio of actual good output to planned target output for a shift, expressed as a percentage. Calculation: schedule attainment % = (actual good units / planned target units) × 100. A schedule attainment of 100% means the line produced exactly what the production plan required. Below 100% means the line fell short of the plan. Schedule attainment below 95% consistently over multiple shifts is a signal that either the production plan is unrealistic for the line's current capability or there is a recoverable efficiency loss that needs investigation.
How does iFactory replace a production report template?
iFactory replaces the production report template by capturing every data point in real time during the shift — machine counter output against the production order target, timestamped downtime events with reason codes, inspection results for scrap and rework, and calculated OEE. When the supervisor signs off at shift end, iFactory has already assembled the complete production report and distributes it automatically to the configured management recipients. There is no manual data entry, no end-of-shift transcription from scratch, and no risk of inaccuracy from memory reconstruction. Book a Demo to see the production report output. Book a Demo
Replace Manual Reports With iFactory Live Shift Reporting
iFactory auto-generates daily production reports from live data — schedule attainment, downtime, scrap, and OEE. The report is distributed automatically on supervisor sign-off.