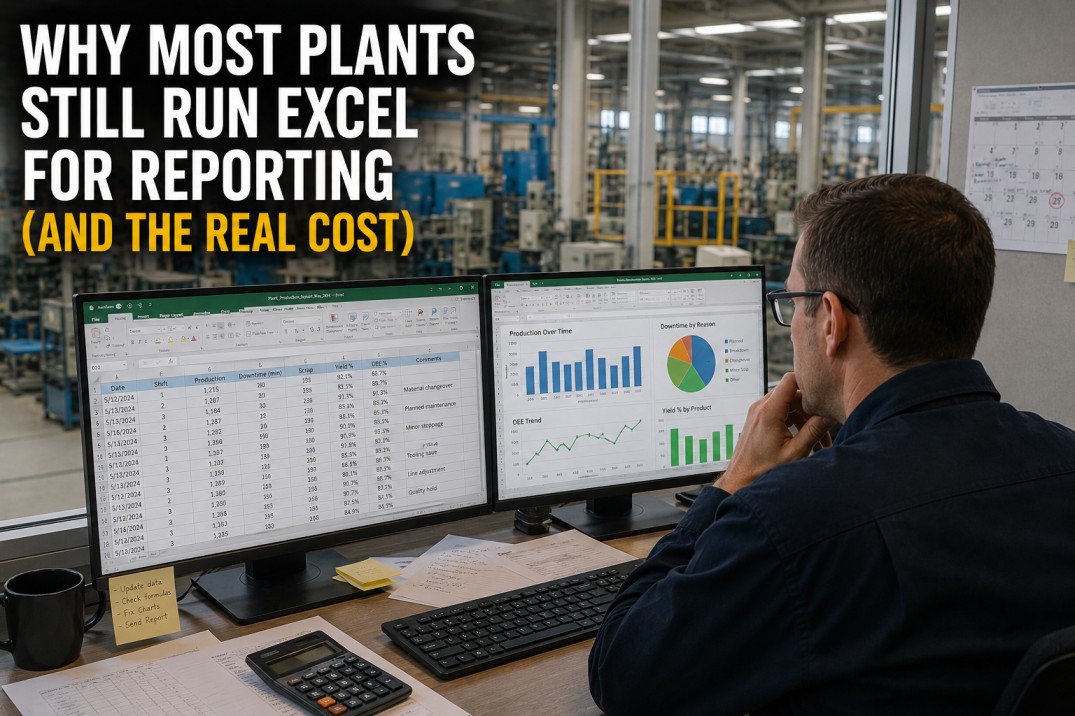
Walk into any manufacturing plant in 2026 and you will find spreadsheets — dozens, often hundreds of them. Production logs in Excel, shift handover notes in CSV files, OEE calculators in shared network folders with filenames like "OEE_Report_v3_FINAL(1).xlsx". Despite a decade of purpose-built analytics platforms, Excel remains the default reporting tool for the majority of plant teams. This page examines why manufacturing plants cling to spreadsheets, what the real cost is — in dollars, risk, and missed opportunity — and how a structured migration away from Excel delivers a measurable return that most finance teams underestimate by a factor of three to five.
What Spreadsheet Reporting Really Costs Your Plant
Most plant teams underestimate the true cost of Excel-based reporting by a factor of three to five. Direct labour hours spent cutting and pasting data are only the visible tip. The hidden costs — error correction, reconciliation delays, audit overhead, poor decisions based on stale data — add up much faster than most managers realise. The four metrics below represent the average cost profile across mid-size manufacturing plants that iFactory has assessed in 2025–2026.
Excel vs Purpose-Built Manufacturing Reporting
Spreadsheets have survived in manufacturing not because they are the best tool, but because they are the most familiar. When you compare Excel directly against a purpose-built manufacturing analytics platform across the dimensions that matter for plant-floor reporting, the gap is wide — and widening as data volumes, team collaboration needs, and audit requirements grow. The table below compares ten critical dimensions.
| Dimension | Spreadsheet Reporting | iFactory Reporting |
|---|---|---|
| Data Freshness | Manual refresh — daily or weekly | Real-time, sub-second from PLC/SCADA |
| Collaboration | Email attachments, shared drives, "who has the latest version?" | Single source of truth, role-based access |
| Version Control | Filenames: report_v2_FINAL(3).xlsx | Automatic versioning, full audit trail |
| Data Integrity | Formula errors, broken links, manual typos | Governed KPI definitions, auto-validation |
| Reporting Lag | 4–24 hours from data to report | Sub-second dashboard refresh |
| Scalability | Grinds at 50K+ rows, multi-sheet chaos | Handles millions of time-series data points |
| Audit Trail | None — any cell can change without trace | Full lineage, who changed what and when |
| Access Control | Network folder permissions at best | RBAC, row-level security, SSO |
| Mobile Access | View on phone? Good luck. | Responsive, native mobile dashboards |
| Time to Insight | ~4 hrs from request to answered question | Seconds — ask the dashboard |
The Spreadsheet Risk Chain: How Small Errors Become Big Problems
An isolated typo in a single cell seems harmless. But in a manufacturing plant's spreadsheet ecosystem, errors cascade. A formula mistake in a yield calculator feeds into the weekly production report, which feeds into the monthly management pack, which drives an inventory decision. By the time the error is discovered, the bad decision has already been made. The diagram below traces the typical risk chain from a single data entry error to a material business impact — a pattern that iFactory has documented in plant after plant — alongside the specific countermeasures that eliminate each link in the chain.
Six Hidden Costs of Spreadsheet Reporting
The annual $340K figure is an average — the actual cost varies by plant size, spreadsheet count, and reporting complexity. The six cost cards below break down the hidden cost categories that drive the total. Each category represents real, measurable expenditure that disappears when spreadsheets are replaced with automated manufacturing reporting — and each one is typically overlooked in the business case for analytics investment.
4-Step Plan to Replace 80% of Plant Spreadsheets
Migrating from spreadsheet-dependent reporting to a purpose-built analytics platform does not need to be a big-bang project. The most successful migrations follow a four-step phased approach that delivers value at every stage and never leaves the plant without working reports. Each phase typically takes 2–4 weeks, and the cumulative impact accelerates as you progress.
Why Plant Teams Resist Moving Beyond Excel
Understanding the psychological and organisational barriers to spreadsheet replacement is essential to a successful migration. These six barriers are the most common reasons plant teams cite for staying with Excel — and each one has a proven counter-strategy that iFactory has seen work across dozens of plants. The key is to address the barrier, not just the technology.
Frequently Asked Questions
Why do manufacturing plants still rely so heavily on Excel in 2026?
There are four primary reasons. First, familiarity — Excel has been the universal data tool for three decades, and most plant personnel know how to use it. Second, autonomy — a production supervisor can create a spreadsheet in 10 minutes without asking anyone for permission or budget. Third, perceived cost — Excel is already installed on every laptop, so it feels "free" compared to a purpose-built analytics platform. Fourth, trust — teams trust spreadsheets they built themselves because every cell is visible and understandable. Each of these barriers is addressable with the right migration strategy, which is why iFactory's approach focuses on mirroring familiar layouts, preserving user autonomy, building a bottom-up business case, and running parallel validation to build trust before switching.
What is the biggest risk of using Excel for manufacturing reporting?
The biggest risk is undetected errors that lead to bad decisions. Research consistently shows that approximately 4% of manufacturing spreadsheets contain material formula errors or data entry mistakes. In a plant with 240+ spreadsheets, that means roughly 10 spreadsheets at any given time are producing incorrect numbers. Because spreadsheets lack audit trails, these errors often go undetected for weeks or months, during which time incorrect data drives inventory decisions, maintenance scheduling, quality release decisions, and management reporting. The second-biggest risk is data silos — critical information locked in individual spreadsheets that cannot be cross-referenced, trended over time, or combined with other data sources to produce holistic plant intelligence.
How much time can a plant save by replacing Excel with automated reporting?
For a typical mid-size plant, replacing the top 50 spreadsheets (the most frequently used ones) saves 12–18 hours per week, or 600–900 hours per year. That is the equivalent of 0.3–0.5 full-time employees dedicated to manual data work. The savings come from three categories: elimination of manual data entry (~40%), elimination of report assembly time (~35%), and elimination of error correction and reconciliation time (~25%). These estimates are conservative — plants with heavier reporting requirements or more complex spreadsheet ecosystems often save 25+ hours per week. iFactory's platform typically eliminates 80% of active spreadsheets within 6–12 months of deployment.
How do you migrate from Excel without disrupting plant operations?
The key principle is "never leave the plant without a working report." The migration follows a parallel-run approach: for each spreadsheet targeted for replacement, the new automated report is built alongside the existing spreadsheet and run in parallel for at least two reporting cycles. During this period, the team validates that the new report produces the same (or better) numbers as the spreadsheet. Once confidence is established, the spreadsheet is retired but remains available as a read-only reference for an additional 30–60 days. This phased, parallel approach means there is never a moment when a critical report is unavailable — and it gives the team time to build trust in the new platform. Spreadsheets are retired only when the team is ready, not on an IT-mandated timeline.
Is Excel going to disappear from manufacturing?
Excel will not disappear entirely — and it should not. Spreadsheets remain a valuable tool for ad-hoc analysis, what-if scenarios, and quick calculations. The goal is not to eliminate Excel, but to eliminate Excel as the primary reporting and decision-support platform. In a well-governed plant analytics environment, Excel is used for its strengths — flexible modelling, one-off analysis, prototyping — while routine production reporting, KPI tracking, shift handover, quality monitoring, and management dashboards run on a purpose-built platform with real-time data, governed definitions, and automated delivery. This hybrid model respects the reality that Excel will always have a place on the plant floor, while ensuring that the plant's critical reporting and decision infrastructure is reliable, auditable, and scalable.
Act Now
Stop Managing Your Plant in Spreadsheets. Start Managing with Data.
You now understand the true cost: 240+ spreadsheets, 18 hours lost weekly, a 4.2% error rate, and $340K in hidden annual costs. You have seen the comparison, the risk chain, the hidden cost categories, the migration plan, and the barriers to change. The path forward is clear: a phased, parallel-run migration from spreadsheet reporting to iFactory's automated manufacturing analytics platform — starting with your top five spreadsheets and delivering measurable ROI in weeks. Book a 30-minute personalised demo and we will include a free spreadsheet audit for your plant.