The average manufacturing plant generates 50-100+ reports every week — shift summaries, production logs, downtime reports, quality records, maintenance logs, safety reports, energy reports, and compliance documents. When compiled manually from spreadsheets, SCADA exports, ERP queries, and handwritten notes, each report consumes 30-90 minutes of a supervisor's time. That is 25-75 hours per week of skilled labor spent formatting data instead of improving operations. Manual reports also introduce transcription errors at a 1-3% rate, arrive hours or days late, and format inconsistently across shifts and departments — making trend analysis unreliable and audit preparation a scramble. iFactory eliminates the reporting burden entirely. Shift handover reports generate themselves from live production data. Batch records compile automatically with full traceability. Maintenance KPIs calculate in real time. Regulatory compliance exports produce audit-ready packages on demand. The reporting that used to consume your best supervisors' time now happens without any human data entry at all.
The Hidden Cost of Manual Reporting in Manufacturing
Manual reporting doesn't just waste time — it creates a cascading chain of operational failures. Late reports mean late decisions. Inconsistent formats mean unreliable trends. Transcription errors mean wrong numbers driving wrong actions. And when auditors arrive, the reporting burden explodes from a daily annoyance into a multi-day emergency that pulls your most experienced people off the floor.
Data Gathering
Supervisors log into SCADA, pull MES exports, query ERP, check handwritten maintenance logs, and collect quality lab results — from 5-8 different systems that don't talk to each other.
15-30 min per reportManual Compilation
Raw data is copied into spreadsheet templates, formatted, calculated, and cross-referenced. Every copy-paste introduces potential transcription errors. Every manual calculation risks math mistakes.
20-40 min per reportReview & Distribution
Reports are emailed to stakeholders, printed for shift boards, and filed for compliance. By the time the report reaches decision-makers, the data is 4-8 hours old. Yesterday's problems are already today's breakdowns.
10-20 min per reportAudit Scramble
When auditors request 12-36 months of production, quality, or safety records, the plant enters emergency mode. Key personnel are pulled off the floor to locate, compile, and format historical data from scattered sources.
2-5 days per auditiFactory eliminates steps 1-3 completely. Reports generate themselves from live data — no manual gathering, no copy-paste, no formatting. Step 4 becomes a one-click export instead of a multi-day scramble. Supervisors get their 25-75 hours per week back to focus on actually improving operations.
Calculate how much supervisor time your plant loses to manual reporting. Schedule a reporting automation assessment with our team.
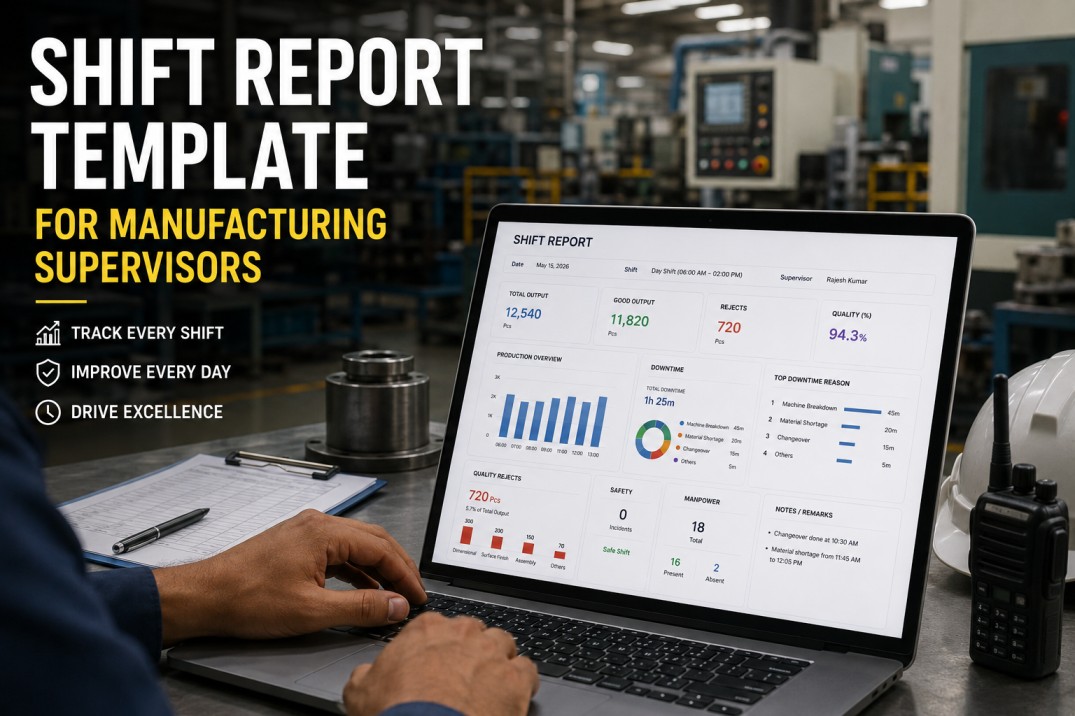
Automated Shift Handover Reports: Zero-Gap Transitions
The shift handover is the most critical 30 minutes of the production day — and the most dangerous. Over 40% of plant incidents occur during start-up, shutdown, and shift handover periods, despite these accounting for less than 5% of operational time. Major industrial disasters — including Piper Alpha, BP Texas City, and Esso Longford — all had shift handover communication failures as contributing causes. iFactory generates shift handover reports automatically from live production data.
Line 2 ran 94% OEE on Product A, producing 12,400 units against a target of 13,000. Performance loss of 600 units attributed to 8 micro-stops on the cartoner (avg 52 sec each). Line 1 completed changeover to Product B at 03:40 — startup yield at 97.2%.
Filler nozzle #3 replaced at 02:20 (WO-4571, completed by R. Santos). Vibration alert on Packaging Line 2 carton erector bearing — trending upward, maintenance WO-4589 auto-generated, scheduled for Saturday shutdown window.
Batch 2847 on hold pending lab results for fill weight verification — do not ship. Cpk on Line 4 fill weight recovered from 1.28 to 1.47 after parameter adjustment at 22:15. All other lines within spec.
Near-miss reported: forklift #7 near-contact in Warehouse Zone C at 01:45. Hazard report filed, corrective action assigned to warehouse supervisor (due: today). No recordable incidents this shift.
Batch 2847 lab results expected by 09:00 — release or reject decision required. Compressed air leak on Line 1 manifold identified (2.1 CFM) — maintenance ticket RA-1102 open. Forklift near-miss corrective action due today.
Production Batch Records & Traceability
Regulated manufacturing — food, pharma, chemical, and aerospace — requires complete batch genealogy: every process parameter, raw material lot, operator action, equipment used, and quality check result documented for every batch. iFactory's electronic batch records capture this data automatically from production systems, eliminating manual logbooks that introduce errors and creating full forward and backward traceability.
Automated Data Capture
Process parameters (temperature, pressure, speed, pH), raw material lot numbers, equipment IDs, and operator actions are captured automatically from PLCs, scales, and MES — not handwritten in logbooks.
Forward & Backward Traceability
Trace any finished goods pallet back to raw material supplier lots in seconds. Trace any raw material lot forward to every finished product that used it. Full genealogy for recall management and regulatory compliance.
21 CFR Part 11 Compliance
Electronic signatures, audit trails, access controls, and tamper-proof records meeting FDA requirements. ALCOA+ data integrity principles — Attributable, Legible, Contemporaneous, Original, Accurate — built into every record.
AI Batch Variation Detection
AI detects batch-to-batch variation patterns that manual review misses — correlating quality outcomes with subtle process parameter drift across hundreds of batches to identify emerging quality risks.
Maintenance Reporting: MTBF, MTTR & Work Order Analytics
Maintenance reporting in most plants is a monthly spreadsheet exercise — someone pulls work order data from the CMMS, manually calculates KPIs, and produces a report that arrives weeks after the data was relevant. iFactory calculates maintenance KPIs in real time, directly from work order and sensor data, and AI identifies deteriorating trends before they become breakdowns.
Calculated per asset in real time. AI flags assets with declining MTBF trends — the compressor that averaged 2,100 hours between failures is now at 1,400 hours and declining, predicting failure within 3 weeks.
Tracked by equipment type, failure mode, and technician. AI identifies which repair types take longest and recommends spare parts pre-staging to reduce MTTR for high-impact assets.
World-class target: 80%+ preventive. AI-generated predictive work orders shift the ratio from reactive firefighting to planned maintenance that doesn't disrupt production.
Tracks open work orders by age, priority, and equipment criticality. AI prioritizes the backlog by risk impact — ensuring the most consequential repairs are addressed first, not just the oldest tickets.
Want maintenance reports that predict failures instead of documenting them? Book a demo to see AI-powered maintenance analytics. For integration questions, visit ifactoryapp.com/support.
Regulatory Compliance Exports: OSHA, EPA, FDA & ISO
When auditors arrive — OSHA, EPA, FDA, ISO, or customer quality auditors — the difference between a confident response and a frantic scramble is whether your data lives in a unified, export-ready system or scattered across filing cabinets and spreadsheets. iFactory generates complete audit-ready compliance packages on demand.
Safety & Health
OSHA 300/300A/301 logs, incident investigation records, inspection histories, corrective action documentation, training records, and permit-to-work archives. Electronic submission to OSHA ITA system.
Environmental
Emissions tracking, waste generation and disposal records, water discharge monitoring, WAGES energy consumption data, and ESG sustainability reports. Exportable in EPA-required formats.
Food & Pharma
Electronic batch records with 21 CFR Part 11 compliance, process parameter logs, quality test results, deviation records, CAPA documentation, and validated electronic signatures with full audit trails.
Management Systems
ISO 9001 quality management review inputs, ISO 14001 environmental performance data, ISO 45001 safety KPIs and incident records, and management review packages with AI-generated executive summaries.
Multi-Site Benchmarking: Comparing Plants, Lines & Shifts
Corporate manufacturing leaders managing multiple plants need one thing above all: a fair, normalized comparison that reveals why one plant outperforms another. iFactory standardizes KPI definitions across sites and enables drill-down analysis that identifies specific, actionable differences — not just aggregate numbers.
AI Insight: The 16-point OEE gap between Plant A and Plant C is driven by changeover time (Plant A: 12 min avg, Plant C: 28 min avg) and micro-stop frequency (Plant A: 6/shift, Plant C: 22/shift). Recommended action: Deploy Plant A's changeover SOP at Plant C — projected 8-10 point OEE recovery within 6 weeks.
Frequently Asked Questions
Stop Compiling Reports. Start Using Intelligence.
iFactory automates every manufacturing report — shift handovers, batch records, maintenance KPIs, compliance exports, and executive briefings — so your team focuses on improving operations, not formatting spreadsheets.