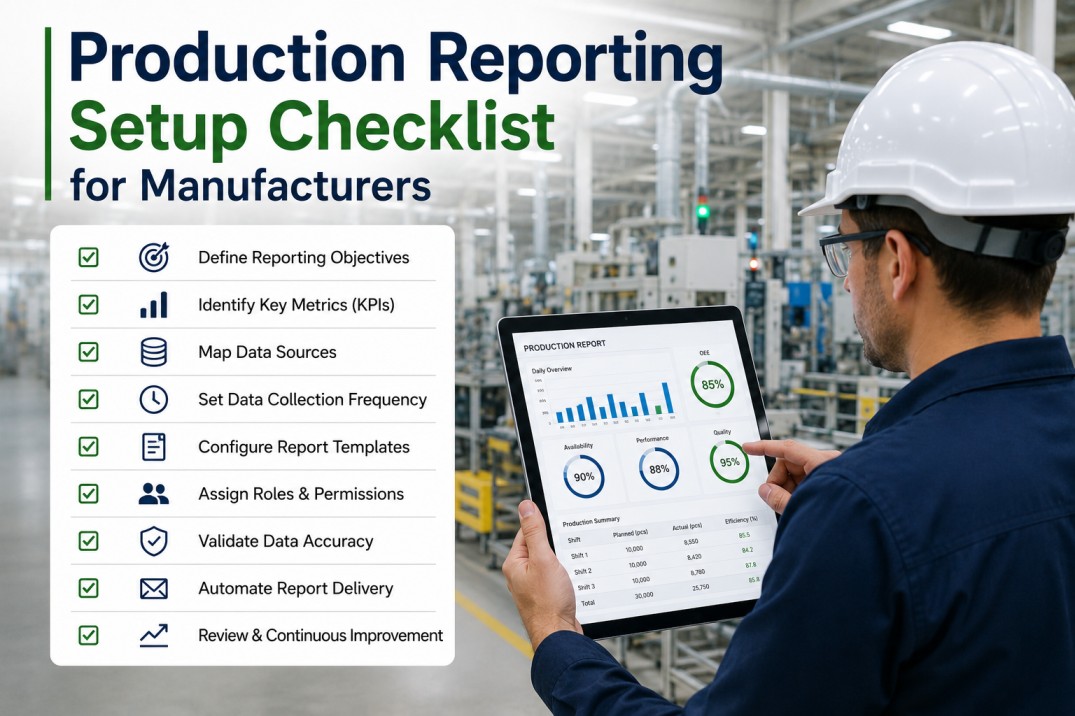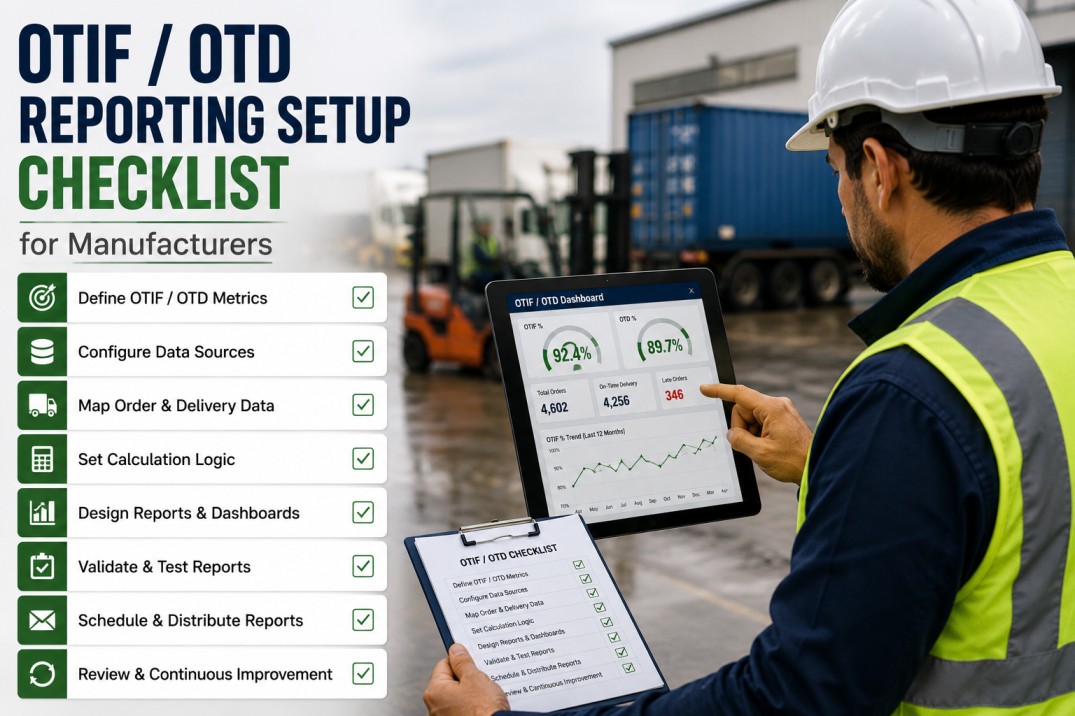
An OTIF (On-Time In-Full) and OTD (On-Time Delivery) reporting setup checklist helps manufacturing plants configure accurate, customer-specific fulfilment tracking across their ERP, logistics, and warehouse systems. Without a structured setup approach, plants struggle with inconsistent delivery window definitions, misaligned fill rate calculations, untracked root causes, and manual reporting that delays corrective action. This checklist covers seven essential dimensions of OTIF/OTD reporting — from scorecards and customer rules to order fulfilment status, monthly trends, root cause Pareto analysis, and actionable setup tasks — enabling reliable, automated fulfilment performance tracking from plant-floor data.
OTIF & OTD Performance Scoreboard: Fulfilment at a Glance
Monitor your plant's delivery performance across four key metrics. Each card shows the current value with a progress bar toward target and a month-over-month trend indicator.
Track Fulfilment
Automated OTIF/OTD Tracking with iFactory
iFactory's manufacturing analytics platform automatically calculates OTIF and OTD at the order line level — applying customer-specific delivery windows, fill rate thresholds, and JIT tolerances. Real-time OTIF dashboards with drill-down to individual orders help you identify and resolve fulfilment issues before they affect customer scorecards.
Customer-Specific OTIF Rules: Delivery Windows and Requirements
Every customer defines unique delivery window tolerances, fill rate thresholds, packaging specifications, and criticality tiers. The table below documents six customer profiles with their OTIF calculation rules as configured in the reporting system.
| Customer | Region | Delivery Window | Fill Rate Threshold | Packaging Rules | Tier |
|---|---|---|---|---|---|
| AutoParts GmbH | Germany | ±1 day | 99% | Full pallets only | Rated |
| MedTech Ltd | Ireland | ±4 hrs (JIT) | 100% | By expiry batch | Critical |
| FoodCo Central | UK | ±1 day | 98% | FIFO + min 60% shelf life | Rated |
| Electra Systems | USA | ±2 days | 97% | ESD-safe packaging | Standard |
| BuildMart Inc | Canada | ±3 days | 95% | Bulk + labeled units | Standard |
| ChemCorp Global | Netherlands | ±1 day (JIT) | 100% | ADR-compliant only | Critical |
Order Fulfilment Status: Planned vs Actual Delivery
Tracking individual order fulfilment against customer-requested delivery dates and quantities is essential for identifying exceptions. The table below shows ten recent orders with their on-time and in-full status.
| PO Number | Customer | Requested Date | Actual Date | Ordered Qty | Shipped Qty | Timing | Fill |
|---|---|---|---|---|---|---|---|
| PO-2024-1842 | AutoParts GmbH | 15-May | 14-May | 1000 | 1000 | On Time | Full |
| PO-2024-1843 | MedTech Ltd | 15-May 08:00 | 15-May 07:45 | 500 | 500 | On Time | Full |
| PO-2024-1844 | FoodCo Central | 16-May | 17-May | 2000 | 1800 | Late | Partial |
| PO-2024-1845 | Electra Systems | 16-May | 15-May | 750 | 750 | Early | Full |
| PO-2024-1846 | BuildMart Inc | 17-May | 18-May | 3000 | 3000 | Late | Full |
| PO-2024-1847 | ChemCorp Global | 17-May 06:00 | 17-May 05:55 | 400 | 400 | On Time | Full |
| PO-2024-1848 | AutoParts GmbH | 18-May | 17-May | 1500 | 1400 | Early | Partial |
| PO-2024-1849 | MedTech Ltd | 18-May 14:00 | 19-May 09:00 | 200 | 200 | Late | Full |
| PO-2024-1850 | FoodCo Central | 19-May | 19-May | 1200 | 1200 | On Time | Full |
| PO-2024-1851 | Electra Systems | 20-May | 21-May | 600 | 550 | Late | Partial |
Operational Visibility
Order-Level OTIF Tracking from ERP Data
iFactory ingests sales orders, shipment confirmations, and delivery receipts from your ERP to calculate OTIF and OTD at the individual order line level. Automated rule engines apply customer-specific delivery windows and fill rate thresholds so every order is scored consistently against the right criteria.
Monthly OTIF Performance Cards: Trend Overview
Tracking OTIF, OTD, and Fill Rate month over month reveals performance trends and helps identify seasonal patterns or process changes that affect fulfilment. Each card shows the four key metrics with an inline progress bar and directional trend.
Analyse Trends
Monthly OTIF Trend Analysis with iFactory
iFactory's OTIF analytics module automatically tracks monthly performance trends across OTIF, OTD, and Fill Rate — with configurable target lines, automated variance alerts, and drill-down to customer-level and order-level detail. Trend cards show MTD performance with comparison to prior periods.
OTIF Failure Root Cause Breakdown: Pareto Analysis
Understanding the root causes of OTIF failures enables targeted improvement actions. The table below ranks failure causes by frequency with cumulative percentage for Pareto analysis, helping teams focus on the highest-impact issues.
| Root Cause | Occurrences | % of Total | Cumulative % | Description |
|---|---|---|---|---|
| Production Delay | 26.1% | 26.1% | Scheduled changeover overrun, material shortage at line start | |
| Carrier Late Pickup | 19.6% | 45.7% | Carrier missed scheduled pickup window at loading dock | |
| Quality Hold | 15.2% | 60.9% | Batch placed on hold pending QA release, missed ship window | |
| Inventory Shortage | 13.0% | 73.9% | Insufficient finished goods to fulfil full order quantity | |
| Packaging Error | 8.7% | 82.6% | Wrong label or packaging specification applied to shipment | |
| Documentation Missing | 6.5% | 89.1% | Missing certificate of analysis or customs documentation | |
| System Data Mismatch | 6.5% | 95.7% | ERP availability date differs from actual production completion | |
| Customs Clearance | 4.3% | 100.0% | Export documentation error caused border hold |
Fix Root Causes
Automated Root Cause Tagging and Pareto Analysis with iFactory
iFactory automatically tags late and incomplete orders with root cause categories based on ERP and MES data — production delays, carrier issues, quality holds, inventory shortages, and more. Built-in Pareto analysis highlights the most impactful failure modes so your operations team can focus on what matters most.
OTIF / OTD Reporting Setup Checklist
Use this checklist to configure OTIF and OTD reporting across your organisation. Each task includes the implementation category, responsible owner, estimated duration, and priority level to help sequence the work effectively.
| # | Task | Category | Owner | Duration | Priority |
|---|---|---|---|---|---|
| 1 | Define OTIF calculation rules per customer contract | Rules | Customer Service | 1 week | Critical |
| 2 | Configure delivery window tolerances in ERP | Data | IT | 3 days | Critical |
| 3 | Map customer-specific packaging and labelling rules | Rules | Logistics | 1 week | High |
| 4 | Establish data source for actual shipment timestamp | Data | IT | 3 days | Critical |
| 5 | Set up fill rate calculation (qty shipped / qty ordered) | Data | Analytics | 2 days | Critical |
| 6 | Build OTIF/OTD KPI dashboard with drill-down | Dashboard | BI Developer | 1 week | High |
| 7 | Configure automated root cause tagging on late orders | Dashboard | Analytics | 3 days | Medium |
| 8 | Define alert thresholds for OTIF degradation | Dashboard | Analytics | 2 days | High |
| 9 | Train customer service team on OTIF reporting | Training | Project Lead | 2 days | Medium |
| 10 | Set up monthly OTIF review cadence with stakeholders | Process | Operations | 1 day | Medium |
Frequently Asked Questions
What is the difference between OTIF and OTD?
OTIF (On-Time In-Full) measures both whether a delivery arrived within the customer's agreed delivery window AND whether the full ordered quantity was delivered. OTD (On-Time Delivery) measures only the delivery timing aspect. OTIF is the more comprehensive metric and is increasingly required by major retailers and automotive OEMs as a supply chain performance benchmark.
How is OTIF calculated?
OTIF = (Number of orders delivered on time AND in full) / (Total number of orders shipped) x 100%. A delivery is 'on time' if it arrives within the customer-specific delivery window (e.g., ±1 day from requested date). It is 'in full' if the quantity delivered matches the quantity ordered. For JIT customers, the window may be as narrow as ±4 hours, and any deviation counts as a failure.
What data sources are needed for OTIF reporting?
OTIF reporting requires data from ERP (sales orders, shipment dates, quantities), logistics systems (actual delivery confirmation timestamps), customer master data (delivery window rules per customer), and warehouse management (packing and dispatch records). Combining these sources enables accurate calculation of on-time and in-full performance at the order line level.
How often should OTIF data be refreshed?
OTIF dashboards should update in real time for operational visibility — showing MTD performance with drill-down to individual orders. Weekly OTIF reports are recommended for customer account reviews, and monthly reports for executive performance reviews and continuous improvement tracking.
What is a good OTIF target?
Best-in-class manufacturers achieve OTIF rates above 98%. A rate of 95–98% is considered strong. Rates between 90–95% indicate room for improvement, while rates below 90% typically trigger customer scorecard penalties and require focused root cause analysis. JIT customers often require 100% OTIF with zero tolerance for late or incomplete deliveries.
How can OTIF performance be improved?
Improving OTIF requires addressing root causes across production scheduling (reduce late finishes), inventory management (ensure safety stock for volatile customers), logistics coordination (tighten carrier pickup windows), and quality processes (reduce batch release delays). Automated OTIF dashboards with root cause tagging help identify the most impactful improvement actions.
Start Tracking OTIF
Deploy OTIF/OTD Reporting Across Your Plant Network
iFactory's OTIF/OTD reporting module connects directly to your ERP and MES systems to calculate on-time and in-full performance at the order line level — applying customer-specific delivery windows, fill rate thresholds, and JIT tolerances. From individual order drill-down to executive trend dashboards, iFactory gives you complete visibility into fulfilment performance across your entire customer portfolio.