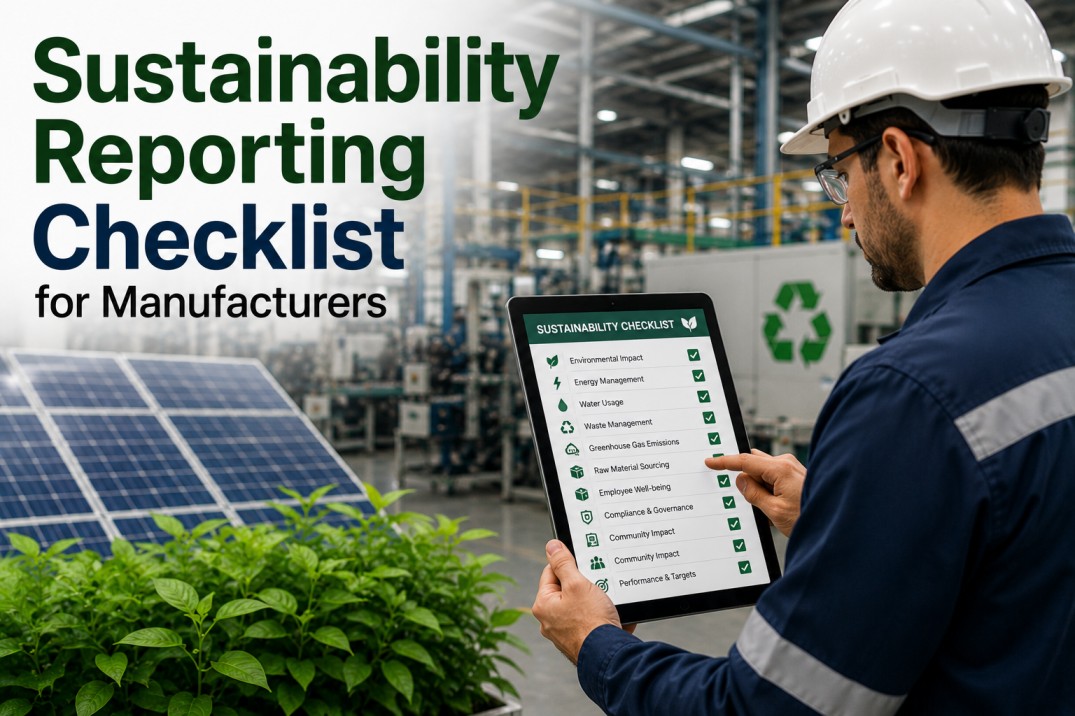
A sustainability reporting checklist helps manufacturing plants systematically track environmental, social, and governance metrics — covering carbon emissions (Scope 1, 2, and 3), energy consumption, water usage, waste generation, and safety performance — for accurate ESG reporting to regulators, investors, and customers. Without a structured approach, manufacturers struggle with inconsistent data sources, manual collection processes, misaligned reporting standards, and audit trail gaps. This checklist covers seven essential dimensions of sustainability reporting — from scorecards and scope breakdowns to data source mapping, standards reference, and actionable tasks — enabling reliable, audit-ready ESG reporting from plant-floor data.
Sustainability Reporting Scoreboard: Key ESG Metrics at a Glance
Track your plant's critical sustainability metrics across carbon, water, waste, and safety. Each card shows the current value with a progress bar toward target and a trend indicator compared to the prior reporting period.
Track Sustainability
Automate ESG Data Collection and Reporting with iFactory
iFactory's sustainability module automatically collects energy, emissions, water, and waste data from plant-floor systems — calculating GHG Scopes 1, 2, and 3 using verified emission factors. Generate ESG reports aligned with GHG Protocol, SASB, GRI, TCFD, and ISSB standards without manual spreadsheets or data collection.
GHG Scope Breakdown: Emissions Tracking Completeness
The three GHG Protocol scopes define the boundary of emissions reporting. Each scope card shows the current tracking completeness percentage and describes the typical data sources and coverage challenges for manufacturing plants.
Sustainability Metrics Reference: Targets and Current Performance
Tracking sustainability metrics against defined targets is essential for demonstrating progress to regulators, investors, and customers. The table below shows eight core manufacturing sustainability metrics with current values, targets, and performance status.
| Metric | Unit | Current | Target | Status |
|---|---|---|---|---|
| GHG Intensity | tCO₂e / $M revenue | 245 | 210 | On Track |
| Energy Intensity | MWh / unit produced | 2.8 | 2.5 | On Track |
| Renewable Energy Share | % of total energy | 22% | 35% | At Risk |
| Water Intensity | m³ / unit produced | 4.2 | 3.8 | At Risk |
| Waste to Landfill | tonnes | 1,240 | 850 | Behind |
| Recycling Rate | % of total waste | 62% | 75% | Behind |
| TRIR | incidents / 200K hrs | 3.2 | 2.5 | On Track |
| Lost Time Injury Rate | LTIs / 200K hrs | 1.8 | 1.2 | At Risk |
Measure Impact
Track Sustainability Metrics Against Targets in Real Time
iFactory's sustainability dashboards track GHG intensity, energy intensity, renewable share, water intensity, waste diversion, and safety metrics against your targets — with automated alerts when metrics deviate from the planned trajectory. Real-time visibility enables corrective action before reporting deadlines.
Emissions Data Source Mapping: Traceability and Quality
Accurate sustainability reporting depends on reliable data sources. The table below maps eight common emissions data sources to their collection method, reporting frequency, current data quality score, and applicable GHG scope.
| Emission Source | Data Source | Frequency | Data Quality | Scope |
|---|---|---|---|---|
| Natural Gas Combustion | Utility bills / sub-meters | Monthly | 94% | Scope 1 |
| Fleet Fuel Usage | Fuel card records | Monthly | 82% | Scope 1 |
| Refrigerant Leakage | Maintenance logs | Quarterly | 65% | Scope 1 |
| Purchased Electricity | Utility bills / smart meters | Monthly | 98% | Scope 2 |
| Purchased Steam | Utility bills | Monthly | 91% | Scope 2 |
| Raw Material Procurement | ERP purchase data | Quarterly | 72% | Scope 3 |
| Waste Disposal | Waste manifest records | Monthly | 78% | Scope 3 |
| Employee Commuting | Survey estimates | Annually | 45% | Scope 3 |
Trust Your Data
Automated Data Quality Scoring for Sustainability Reporting
iFactory automatically scores the quality of every sustainability data source — from utility meters and ERP purchase records to waste manifests and emission factor databases. Real-time data quality dashboards show completeness, accuracy, and timeliness for each source, helping you identify gaps before they affect your ESG report.
Sustainability Reporting Standards Reference: Frameworks and Requirements
Manufacturers must navigate multiple sustainability reporting standards. Understanding the scope, requirements, and audience of each framework is critical for efficient compliance. The cards below describe five key standards relevant to manufacturing ESG reporting.
Comply with Standards
Generate Multi-Standard ESG Reports Automatically with iFactory
iFactory's sustainability reporting engine supports GHG Protocol, SASB, GRI, TCFD, and ISSB standards — generating audit-ready ESG reports with a single click. Automated emission factor application, data quality scoring, and audit trail documentation save weeks of manual reporting effort every quarter.
Sustainability Reporting Action Checklist
Use this action checklist to establish and maintain a reliable sustainability reporting program. Each task includes the ESG category, responsible owner, recommended frequency, and priority level to help sequence your sustainability data initiatives.
| # | Action Item | Category | Owner | Frequency | Priority |
|---|---|---|---|---|---|
| 1 | Establish GHG emissions baseline (Scope 1, 2, 3) | Emissions | Sustainability | Quarterly | Critical |
| 2 | Install sub-meters for energy-intensive processes | Energy | Engineering | Monthly | Critical |
| 3 | Implement water consumption tracking by process | Water | Engineering | Monthly | High |
| 4 | Set up waste stream classification and tracking | Waste | EHS | Monthly | High |
| 5 | Deploy real-time emissions monitoring dashboard | Emissions | Analytics | Quarterly | Critical |
| 6 | Align sustainability metrics with reporting standards | Governance | Sustainability | Annually | High |
| 7 | Automate ESG data collection from ERP and MES | Data | IT | Quarterly | Critical |
| 8 | Establish sustainability data quality review process | Governance | Data Team | Monthly | Medium |
| 9 | Train plant managers on ESG data entry procedures | Governance | Sustainability | Quarterly | Medium |
| 10 | Commission third-party verification of sustainability data | Governance | Audit | Annually | High |
Frequently Asked Questions
What is the difference between Scope 1, 2, and 3 emissions?
Scope 1 covers direct emissions from owned sources like boilers, furnaces, and fleet vehicles. Scope 2 covers indirect emissions from purchased electricity, steam, heat, and cooling. Scope 3 covers all other indirect emissions in the value chain, including purchased goods, upstream transportation, waste disposal, business travel, and downstream product use. Most manufacturers report Scope 1 and 2 annually, with Scope 3 becoming increasingly common.
Which sustainability reporting standard should manufacturers use?
Most manufacturers use the GHG Protocol for emissions accounting combined with either SASB (for investor-focused disclosure) or GRI (for broader stakeholder reporting). The ISSB standards, effective from 2024–2026, are consolidating SASB, TCFD, and CDSB into a single global baseline and are expected to become the dominant framework.
How often should sustainability data be collected?
Energy and emissions data from utility meters and sub-meters should be collected at least monthly, with real-time collection recommended for large plants. Water and waste data should be collected monthly. Scope 3 data from suppliers is typically collected quarterly or annually. Annual reporting cycles remain the norm for regulatory compliance, but leading manufacturers report quarterly.
What is a good sustainability data quality score?
A score above 90% is considered excellent and is typically achieved for Scope 2 data from utility bills. Scores between 75–90% are acceptable for Scope 1 data with some estimation. Scope 3 data often scores below 75% due to reliance on estimates, averages, and supplier-reported data. The goal should be 95%+ for Scope 1 and 2, and continuous improvement for Scope 3.
How does sustainability reporting connect to manufacturing analytics?
Sustainability reporting draws on the same data sources as operational analytics — energy consumption from SCADA, production volumes from MES, material consumption from ERP, and waste data from EHS systems. An integrated manufacturing analytics platform can automatically calculate emissions factors, track intensity metrics, and generate ESG reports without manual data collection and spreadsheet manipulation.
What are the most common sustainability reporting mistakes?
Common mistakes include using incorrect emission factors, double-counting emissions across scopes, failing to recalculate baselines after acquisitions or divestitures, using estimated data without proper documentation, and not aligning reported metrics with the chosen reporting standard's requirements. Automated data collection and validation rules help eliminate these issues.
Start Reporting Sustainably
Deploy Automated Sustainability Reporting Across Your Plant Network
iFactory's sustainability reporting platform automatically collects energy, emissions, water, waste, and safety data from your plant-floor systems and enterprise applications — calculating carbon footprints, tracking intensity metrics, and generating audit-ready ESG reports aligned with GHG Protocol, SASB, GRI, TCFD, and ISSB. From single plant to global enterprise, iFactory makes sustainability reporting accurate, efficient, and verifiable.