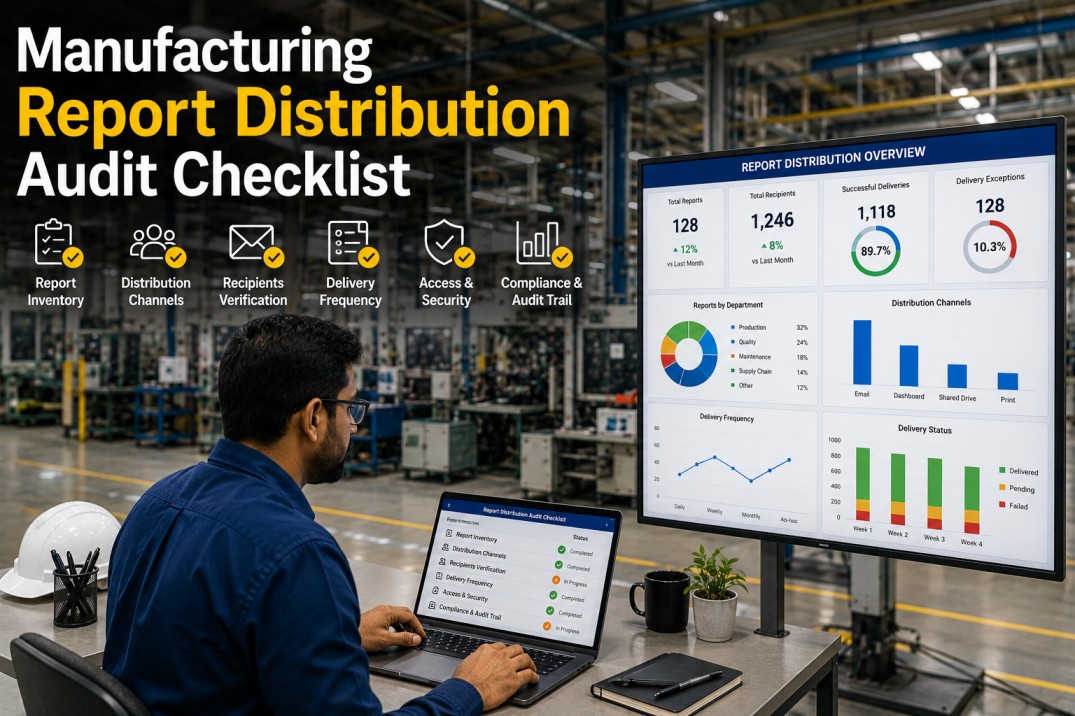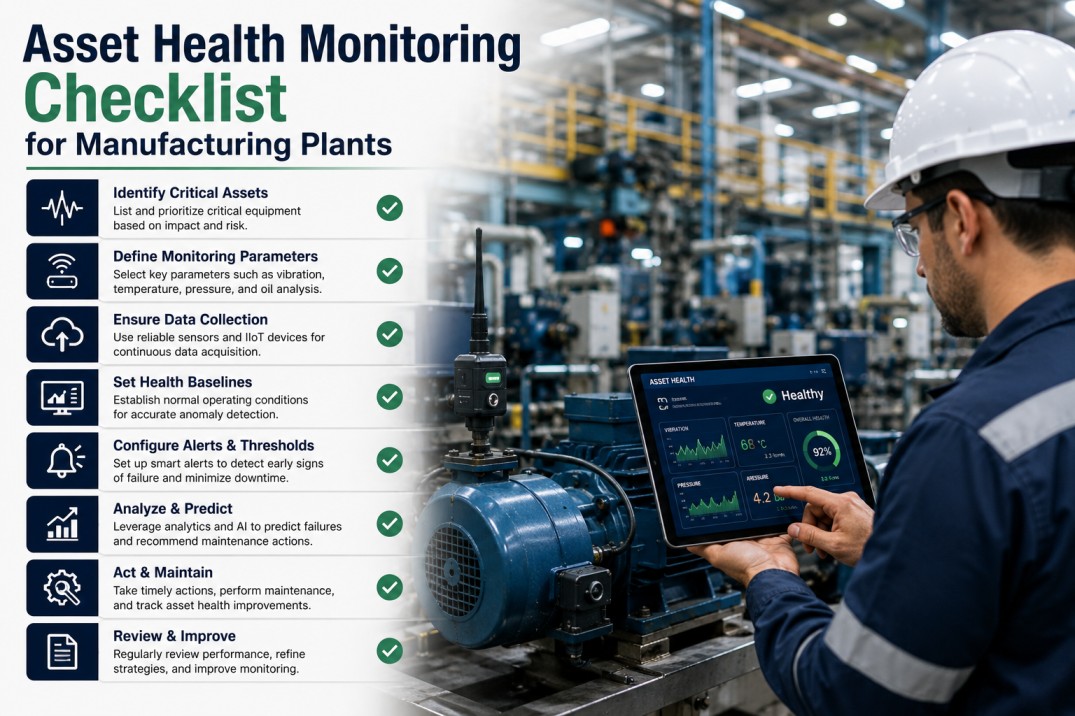
An asset health monitoring checklist helps manufacturing plants systematically track the condition, performance, and risk profile of critical production equipment. Without a structured approach to asset health management, plants risk unexpected breakdowns, costly emergency repairs, and unplanned downtime that erodes OEE and profitability. This checklist covers seven essential dimensions of asset health monitoring — from scorecards and criticality matrices to signal thresholds and actionable maintenance tasks — enabling reliability teams to extend asset life, reduce mean time between failure (MTBF), and keep production lines running at peak efficiency.
Asset Health Scoreboard: Overall Equipment Condition at a Glance
Track the overall health of your plant's asset base across four key metrics. Each card shows the current value with an inline trend indicator and progress toward target.
Monitor Asset Health
Get Real-Time Asset Health Visibility with iFactory
iFactory's manufacturing analytics platform continuously monitors equipment health across your entire plant — combining sensor data, maintenance history, and operational context into a single asset health score. Automated alerts, trend analysis, and health degradation detection help you move from reactive to predictive maintenance.
Asset Criticality Matrix: Priority-Based Health Tracking
Understanding the criticality of each asset helps prioritise health monitoring efforts and maintenance resources. The matrix below lists ten key assets with their criticality classification, current health score, and risk level.
| Asset ID | Asset Name | Criticality | Health | Risk Level |
|---|---|---|---|---|
| CNC-1042 | CNC Machine | Critical | 72% | High |
| PRS-201 | Press System | Critical | 91% | Low |
| CVY-307 | Conveyor Line | High | 58% | Critical |
| CMP-118 | Air Compressor | High | 84% | Medium |
| FUR-005 | Furnace Unit | Medium | 93% | Low |
| PLP-612 | Pump Station | Critical | 41% | Critical |
| RBT-403 | Robotic Arm | High | 76% | High |
| CLR-220 | Cooling Tower | Medium | 88% | Medium |
| TNK-501 | Tank Farm | Low | 95% | Low |
| GEN-330 | Generator | Critical | 63% | High |
Asset Health Indicator Cards: Six Condition Classifications
Every monitored asset falls into one of six health states based on its composite health score, active alerts, and degradation indicators. The distribution below shows the current breakdown across your asset base.
Classify and Prioritise
Automated Asset Health Classification with iFactory
iFactory automatically classifies every asset into health states based on configurable thresholds — combining vibration, temperature, pressure, current, and oil data into a single health indicator. Asset health distribution is updated in real time with drill-down to individual alerts and recommended actions.
Signal & Threshold Reference: Monitoring Parameters and Limit Values
Each asset type requires specific monitoring signals with defined normal, warning, and critical threshold ranges. The table below provides a reference for eight common monitoring parameters used in manufacturing asset health programs.
| Signal | Applicable Assets | Normal Range | Warning Range | Critical Range |
|---|---|---|---|---|
| Vibration | CNC, Press, Pump, Fan | 0–6 mm/s | 6–10 mm/s | >10 mm/s |
| Temperature | Furnace, Motor, Compressor | 0–80°C | 80–110°C | >110°C |
| Pressure | Pump, Compressor, Hydraulic | 0–8 bar | 8–12 bar | >12 bar |
| Current Draw | Motor, Generator, Drive | 0–90% rated | 90–105% rated | >105% rated |
| Oil Debris | Gearbox, Bearing, Hydraulic | 0–50 ppm | 50–200 ppm | >200 ppm |
| Acoustic Emission | Bearing, Valve, Pipe | 0–35 dB | 35–55 dB | >55 dB |
| Thermal Imaging | Panel, Motor, Cable | ΔT < 10°C | ΔT 10–25°C | ΔT > 25°C |
| Speed Deviation | Conveyor, Fan, Pump | 0–2% variance | 2–5% variance | >5% variance |
Failure Mode Coverage: Asset Health Degradation Categories
Asset health monitoring must account for multiple failure mode categories. Each category represents a distinct degradation pathway with specific monitoring signals, threshold profiles, and mitigation strategies.
Cover All Failure Modes
Comprehensive Failure Mode Monitoring with iFactory
iFactory's asset health module supports monitoring across mechanical, electrical, thermal, lubrication, and vibration failure modes — with configurable threshold profiles, cross-parameter correlation analysis, and automated failure mode identification based on signal pattern recognition.
Asset Health Timeline: Six-Month Health Score Trends
Tracking asset health scores over time reveals degradation patterns, validates the effectiveness of maintenance interventions, and helps predict when an asset will require attention. Each row shows the monthly health score trend for a key asset.
| Asset | Jan | Feb | Mar | Apr | May | Jun | Trend |
|---|---|---|---|---|---|---|---|
| CNC-1042 | 87% | 84% | 79% | 72% | 76% | 81% | |
| PRS-201 | 91% | 92% | 90% | 91% | 93% | 91% | |
| CVY-307 | 64% | 61% | 55% | 51% | 54% | 58% | |
| CMP-118 | 88% | 86% | 85% | 84% | 85% | 84% | |
| FUR-005 | 95% | 94% | 93% | 93% | 94% | 93% | |
| PLP-612 | 52% | 48% | 43% | 39% | 40% | 41% | |
| RBT-403 | 82% | 80% | 78% | 76% | 77% | 76% | |
| CLR-220 | 90% | 89% | 88% | 88% | 89% | 88% |
Asset Health Monitoring Action Checklist
Use this action checklist to implement and sustain an effective asset health monitoring program. Each item includes the applicable asset type, responsible owner, recommended frequency, and priority level.
| # | Action Item | Asset Type | Owner | Frequency | Priority |
|---|---|---|---|---|---|
| 1 | Perform vibration analysis on all rotating assets | Critical | Reliability | Weekly | Critical |
| 2 | Review and update asset criticality ratings | All | Engineering | Quarterly | High |
| 3 | Calibrate health monitoring sensors | SCADA-connected | Maintenance | Monthly | Critical |
| 4 | Update alert threshold values based on run history | All monitored | Data Team | Quarterly | Medium |
| 5 | Conduct thermal imaging of electrical panels | Electrical | Maintenance | Monthly | High |
| 6 | Review oil analysis results for gearboxes | Rotating | Lubrication | Weekly | Critical |
| 7 | Validate asset health score against actual failure data | All critical | Reliability | Monthly | High |
| 8 | Inspect and clean monitoring sensor connections | All | Maintenance | Monthly | Medium |
| 9 | Generate monthly asset health trend report | All | Analytics | Monthly | Medium |
| 10 | Train operators on asset health alert response | All critical | Training | Quarterly | High |
Take Action
Streamline Asset Health Action Tracking with iFactory
iFactory's action management module connects asset health alerts directly to maintenance workflows — automatically creating inspection tasks, tracking completion status, and verifying that interventions return assets to healthy status. No more spreadsheets or manual follow-up.
Frequently Asked Questions
What is asset health monitoring?
Asset health monitoring is the continuous tracking of equipment condition using sensor data, maintenance records, and operational context to produce a real-time health score. It enables predictive maintenance by detecting degradation patterns before failures occur, reducing unplanned downtime and extending asset life.
What metrics are used to calculate asset health?
Asset health scores typically combine vibration levels, temperature readings, pressure measurements, current draw, oil condition, run hours since last maintenance, historical failure frequency, and criticality rating. The exact formula varies by asset type and operating context.
How often should asset health be assessed?
Real-time monitoring should be continuous for critical assets with sensor coverage. Manual health assessments should be performed weekly for critical assets, monthly for high-priority, and quarterly for medium- and low-priority assets.
What is a good asset health score?
A score above 85% indicates healthy operation. Scores between 70–85% suggest monitoring is needed with increased inspection frequency. Scores below 70% require intervention, while scores below 50% indicate imminent failure risk requiring immediate action.
How does asset health differ from condition monitoring?
Condition monitoring focuses on tracking specific physical parameters (vibration, temperature, etc.), while asset health monitoring aggregates multiple condition signals into a single composite health score with contextual factors like criticality, maintenance history, and remaining useful life.
What assets should be included in health monitoring?
Start with critical and high-criticality assets that have the greatest impact on production output, quality, and safety. Include rotating equipment (motors, pumps, compressors), process equipment (furnaces, reactors), and electrical systems (transformers, panels).
Start Your Asset Health Program
Deploy Asset Health Monitoring Across Your Entire Plant
iFactory's asset health monitoring platform gives you complete visibility into the condition of every critical asset — with real-time health scores, automated alerting, failure mode identification, and action tracking. From CNC machines and compressors to furnaces and conveyor lines, iFactory helps you maximise asset reliability and minimise unplanned downtime.

.png)