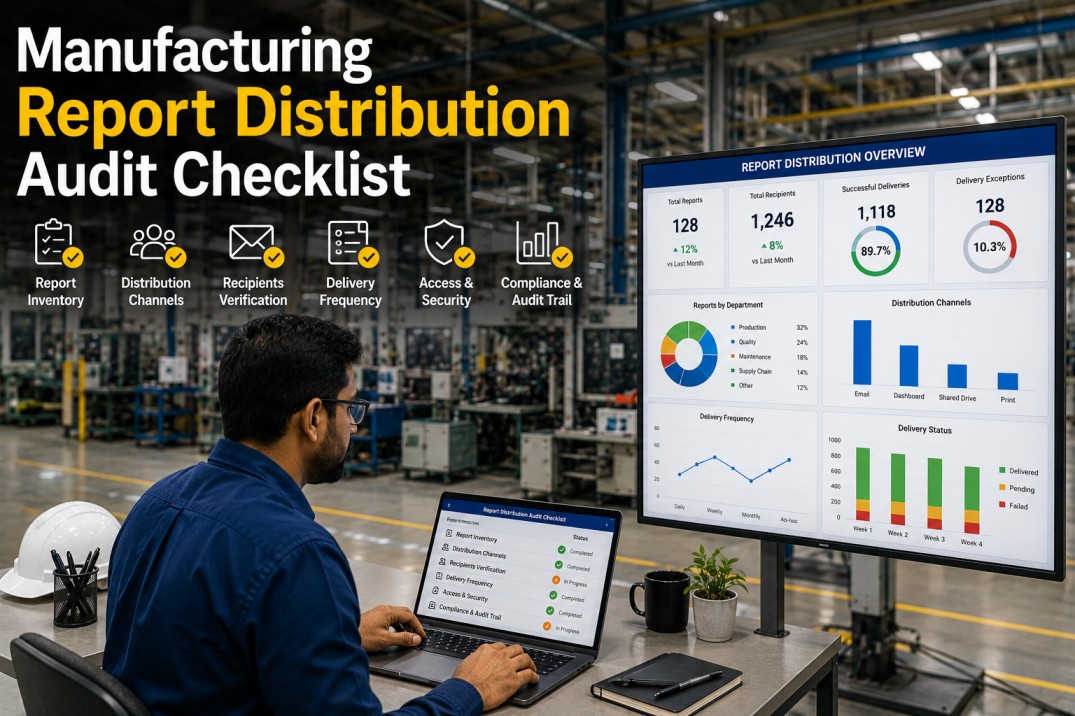
A manufacturing report distribution audit checklist helps plant operations, IT, and analytics teams systematically assess how production reports are delivered across the organisation — covering channels, subscriptions, latency, compliance, routing rules, and coverage gaps. Without a formal distribution audit, reports may reach the wrong people, arrive too late, or never get delivered at all, undermining the value of your entire manufacturing analytics investment. This checklist provides seven essential dimensions for auditing your report distribution ecosystem, from channel health and route mapping to SLA compliance and actionable remediation.
Distribution Channel Health Scoreboard
Monitor the health of your report distribution channels across four core metrics. Each card shows the current score with an inline progress bar and channel-specific SVG icon.
Audit Your Distribution
iFactory Routes Reports to the Right Channel Every Time
iFactory's automated distribution engine delivers operational metrics, quality dashboards, and production KPIs across email, Slack, TV displays, and mobile push — with built-in SLA monitoring, delivery tracking, and subscription management. No more chasing who gets what or whether reports arrived on time.
Report Distribution Route Table
Each report in your manufacturing analytics stack follows a specific distribution route — from generation channel to format, frequency, and target audience. The table below maps every report's routing path for a complete distribution audit.
| Report | Channels | Format | Frequency | Route Type | Recipients |
|---|---|---|---|---|---|
| OEE Dashboard | BI Dashboard | Real-time | Push | 124 | |
| Daily Production Report | PDF Digest | Daily 06:00 | Push | 48 | |
| Quality KPIs | TV Dashboard | Real-time | Broadcast | 24 areas | |
| Shift Performance Summary | Slack Digest | Per shift | Push | 36 | |
| Inventory Snapshot | CSV Export | Weekly Mon 08:00 | Push | 18 | |
| Maintenance KPIs | BI Dashboard | 10 min refresh | Push | 22 | |
| Monthly OEE Report | PDF / Excel | Monthly | Pull | 15 | |
| Energy Consumption | TV + PDF | 15 min refresh | Broadcast | 12 + TV |
Delivery SLA Compliance: Weekly Calendar View
Track on-time delivery compliance for critical reports across the work week. Each cell shows whether the report arrived on schedule (green), was delayed (amber), failed entirely (red), or was not scheduled (grey). The final column shows overall compliance percentage.
| Report | Mon | Tue | Wed | Thu | Fri | Sat | Sun | Compliance |
|---|---|---|---|---|---|---|---|---|
| Daily Production Report | 100% | |||||||
| Shift Performance Summary | 86% | |||||||
| OEE Dashboard | 86% | |||||||
| Quality KPIs | 86% | |||||||
| Inventory Snapshot | 100% | |||||||
| Energy Consumption | 100% | |||||||
| Maintenance KPIs | 71% |
Meet Your SLAs
iFactory Monitors Delivery Compliance in Real Time
iFactory tracks every report delivery against its scheduled SLA — flagging delays, failures, and missed subscriptions instantly. Colour-coded compliance calendars, automated escalation for failed deliveries, and trend analysis ensure your distribution never drops below target.
Distribution Latency Breakdown by Report
Report delivery latency accumulates across four stages — data readiness, generation, rendering, and dispatch. The table below breaks down the total end-to-end delivery time for each report, with inline bars showing the proportional contribution of each stage.
| Report | Data Ready | Generate | Render | Dispatch | Total | Visual Breakdown |
|---|---|---|---|---|---|---|
| Daily Production Report | 12s | 8s | 3s | 2s | 25s | |
| Shift Performance Summary | 5s | 6s | 2s | 1s | 14s | |
| OEE Dashboard | 3s | 4s | 5s | 1s | 13s | |
| Quality KPIs | 4s | 3s | 4s | 1s | 12s | |
| Inventory Snapshot | 45s | 12s | 8s | 3s | 68s | |
| Energy Consumption | 8s | 5s | 6s | 2s | 21s | |
| Maintenance KPIs | 6s | 4s | 5s | 1s | 16s |
Subscription Distribution by Channel
Understanding how subscriptions are distributed across channels reveals coverage gaps and over-reliance on single channels. The table below shows active and inactive subscriptions, delivery success rates, average latency, and coverage percentage per channel.
| Channel | Active Subs | Inactive Subs | Delivery Success | Avg Latency | Coverage | Trend |
|---|---|---|---|---|---|---|
| 1,240 | 87 | 97.3% | 45s | |||
| Slack | 486 | 23 | 94.1% | 12s | ||
| TV Display | 24 | 2 | 99.5% | 3s | ||
| Mobile Push | 312 | 41 | 88.5% | 28s | ||
| Portal | 208 | 15 | 96.8% | 0.5s |
Know Your Subscribers
Get Full Subscription Visibility Across Every Channel
iFactory's subscription management console shows exactly who gets which report on which channel — with active vs inactive subscriber counts, delivery success rates, latency metrics, and trend indicators. Identify orphaned subscriptions, coverage gaps, and channel performance at a glance.
Distribution Routing Rules Reference
Routing rules determine which reports go to which channels based on conditions such as report type, urgency, recipient role, and time of day. The table below catalogues eight common routing rules used in manufacturing report distribution.
| Rule | Condition | Action | Priority | Fallback | Status |
|---|---|---|---|---|---|
| R01 | OEE drops below 85% | Route alert to Slack + Mobile Push | P1 | Email to supervisor | Active |
| R02 | Quality defect rate exceeds threshold | Route alert to Slack + TV Display | P1 | Email to quality manager | Active |
| R03 | Daily production report scheduled | Generate PDF and push to Email + Mobile | P2 | Retry after 5 min | Active |
| R04 | Shift handover initiated | Push shift summary to Slack workspace | P2 | Post to channel + SMS | Active |
| R05 | Maintenance KPI anomaly detected | Route alert to Slack + TV Display | P1 | Email + Mobile push | Active |
| R06 | Weekly inventory snapshot ready | Generate CSV and email to supply chain | P3 | Upload to portal | Active |
| R07 | Energy consumption exceeds budget | Route alert to Slack + Mobile Push | P2 | Email to energy manager | Active |
| R08 | Monthly KPI report generated | Archive PDF and notify distribution list | P3 | Retry daily | Inactive |
Distribution Coverage Gaps and Risks
Identifying coverage gaps and single points of failure is critical to building a resilient report distribution ecosystem. The gaps below represent the most common findings from manufacturing distribution audits across multi-plant environments.
Critical alerts route only through Slack with no email fallback. When Slack is down, shift supervisors miss OEE and quality threshold alerts entirely. Add email as a secondary channel for all P1 routing rules.
TV dashboards refresh on fixed intervals regardless of shift schedule. Night shift operators see stale day-shift data during the first hour of their shift. Link TV refresh cycles to actual shift start times.
Mobile push is only configured for three reports. Maintenance and quality teams on the plant floor rely on walking to TV stations or checking email. Enable mobile push for all shift-relevant operational reports.
Inactive subscriptions (87 for email, 41 for mobile) continue receiving reports, skewing delivery metrics and wasting rendering resources. Implement quarterly subscription audit and auto-disable after 90 days of inactivity.
Night shift reports are only delivered via email. Operators on the floor rarely check email during shifts. Add Slack channel delivery and TV broadcast for all night-shift critical reports.
When a report fails to deliver (e.g., OEE Dashboard failed Wednesday), no automated alert reaches the distribution admin. Failures are only discovered when users complain. Configure admin alerts for any delivery failure exceeding 5 minutes.
Frequently Asked Questions
What is a manufacturing report distribution audit?
A manufacturing report distribution audit is a systematic evaluation of how production reports are delivered across the organisation — covering which channels are used (email, Slack, TV, mobile, portal), who receives each report, whether SLAs are met, what routing rules govern delivery, and where coverage gaps exist. The goal is to ensure every decision-maker receives the right report on the right channel at the right time.
How often should a distribution audit be conducted?
A full distribution audit covering channels, subscriptions, SLA compliance, and routing rules should be conducted quarterly. Light weekly checks should focus on delivery success rates and SLA compliance for critical reports (OEE, quality, safety, shift performance). After any major change — new report, new channel integration, org restructuring — conduct an immediate targeted audit of the affected distribution routes.
What are the most common report distribution failures?
The five most common distribution failures in manufacturing plants are: (1) single-channel dependency with no fallback for critical alerts, (2) stale subscriptions where inactive users continue receiving reports, (3) shift mismatch where reports are scheduled for day shift but needed by night shift, (4) undetected delivery failures with no admin notification, and (5) format incompatibility where mobile users receive desktop-only PDF attachments. Each of these can be addressed through proper routing rules and multi-channel configuration.
What should be included in a distribution SLA?
A comprehensive distribution SLA should define: maximum delivery latency per channel (e.g., Slack under 10s, email under 60s), minimum delivery success rate (e.g., 99% for P1 reports), maximum allowable failure rate, escalation path for failed deliveries, response time for delivery incidents, scheduled maintenance windows, and reporting frequency for SLA compliance metrics. Each report type should have its own SLA tier based on criticality.
How can iFactory help with report distribution?
iFactory's manufacturing analytics platform includes a built-in distribution engine that automatically routes reports across email, Slack, TV displays, and mobile push based on configurable rules. It tracks delivery success, latency, and SLA compliance in real time, surfaces coverage gaps, and manages subscriptions with automatic inactivity cleanup. Distribution is fully integrated with iFactory's report builder — any dashboard or report can be scheduled to any channel with a few clicks.
Start Your Audit
Get Complete Report Distribution Visibility with iFactory
iFactory gives you end-to-end visibility into your manufacturing report distribution — channel health, routing rules, SLA compliance, subscription management, and automated failure alerting — all from a single console. Stop guessing who gets what and start delivering reports that drive decisions.