A manufacturing KPI tree — also called a KPI cascade or metric tree — is the single most effective tool for aligning plant-floor activity with financial performance. At its simplest, a KPI tree starts with a top-line financial metric such as EBITDA or operating income and breaks it down through successive levels of operational, process, and driver KPIs until every operator on the plant floor can see how their daily work connects to the company's bottom line. This page provides a step-by-step method for building a manufacturing KPI tree, with concrete examples, a decomposition template, and guidance on setting targets, assigning ownership, and keeping the tree alive as business conditions change.
The Manufacturing KPI Tree: From EBITDA to the Plant Floor
A KPI tree is a hierarchical decomposition of a top-level financial metric into its operational drivers. Think of it as an org chart for your metrics — each level breaks a higher-level KPI into the components that drive it. The SVG tree below shows a typical manufacturing KPI tree starting from EBITDA, through revenue and cost drivers, down to operational KPIs such as OEE, throughput, first-pass yield, and cycle time, and finally to driver-level metrics such as availability, performance, quality, micro-stops, and scrap rate.
Four Levels of the Manufacturing KPI Tree
A well-structured KPI tree spans four distinct levels, each serving a different audience and decision horizon. Level 1 is financial — the metrics the board and CFO care about. Level 2 is operational — what the plant manager tracks weekly. Level 3 is process — what the supervisor sees on their shift. Level 4 is driver — the micro-metrics the operator acts on in real time. The four cards below show the typical KPI at each level, who owns it, and the decision it supports.
KPI Tree Registry: 12 Essential Metrics Mapped Across All Levels
A KPI tree is only as useful as the definitions behind it. The scrollable table below lists twelve essential manufacturing KPIs across all four tree levels, with their formulas, data sources, owners, and tree position. Use this as a template when building your own KPI tree — copy the structure, replace the KPIs with your plant's metrics, and populate the data sources from your actual systems.
| Level | KPI | Formula / Definition | Data Source | Owner | Tree Position |
|---|---|---|---|---|---|
| L1 | EBITDA | Operating Income + Depreciation + Amortisation | ERP (GL) | CFO | Root |
| L1 | Operating Income | Revenue − COGS − Operating Expenses | ERP (P&L) | CFO | Root child |
| L2 | OEE | Availability × Performance × Quality | MES / SCADA | Plant Mgr | Operational |
| L2 | Throughput | Good units produced / time period | MES / Line sensors | Plant Mgr | Revenue driver |
| L2 | First Pass Yield | Good units at first pass / total units started | Quality system | Plant Mgr | Quality |
| L2 | Scrap Rate | Scrap units / total units produced | Quality / MES | Plant Mgr | Material cost |
| L3 | Availability | Operating time / planned production time | SCADA / PLC | Supervisor | OEE component |
| L3 | Performance | Actual speed / ideal speed | SCADA / PLC | Supervisor | OEE component |
| L3 | Quality | Good units / total units produced | Quality system | Supervisor | OEE component |
| L4 | Micro-Stops | Count of stops < 5 minutes per shift | PLC / sensors | Operator | Availability driver |
| L4 | Speed Loss | Actual speed vs rated speed (units/hr) | PLC / SCADA | Operator | Performance driver |
| L4 | First-Off Failure | First unit rejected after changeover | Quality / MES | Operator | Quality driver |
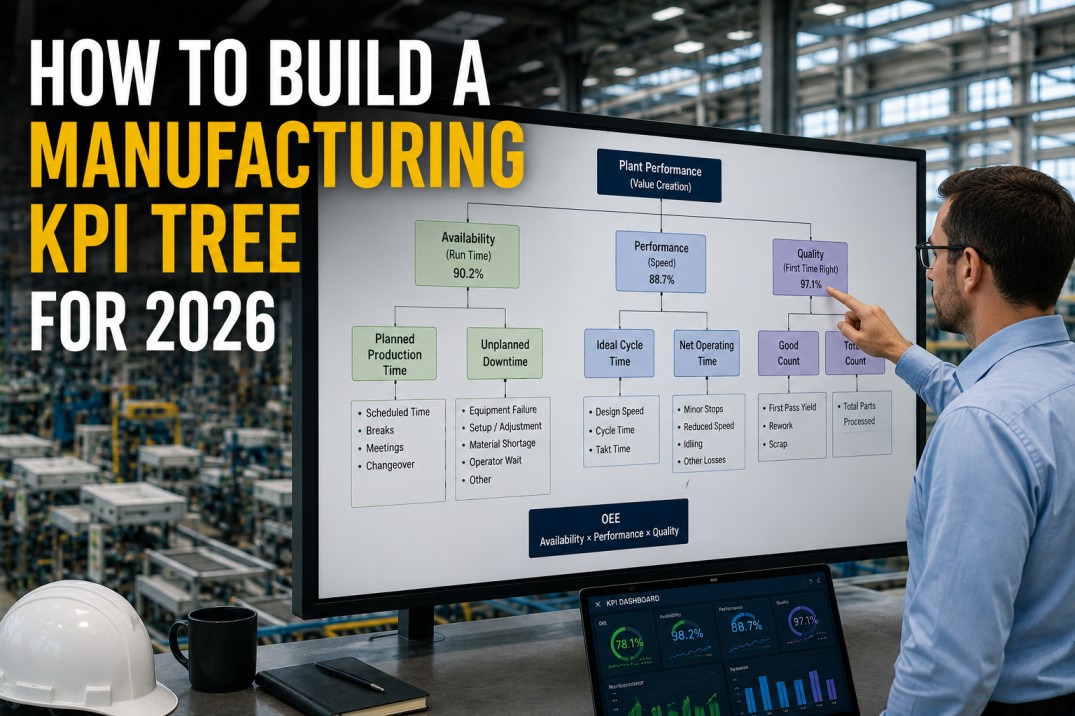
OEE Decomposition: How One KPI Breaks into Six Drivers
OEE is the most popular operational KPI in manufacturing — and the best illustration of how a KPI tree works in practice. OEE = Availability × Performance × Quality. Each of those three components breaks down further into driver metrics that operators can act on. The SVG diagram below traces the full decomposition of OEE, showing how a single high-level KPI connects to six actionable driver metrics on the plant floor.
Who Owns Each Level of the KPI Tree
A KPI tree without clear ownership is just a diagram. Each metric in the tree must have a named owner — a person who is accountable for the metric's performance, not just informed about it. The four role cards below map the typical ownership structure across the four levels, from the operator who owns micro-stops to the CFO who owns EBITDA. In iFactory's platform, each owner sees their level of the tree by default, can drill down to investigate variance, and receives automated alerts when a metric they own moves outside its target range.
Setting Targets Across the KPI Tree: Current, Target, and Stretch
Every KPI in the tree needs three numbers: a current value, a target (the plan), and a stretch target (what best-in-class looks like). Targets cascade downward — the EBITDA target drives the OEE target, which drives the availability target, which drives the micro-stop target. The five cards below show how targets are set at different levels of the tree, with guidance on how to derive them from historical performance, benchmarking, and financial modelling.
Frequently Asked Questions
What is a manufacturing KPI tree and why do I need one?
A manufacturing KPI tree is a hierarchical decomposition of a top-line financial metric — such as EBITDA or operating income — into the operational, process, and driver-level KPIs that determine its performance. Think of it as a family tree for your metrics: EBITDA at the top, OEE and throughput in the middle, and micro-stops and speed loss at the bottom. You need one because it creates a direct, transparent line of sight from every operator's daily decisions to the company's financial results. Without a KPI tree, you have a collection of disconnected metrics that may or may not be driving the outcomes that matter. With a KPI tree, every metric has a parent, a child, and a clear reason for existing.
How many KPIs should be in a manufacturing KPI tree?
A well-constructed KPI tree typically contains 15–30 KPIs across four levels. The exact number depends on the complexity of your manufacturing operation, the number of product lines, and the level of granularity required for decision-making. A single-line plant with a simple process might have 12–15 KPIs in the tree. A multi-line, multi-shift plant with complex processes might have 35–40. The key constraint is that every KPI in the tree must have a clear owner, a verified data source, a standard formula, and a visible link to the KPI above and below it. If a metric does not meet all four criteria, it should not be in the tree — add it as a supporting metric instead.
How do you calculate targets for KPIs in the tree?
Targets are set from the top down and validated from the bottom up. Start with the financial target (e.g., 18% EBITDA margin). Ask: what OEE does the plant need to achieve to support that margin? That becomes the OEE target. Then ask: what availability, performance, and quality do we need to achieve that OEE? Those become the L3 targets. Then ask: what micro-stop count and speed loss correspond to that availability and performance? Those become the L4 targets. The bottom-up validation step checks whether the L4 targets are realistically achievable given current equipment condition, operator capability, and maintenance practices. If the bottom-up number does not support the top-down target, either the financial target needs adjustment, or a capital investment is required to close the gap. iFactory's platform includes a target-setting tool that automates this cascade and highlights gaps between current performance and the target at every level.
How often should the KPI tree be updated?
The structure of the tree (which KPIs exist and how they connect) should be reviewed quarterly and revised annually. The data behind each KPI should update automatically — L4 driver metrics in real time, L3 process metrics hourly, L2 operational metrics daily, and L1 financial metrics monthly or as the ERP closes. The targets within the tree should be reviewed monthly as part of the plant's performance review cycle, with adjustments made based on actual performance, changing business conditions, and improvement project outcomes. The tree structure itself should change only when there is a significant change in the business — a new product line, a major capital investment, a plant expansion, or a strategic shift. In iFactory's platform, the tree structure is configured once and the data flows automatically, so updating targets or adding new metrics is a configuration change that takes minutes, not weeks.
What is the difference between a KPI tree and a balanced scorecard?
A KPI tree and a balanced scorecard serve different purposes and are complementary rather than competing. A balanced scorecard is a strategic management framework that organises metrics across four perspectives: financial, customer, internal process, and learning & growth. It is broad and covers the entire business. A KPI tree is a financial-operational decomposition that shows exactly how operational performance drives financial outcomes — it is deep rather than broad. The two can coexist: the KPI tree sits inside the internal process and financial perspectives of the balanced scorecard, providing the causal chain from operator actions to financial results. Many plants use both: a balanced scorecard for strategic reviews and a KPI tree for day-to-day operational management and drill-down analysis. iFactory supports both frameworks in the same platform, so a plant can have a balanced scorecard dashboard for the plant manager and a KPI tree for the production team, all drawing from the same governed data.
Build Your Tree
Deploy Your Clickable KPI Tree on iFactory — in Weeks, Not Months
You now have the full methodology: the tree structure, the four levels, the KPI registry, the OEE decomposition, the ownership model, and the target-setting framework. The next step is to build your plant's KPI tree in iFactory's platform — starting with a 30-minute workshop where you map your top-line financial metric down to the driver metrics your operators control. Our team will configure the tree, connect the data sources, and train your team on drill-down navigation. Within four weeks, every level of your organisation will see their metrics live and know exactly how their decisions impact the financial outcome.