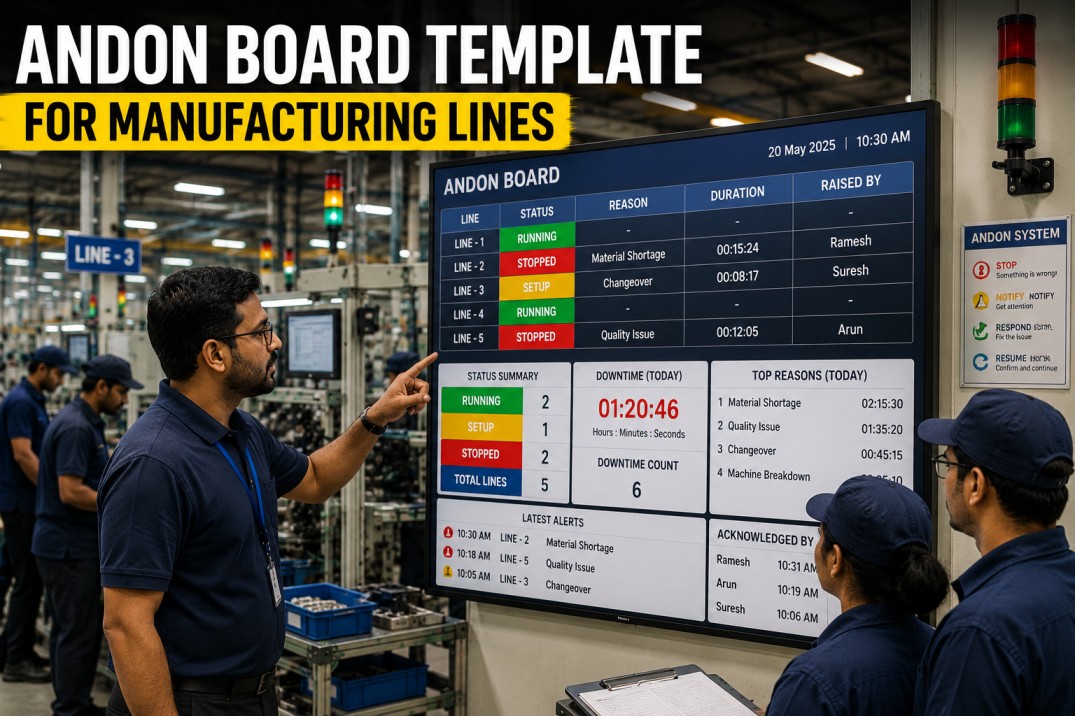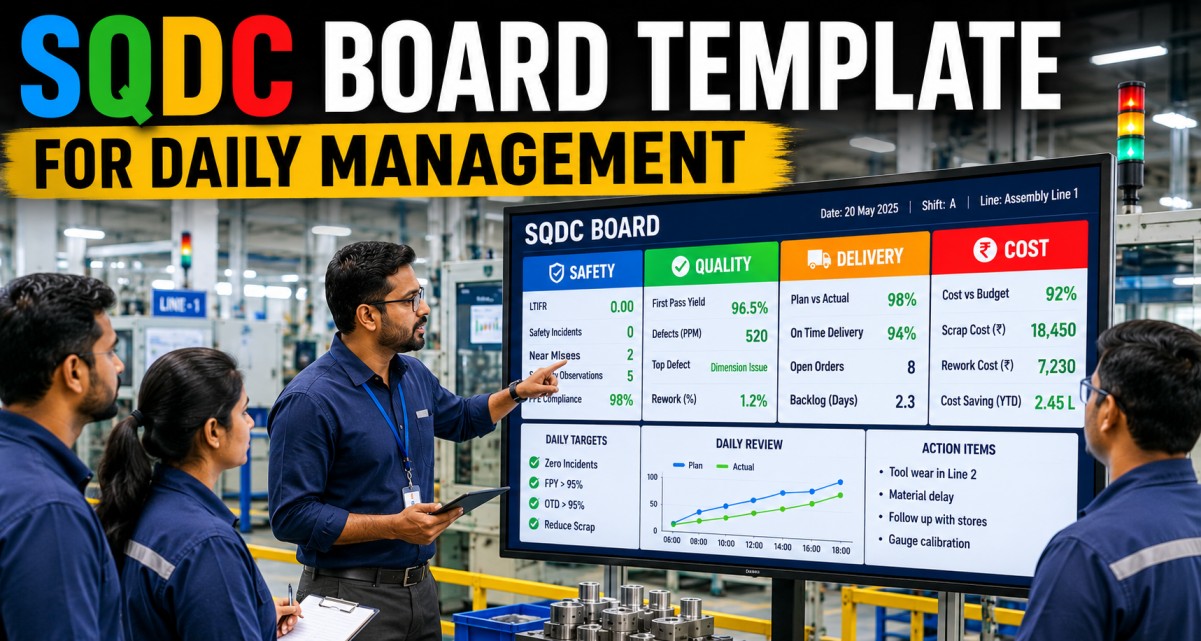
An SQDC (Safety, Quality, Delivery, Cost) board is the cornerstone of lean daily management in manufacturing. Originating from the Toyota Production System, the SQDC board provides a single visual summary of how a production area, cell, or plant is performing against its most critical operational targets. Replacing the traditional dry-erase board with a live digital SQDC template transforms daily standup meetings from passive reviews into data-driven decision sessions — where every metric, trend, and action item is updated in real time from your MES, ERP, and quality systems. This page breaks down the essential components of a digital SQDC board template, showing you exactly what to track, how to visualise each dimension, and how iFactory's manufacturing analytics platform brings the board to life without manual data entry.
Get Started
Replace Your Dry-Erase SQDC Board with a Live Digital Screen
iFactory connects to your plant-floor systems to deliver real-time SQDC boards that update automatically — no whiteboard markers, no spreadsheet uploads, no manual data entry before the morning meeting.
SQDC Daily Scoreboard
The SQDC scoreboard is the central element of any daily management board. Each quadrant displays the current status for one dimension — Safety, Quality, Delivery, Cost — with a large metric value, target comparison, status indicator, and a trend arrow showing direction from the previous period. The scoreboard is designed to be read from across the room in under five seconds.
Safety Metrics Deep Dive
Safety is always the first section on any SQDC board. The safety metrics panel tracks leading and lagging indicators — from lost time incidents (lagging) to near-miss reporting rates (leading). Each metric includes a colour-coded status indicator and a comparison against the previous period to highlight emerging risk patterns before they escalate.
Quality Metrics with Inline Ring Gauges
Quality metrics on the SQDC board must communicate performance at a glance. The inline ring gauges below show actual vs target for each quality KPI — a full ring indicates target achieved, while a partial ring highlights the gap. This visual encoding enables the standup team to instantly identify which quality metrics need attention without reading numbers.
| Metric | Ring | Actual | Target | Gap | Status |
|---|---|---|---|---|---|
| First Pass Yield | 97.2% | 97.0% | +0.2% | Met | |
| Scrap Rate | 2.8% | 1.5% | +1.3% | Above | |
| Rework Rate | 3.5% | 2.0% | +1.5% | Above | |
| Customer Complaints | 0 | 0 | 0 | Met | |
| Cpk (Critical Char.) | 1.33 | 1.67 | -0.34 | Below |
Live Quality Tracking
See Your Quality Metrics Update in Real Time
iFactory's SQDC board pulls First Pass Yield, scrap rates, rework, and Cpk directly from your MES and QMS — eliminating manual data entry and ensuring your morning standup always reflects the most recent production results.
Delivery Performance Heatmap
The delivery panel on the SQDC board tracks on-time performance across four critical metrics, visualised as a day-by-day heatmap for the past seven days. This pattern reveals daily delivery trends and highlights specific days where performance dropped — enabling the standup team to investigate root causes while the context is still fresh.
| Metric | Mon | Tue | Wed | Thu | Fri | Sat | Sun | Avg |
|---|---|---|---|---|---|---|---|---|
| On-Time Delivery | 96% | 97% | 93% | 96% | 88% | -- | -- | 94.5% |
| Schedule Attainment | 98% | 99% | 91% | 94% | 97% | -- | -- | 95.8% |
| Backlog (orders) | 42 | 38 | 55 | 51 | 44 | -- | -- | 46 |
| Past Due Orders | 3 | 2 | 7 | 5 | 4 | -- | -- | 4.2 |
Cost Variance Breakdown
The cost panel on the SQDC board tracks production cost efficiency against budgeted targets. Each metric shows the current actual, target, variance percentage, and a visual progress bar. The variance direction arrow tells the standup team immediately whether cost performance is improving or deteriorating compared to the previous period.
| Metric | Actual | Target | Variance | Bar | Direction |
|---|---|---|---|---|---|
| Production Cost / Unit | $12.40 | $11.80 | +5.1% | ||
| OEE | 98.2% | 95.0% | +3.4% | ||
| Downtime % | 4.8% | 5.0% | -4.0% | ||
| Scrap Cost | $8,200 | $6,500 | +26.2% | ||
| Inventory Turns | 8.2 | 10.0 | -18.0% |
Optimise Costs
Track OEE, Scrap Costs, and Production Cost Per Unit Live
iFactory's cost panel connects OEE, downtime, scrap cost, and inventory data from your ERP and MES — giving your standup team a real-time view of cost performance without waiting for month-end cost accounting reports.
Daily Standup Action Board
The action board is the most important section of any SQDC board — it converts yesterday's performance gaps into today's action items. Each action includes a clear owner, due date, and status. The standup team reviews open actions, updates status, and closes completed items before identifying new actions based on the current SQDC scoreboard.
| # | Action Item | SQDC | Owner | Due | Status |
|---|---|---|---|---|---|
| 1 | Investigate scrap spike on Line 3 — review SPC data from last 24 hours | Quality | J. Park | Today | Open |
| 2 | Resolve packing line downtime root cause — air cylinder replacement | Delivery | M. Chen | Today | In Progress |
| 3 | Complete remaining 3 safety audits for the month | Safety | A. Smith | This Week | Open |
| 4 | Review Cpk improvement plan with quality team — target 1.67 | Quality | L. Kim | This Week | Done |
| 5 | Update production schedule for next week's customer order spike | Delivery | R. Patel | Tomorrow | In Progress |
| 6 | Investigate production cost variance — material yield vs BOM standard | Cost | S. Davis | Friday | Open |
SQDC Weekly Trend Cards
Weekly trend cards provide the historical context that the daily scoreboard cannot show. Each card plots the six most recent weekly values for one SQDC dimension using an SVG sparkline, showing whether the metric is trending in the right direction. The current-week highlight bar makes it easy to compare this week's performance against the recent trend.
Frequently Asked Questions
What is an SQDC board used for?
An SQDC board is a visual management tool used during daily standup meetings in manufacturing plants. It displays the current status of Safety, Quality, Delivery, and Cost metrics for a specific production area, cell, or plant. The board enables teams to quickly assess performance, identify gaps against targets, assign corrective actions, and track progress from day to day. It originated from the Toyota Production System and is a core component of lean daily management.
What is the difference between SQDC and SQDCM?
SQDC (Safety, Quality, Delivery, Cost) and SQDCM (Safety, Quality, Delivery, Cost, Morale) are variants of the same daily management framework. SQDCM adds a fifth dimension — Morale or Motivation — to track team engagement, attendance, training, and suggestion programmes. Some organisations also use SQDCIP (adding Inventory and Productivity) or SQDCP (adding People). The four-core SQDC format is the most widely adopted and is the recommended starting point for plants new to daily management boards.
How often should an SQDC board be updated?
For digital SQDC boards, metrics should update automatically from source systems in real time or at least every shift change. Manual dry-erase boards are typically updated once per shift by the area supervisor. The key principle is that the board must reflect the current state at the time of the daily standup meeting — stale data erodes trust in the board and undermines the effectiveness of the daily management process.
What metrics should be on an SQDC board?
Each plant should select 4-6 metrics per SQDC dimension that align with its operational goals. Common safety metrics include lost time incidents, first aid cases, near misses, and safety audit completion. Quality metrics typically include first pass yield, scrap rate, rework rate, and Cpk. Delivery metrics cover on-time delivery, schedule attainment, backlog, and past due orders. Cost metrics focus on production cost per unit, OEE, downtime percentage, scrap cost, and inventory turns. The key is to keep the board focused — too many metrics dilute attention during the standup.
How does iFactory automate SQDC boards?
iFactory connects to your plant-floor systems — MES, ERP, SCADA, CMMS, and QMS — to pull live data into a digital SQDC board that updates automatically. The scoreboard, metric panels, delivery heatmap, cost variance table, action board, and trend cards are all populated from source data without manual entry. iFactory's SQDC template is customisable per area, cell, or plant and can be displayed on TVs, tablets, or desktops. The platform also supports drill-down from any metric to the underlying detail for root cause analysis during the standup.
Get Your Template
Download a Live SQDC Board Template for Your Plant
iFactory's digital SQDC board template connects to your existing MES, ERP, and quality systems — giving you a live daily management board without spreadsheets, dry-erase markers, or manual updates. See it running on your data in a 30-minute personalised demo.