Plant Performance Review Template for Monthly Ops Reviews
By Daniel Kingsley on June 11, 2026
Every plant manager knows the feeling: it's the last week of the month, and someone's pulling together the ops review from five different spreadsheets, three email threads, and a production log that hasn't been updated since Tuesday.
The Monthly Operations Review — MOR — is the most consequential meeting on the plant calendar. It sets the direction for the next 30 days, surfaces what broke, and holds the organization accountable to the numbers. But when the review itself takes two days to build, something has gone wrong before the meeting even starts.
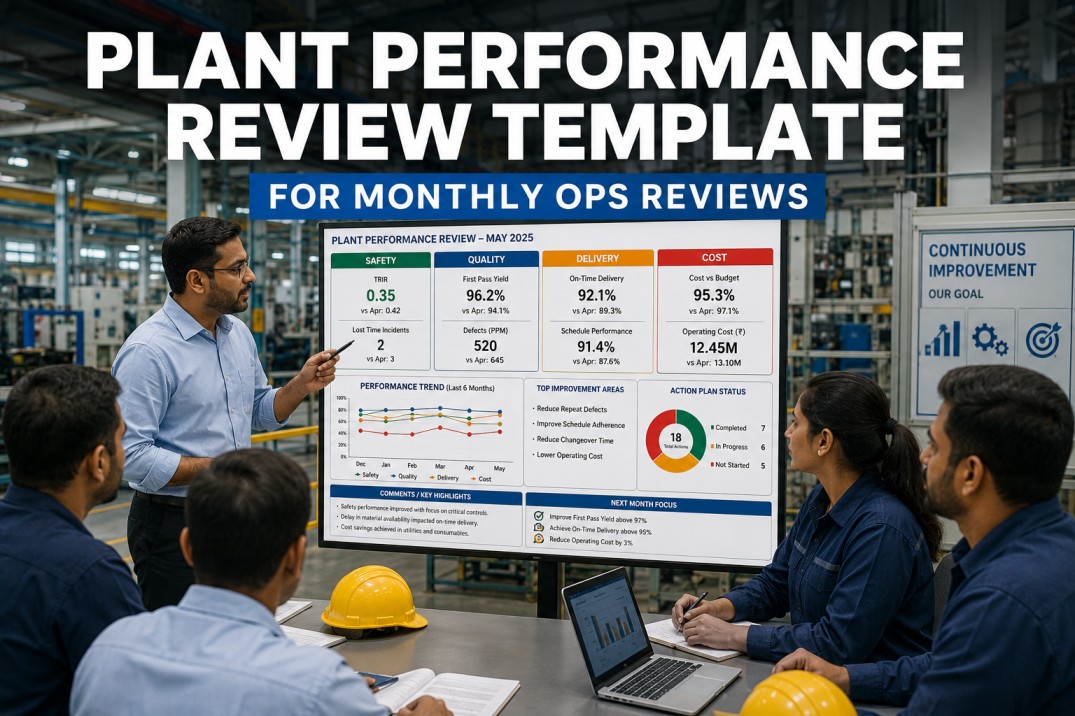
This page gives you the complete structure for a professional Plant Performance Review — covering all five SQDCP pillars: Safety, Quality, Delivery, Cost, and People. Use the template framework below to run tighter, faster, more actionable monthly reviews. And if you want iFactory to generate it automatically from your live plant data, that's one click.
Monthly Operations Review
Stop building your MOR. Start running it.
iFactory generates your full SQDCP plant performance review from live data — automatically, every month, on schedule.
A monthly ops review that lacks structure doesn't just waste time — it produces decisions based on incomplete data, misaligned priorities, and last-minute narrative instead of trends.
2–4 hrs
Average prep time per MOR, pulling from disconnected sources
43%
of plant managers say MOR data is already outdated when the meeting starts
No std.
Most U.S. plants run MORs with formats that change every month
3–5
Data owners chased every month — safety, quality, production, finance, HR
The SQDCP framework is the industry standard for plant-level performance reviews. Here is every section, what it contains, and the KPIs that belong in each pillar.
MOR
Monthly Operations Review
Plant: _________________ · Period: Month / Year · Owner: _________________
On Target
At Risk
Off Target
Safety
Zero-harm performance & compliance
TRIR (Total Recordable Incident Rate)Target ≤ 1.2
On Target
Near Miss Reports FiledTarget ≥ 10/month
At Risk
Safety Observations CompletedTarget 100%
On Target
Days Since Last Recordable IncidentTrend: Increasing
On Target
Open Safety CAPAs OverdueTarget 0
Off Target
Action Items / Owner / Due Date
Quality
Conformance, defects & customer escapes
First Pass Yield (FPY)Target ≥ 97%
At Risk
Customer Escapes / Field ComplaintsTarget 0
On Target
Internal Defect Rate (PPM)Target ≤ 500 PPM
Off Target
Scrap & Rework Cost ($)vs. Monthly Budget
At Risk
Supplier NonconformancesTrend: Declining
On Target
Action Items / Owner / Due Date
Delivery
Schedule attainment, OTD & lead time
On-Time Delivery (OTD) to CustomerTarget ≥ 95%
On Target
Production Schedule AttainmentTarget ≥ 95%
At Risk
Manufacturing Lead Time (days)Trend: Flat or declining
On Target
Backlog / Past-Due OrdersTarget ≤ 2% of total
Off Target
Inventory Turnsvs. Plan
At Risk
Action Items / Owner / Due Date
Cost
Budget variance, OEE & unit economics
OEE (Overall Equipment Effectiveness)Target ≥ 75%
Off Target
Manufacturing Cost per Unitvs. Standard Cost
At Risk
Budget Variance (Total Plant Spend)Target within ±3%
On Target
Overtime Hours (% of total labor)Target ≤ 8%
On Target
Energy Cost per Unit ProducedTrend: Flat or declining
At Risk
Action Items / Owner / Due Date
People
Workforce engagement, capability & attendance
Absenteeism RateTarget ≤ 3%
On Target
Voluntary Turnover RateTarget ≤ 10% annualized
At Risk
Training Hours per OperatorTarget ≥ 4 hrs/month
Off Target
Open Positions — Critical RolesTrend: Declining
At Risk
Cross-Training CoverageTarget ≥ 80%
On Target
Employee Suggestions SubmittedTrend: Increasing
On Target
Action Items / Owner / Due Date
Meeting Structure
The 60-Minute MOR Agenda That Actually Works
The most effective monthly ops reviews are structured, time-boxed, and action-focused. Here is a field-tested agenda that keeps the meeting moving without skipping what matters.
0–5 min
Safety Moment & Housekeeping
Open every MOR with a safety observation, near miss share, or incident review. Sets tone. Confirm attendance and verify data packages were distributed 24 hours in advance.
5–20 min
SQDCP Scorecard Walk
Present the full scorecard — one view per pillar. For each metric: Actual vs. Target, trend direction, and RAG status. No narrative yet — just the numbers. Save discussion for the deep dive.
20–40 min
Deep Dive: Red & Yellow Items Only
Structured time on metrics that missed target or are trending wrong. For each: root cause, owner, corrective action, firm due date. Greens get acknowledged, not discussed at length.
40–50 min
Prior Month Action Review
Status of every action from last month's MOR. Each is closed, extended with justification, or escalated. No action should carry forward more than 60 days without executive awareness.
50–60 min
Next Month Outlook & New Actions
Known risks, planned projects, and capacity changes for the next 30 days. Confirm action register updates. Assign next MOR prep owner and confirm date before adjourning.
iFactory MOR Automation
Your next monthly review could be generated — not assembled.
iFactory pulls live SQDCP data from your plant and builds the scorecard automatically. No spreadsheets. No last-minute data chases. Just a review-ready report every month, on schedule.
Distribute data packages 24 hours before the meeting
Attendees who arrive having reviewed the scorecard spend meeting time on decisions, not orienting to the numbers.
02
Spend zero time on green metrics
Acknowledge greens with a brief note, then move on. The meeting's value is in diagnosing what's off target — not reviewing what's working.
03
Every red item needs an owner before the meeting closes
A red metric with no assigned corrective action owner is just a problem that was observed, not addressed.
04
Track MOR action closure rate as a KPI itself
Measure the percentage of prior-month actions closed on time. A plant where 60% carry forward each month has a follow-through problem, not just a performance problem.
05
Normalize every metric to production volume
Defect count means nothing without units produced context. Every MOR metric should have a denominator — units, tons, or hours run.
06
Use 12-month rolling trends, not monthly snapshots
Single-month comparisons are vulnerable to seasonality and one-time events. A 12-month trend line reveals whether the plant is genuinely improving.
07
Lock the format — no exceptions, ever
Consistency in the MOR format is what makes year-over-year comparison possible. When the deck changes monthly, historical context disappears.
FAQ
Frequently Asked Questions
What is SQDCP and why is it the standard for plant performance reviews?
SQDCP stands for Safety, Quality, Delivery, Cost, and People — the five pillars that collectively represent holistic plant performance. It originated in lean manufacturing and has become the dominant MOR framework in U.S. process and discrete manufacturing because it forces balance: a plant that excels in cost but ignores safety is not actually performing well. The SQDCP structure makes tradeoffs visible.
How is a Monthly Operations Review (MOR) different from a weekly ops review?
A Weekly Operations Review is area-specific and shift-focused, typically owned by a production supervisor. The MOR rolls up all areas into a single view for plant management and sometimes corporate leadership. MOR KPIs are broader and more cross-functional — a single KPI like OEE or OTD may aggregate data from multiple departments or lines.
How many KPIs should a monthly plant review include?
Best practice is 3–6 KPIs per SQDCP pillar — roughly 18–25 total metrics. More than that and the review becomes a data dump. Each KPI should have a defined target, a trend direction, and a clear owner. If a metric has no one accountable for it, it does not belong in the MOR.
Can this template work for multi-plant enterprises?
Yes. The SQDCP structure is identical at every plant level, which is precisely what makes multi-site rollups possible. Each plant runs its own MOR with plant-level KPIs; a corporate ops review aggregates those scorecards into enterprise metrics. iFactory supports both plant-level and enterprise rollup views from the same data source.
How does iFactory generate the monthly review automatically?
iFactory connects to your production data, quality management system, ERP, and sensor feeds. Once configured, it pulls the prior month's SQDCP data, calculates actuals vs. targets, populates trend charts, and surfaces open CAPAs within each pillar — all in a standardized review format. You review and distribute; iFactory does the build.
What file format does the iFactory MOR export to?
iFactory supports PDF export for distribution, PowerPoint for live presentation, and a web-based dashboard view for interactive review in-meeting. All formats share the same underlying data, so there is no inconsistency between the presentation deck and the actual numbers.
Ready to Automate Your MOR?
Stop reviewing energy waste in hindsight. Walk into every monthly meeting with a complete, data-fresh SQDCP scorecard — generated automatically by iFactory.