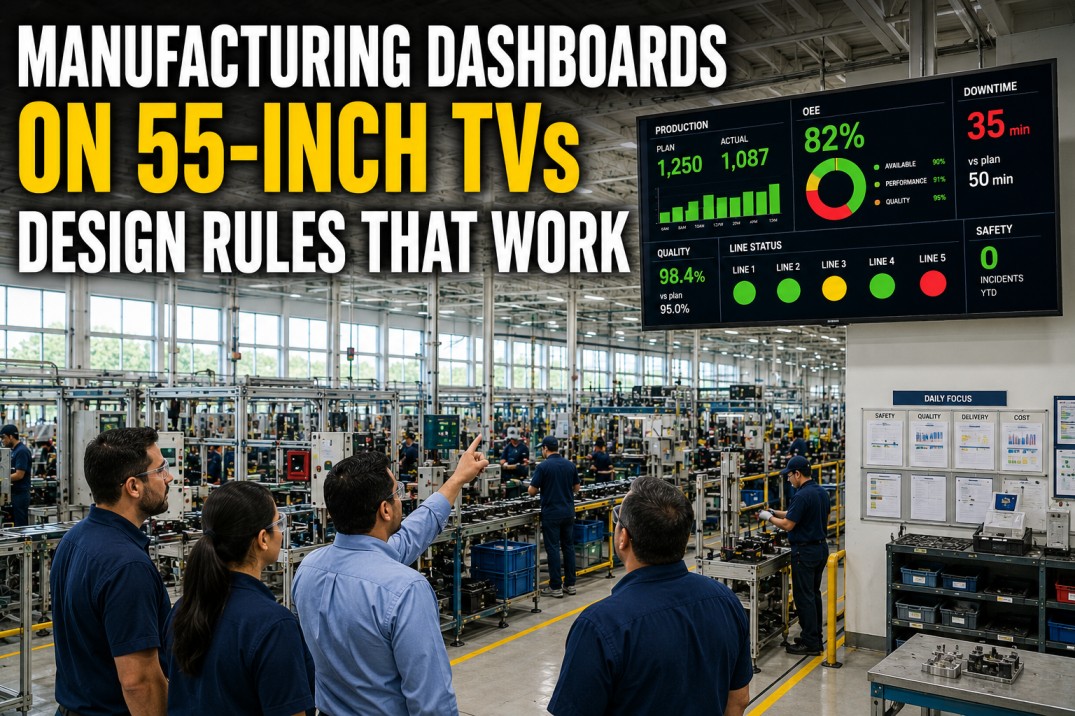
Putting manufacturing dashboards on large TV displays is fundamentally different from designing for desktop monitors or tablets. A 55-inch TV viewed from 15 feet has different legibility requirements, colour constraints, and content density limits than a 24-inch monitor. Operators scan TV dashboards in three to five seconds while walking past — they do not sit down and explore. Every element must be instantly readable, every status indicator immediately interpretable, and every screen must answer one operational question without clutter. This guide covers seven essential design rules and reference tables for creating TV dashboards that operators actually use.
Get the TV Dashboard Design Checklist
A Printable Reference Card with Font Sizes, Viewing Distances, Colour Rules, and Layout Templates for Your Plant Floor.
The TV dashboard design checklist condenses all seven rules into a single printable reference card. It covers minimum font sizes for 10–20 ft viewing distances, optimal viewing distance for 43–65 inch displays, a colour palette guide with contrast ratios, and four proven layout templates. Print it, laminate it, and keep it with your TV deployment kit to ensure every dashboard follows consistent legibility standards.
TV Dashboard Design Rules Scoreboard
The scoreboard tracks the four most critical parameters for any TV dashboard deployment on the plant floor. These parameters serve as the minimum viability check before any dashboard goes live on a 55-inch display: viewing distance must be within the optimal range, font sizes must meet the minimum threshold, the number of data lines must not exceed the cognitive scan limit, and the auto-refresh interval must keep data current enough for operational decisions.
Six Essential TV Dashboard Design Rules
These six rules form the foundation of every effective plant-floor TV dashboard. They are derived from decades of human factors research in control room design, industrial ergonomics, and visual display unit standards (ISO 9241). Each rule addresses a specific failure mode observed in manufacturing plants where TV dashboards were deployed without design standards and subsequently ignored by operators.
See iFactory’s TV Dashboard in Action
A 10-Minute Demo Showing How iFactory’s TV-Ready Dashboards Look on 55-inch Screens at 15 Feet.
iFactory’s dashboards are purpose-built for TV displays. Every template follows six design rules: minimum 24 px fonts, maximum six data lines per screen, high-contrast dark themes, and auto-refresh under 30 seconds. The 10-minute demo walks through four layouts — OEE Monitor, Shift Production, Quality Status, and Andon Alert Board — on a 55-inch TV at 15-foot viewing distance. You will see how each rule translates into a dashboard operators can read from across the plant floor.
Four Proven TV Dashboard Layout Templates
The layout determines how operators scan and interpret the dashboard. Each of these four layout templates has been tested on plant floors across discrete manufacturing and process industries. The right layout depends on the primary consumer of the dashboard: a single big metric for executives walking the floor, a metric grid for supervisors at their station, a timeline for line-side operators, and a split panel for production meetings.
Font Size Reference Table: Screen Size, Distance, and Legibility
Font size is the single most important variable in TV dashboard design. A font that is too small renders the entire dashboard useless, no matter how good the data or layout. This reference table provides the minimum font size, optimal number of data lines, and maximum characters per line for the most common TV sizes and viewing distances on manufacturing plant floors.
| Screen Size | View Distance | Min Font Size | Optimal Lines | Max Char/Line |
|---|---|---|---|---|
| 43" | 10 ft | 20 px | 8 | 12–14 |
| 43" | 15 ft | 28 px | 5 | 10–12 |
| 43" | 20 ft | 36 px | 3 | 8–10 |
| 55" | 10 ft | 16 px | 10 | 14–16 |
| 55" | 15 ft | 24 px | 6 | 12–14 |
| 55" | 20 ft | 32 px | 4 | 9–11 |
| 65" | 15 ft | 20 px | 8 | 14–16 |
| 65" | 20 ft | 28 px | 5 | 11–13 |
Colour Usage Guide for Plant-Floor TV Dashboards
Colour on a plant-floor TV dashboard serves two purposes: legibility and status communication. Every colour choice must be validated against three criteria: contrast ratio against the background (minimum 4.5:1), the colour’s intuitive meaning in a manufacturing context, and visibility under the specific lighting conditions of the installation location. The following six-colour palette covers all standard dashboard use cases.
Content Type Recommendations for TV Dashboards
Not every manufacturing metric belongs on a TV dashboard. Some metrics are best consumed on desktop or mobile where operators can interact with the data. The table below rates eight common manufacturing content types on their suitability for 55-inch TV display, considering font size requirements, update frequency, and the cognitive load of interpreting the visualisation at a distance.
Eight-Step TV Dashboard Setup Checklist
Deploying a TV dashboard on the plant floor involves more than just designing the screen. The physical installation — mount height, cable routing, lighting conditions, display calibration, and user acceptance testing — determines whether the dashboard becomes a daily operational tool or a decorative wall display. This eight-step checklist covers every stage from mounting to operator sign-off.
Frequently Asked Questions
What is the optimal font size for manufacturing dashboards on 55-inch TVs?
The optimal minimum font size for a 55-inch TV dashboard viewed from 15 feet is 24 pixels. This ensures that every character — including metric values, labels, status indicators, and axis labels on charts — is legible without requiring operators to walk closer to the screen. For primary metric values that need to be read from across the plant floor, use 36–48 px. Headings and section labels should be at least 28 px. These recommendations are based on the standard viewing distance calculation: for every 10 feet of viewing distance, minimum font size should be approximately 16 px, with adjustments upward for bright plant-floor lighting conditions that reduce perceived contrast and legibility.
How far should operators stand from a 55-inch dashboard TV?
The optimal viewing distance for a 55-inch TV dashboard on the plant floor is 12–18 feet, with 15 feet recommended as the standard. At this distance, a 55-inch display fills approximately 30 degrees of the viewer's horizontal field of view, which is the ergonomic sweet spot for reading data and scanning status indicators without excessive head or eye movement. The minimum acceptable distance is 8 feet (below this, operators must shift their gaze too much to see the full display), and the maximum is 22 feet (beyond this, text becomes too small to read comfortably). Always validate viewing distances with actual operators in your specific plant-floor layout, as lighting conditions, display brightness, and operator eyesight vary across facilities.
How often should TV dashboards refresh with new data?
TV dashboards on the plant floor should refresh data at intervals matching the operational cadence of the metrics displayed. Real-time production metrics like line speed, production count, and OEE should refresh every 10–15 seconds. Quality metrics like scrap rate and defect count should refresh every 15–30 seconds. Safety metrics and andon alerts should update in real time (sub-5-second refresh). Shift-level metrics like attainment and efficiency can refresh every 30–60 seconds. The most common mistake is setting refresh intervals too short (under 5 seconds), which causes the dashboard to flicker and distracts operators, or too long (over 60 seconds), which results in operators working with stale data. A 15–30 second default refresh interval balances timeliness with display stability for most plant-floor use cases.
What colour schemes work best for shop-floor TV displays?
The best colour scheme for shop-floor TV displays is a dark background (very dark navy #1a1a2e or pure black) with high-contrast metric values in white (#ffffff). Status indicators should follow the traffic-light convention: green (#2e7d32) for on-target metrics, amber-orange (#e65100) for approaching warning thresholds, and deep red (#c62828) for critical breaches. The brand colour (#605dba) should be reserved for decorative elements — headers, borders, icons, and section dividers — and never used for metric status coding since it carries no intuitive urgency signal. Avoid low-contrast combinations like grey text on dark backgrounds, pastel status colours, and thin or light fonts (below 400 weight) that disappear under bright plant-floor lighting. Always test colour choices on the actual display hardware under real lighting conditions before deployment.
How many metrics should a single TV dashboard screen show?
A single TV dashboard screen should show no more than six distinct data lines or metric groups. This limit is driven by the reality of the plant floor: operators scan a TV dashboard in three to five seconds while walking past or glancing up from their workstation. With more than six lines of information, the dashboard becomes a wall of data that operators cannot process at a glance, defeating the purpose of the large display. Each metric group should contain no more than three to four related data points. For example, a production dashboard showing OEE, production count, scrap rate, line status, and shift attainment (five metric groups) is within the limit. Adding energy usage, safety metrics, and andon alerts to the same screen (eight groups) exceeds it. When more metrics are needed, create dedicated screens rotated on a timed carousel or use separate TVs for different purposes.
Deploy iFactory on Your Plant Floor TVs in Under a Week
iFactory’s Auto-Scaling Dashboards Adapt to Any Screen Size — from Operator Tablets to 65-Inch Wall Displays.
iFactory’s platform automatically scales content to any screen size. The same dashboard that works on a 24-inch monitor reflows to fill a 55-inch TV without manual adjustment — font sizes scale proportionally, grids expand, and status indicators remain visible at full viewing distance. Deployment takes less than a week: mount the TV, install a streaming device, connect to iFactory, and select the TV-optimised template. Book a demo to see iFactory dashboards on 55-inch TVs in a live plant-floor simulation.


