A shop floor TV dashboard template is purpose-built for the unique demands of the manufacturing environment: it must be readable from across a production cell, understood in under three seconds, and updated in real time without any manual intervention. Unlike a desktop dashboard that a plant manager views in an office, the TV dashboard on the shop floor serves operators, technicians, and supervisors who are standing, moving, and making decisions in the moment — every element must be optimised for distance viewing, colour-coded status, and instant comprehension. This page breaks down the seven essential visual components of a production-grade TV dashboard template, the same format iFactory uses to power real-time displays on 55-inch screens across discrete and process manufacturing plants.
Get Started
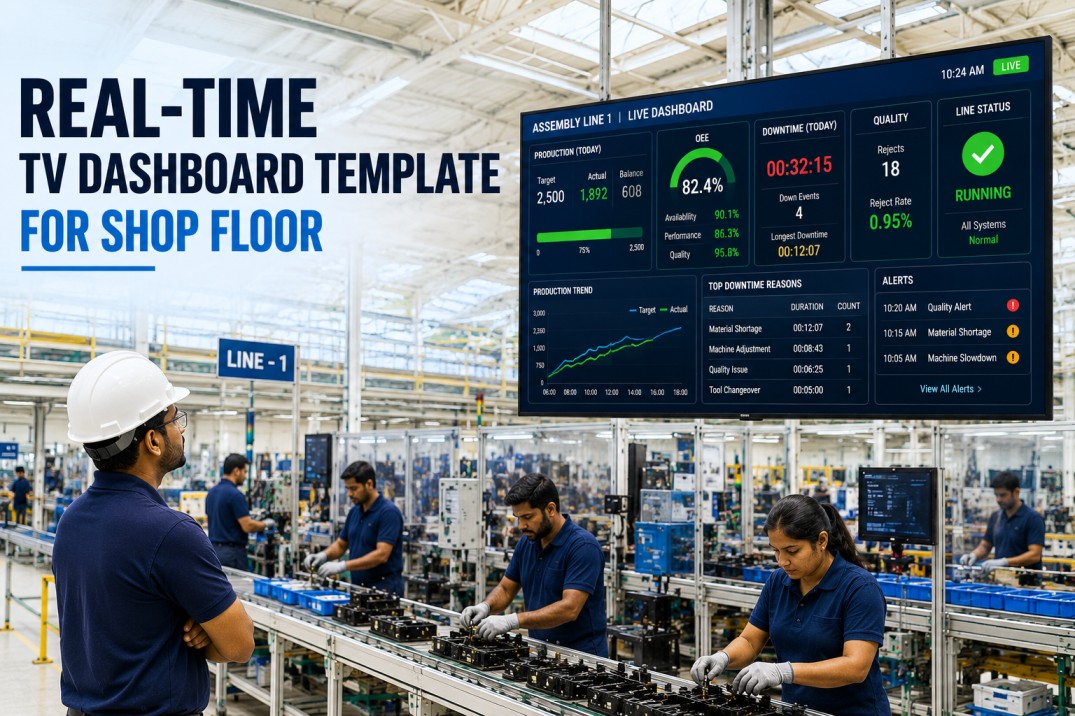
Deploy a Real-Time TV Dashboard on Your Shop Floor
iFactory's TV dashboard template is designed for 55"+ screens — extra-large fonts, traffic-light status, live andon alerts, and auto-rotating views that keep the entire cell informed without anyone touching a mouse or keyboard.
Plant Performance Header Bar
The header bar is the always-visible top section of any TV dashboard. It displays the plant name, current shift, date and time, and the single most important metric — OEE — in a font size that can be read from fifteen metres away. The header remains on screen while the content below rotates through different views, giving every passer-by immediate context about location, shift, and overall plant health.
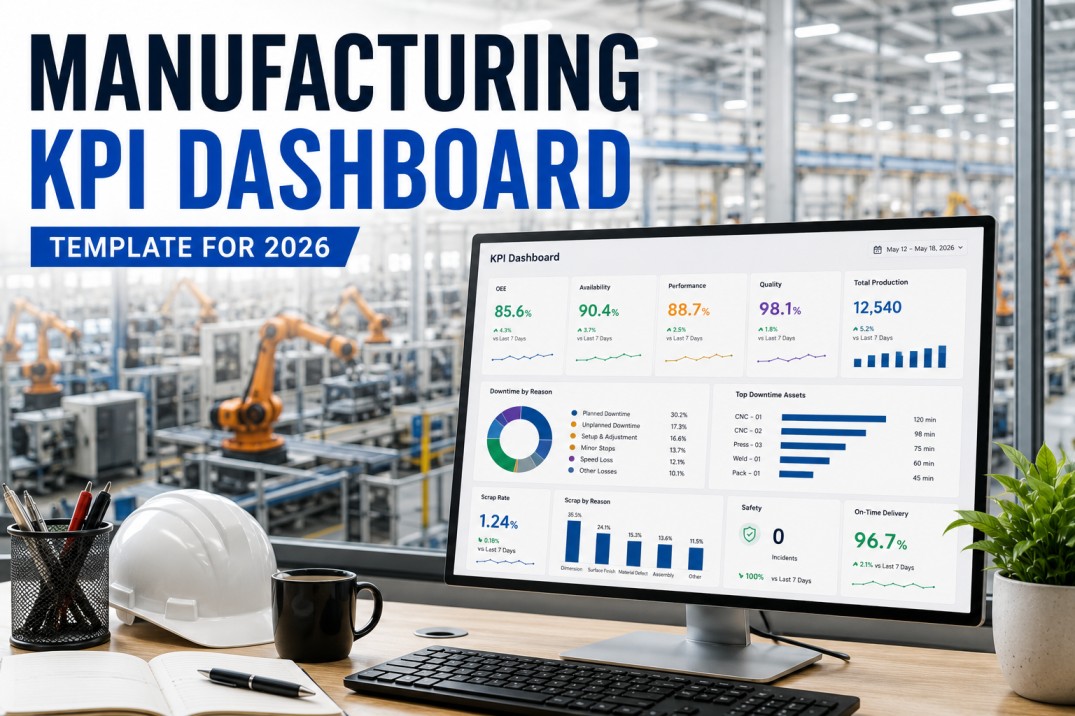
Production Line Status Tiles
The line status view is the primary content of any TV dashboard — it shows every production line in the plant as a large colour-coded tile that operators and supervisors can read from across the floor. Each tile displays the line name, a traffic-light status indicator (green for running, amber for slowdown, red for down), the current output count for the shift, and a progress bar against the shift target. The tiles auto-refresh every time a new production event is recorded in the MES.
Live Visibility
See Every Line Status at a Glance Across Your Shop Floor
iFactory's TV dashboard shows every production line in a single screen — colour-coded status tiles, live output counts, and shift target progress — so operators and supervisors never need to walk to a computer to check production status.
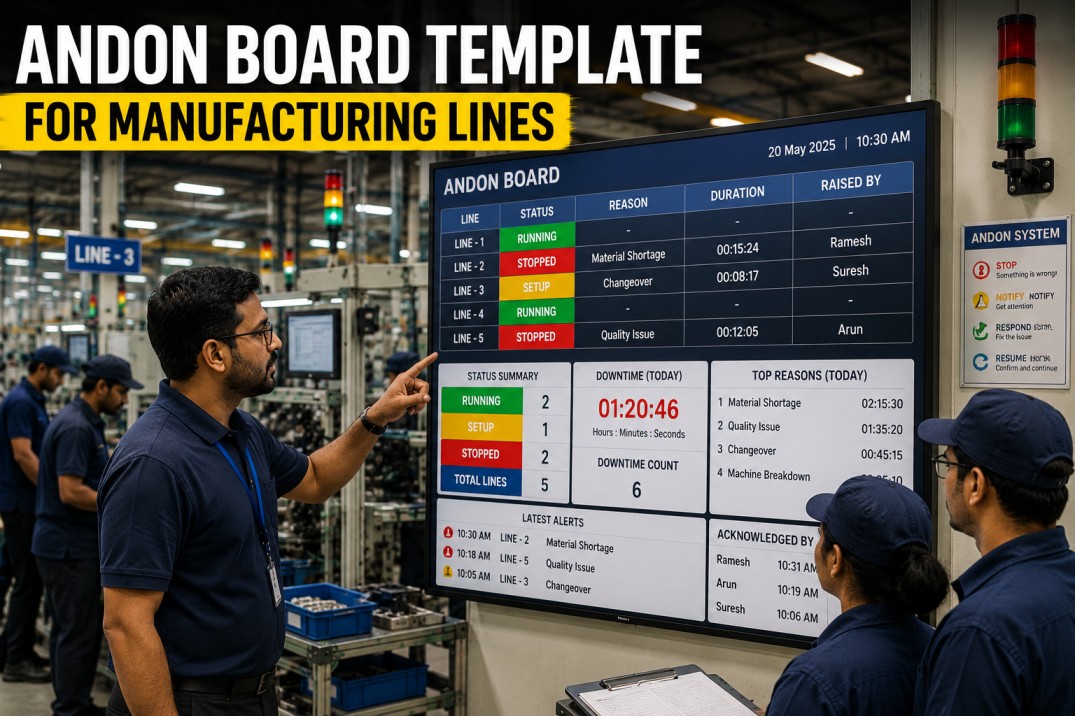
Active Andon Alert Ticker
The andon alert ticker is a dedicated horizontal band on the TV dashboard that displays every active call from the plant floor in a scrolling or stacked format. Each alert card shows the call type with a colour-coded badge, the originating line, the elapsed time since the call was pulled, and an escalating urgency indicator that changes colour as the response SLA is approached. The ticker ensures that no andon call goes unnoticed — even on a busy production floor — because the TV display physically highlights the alert in a section that never rotates away.
Dimension RAG Status Blocks
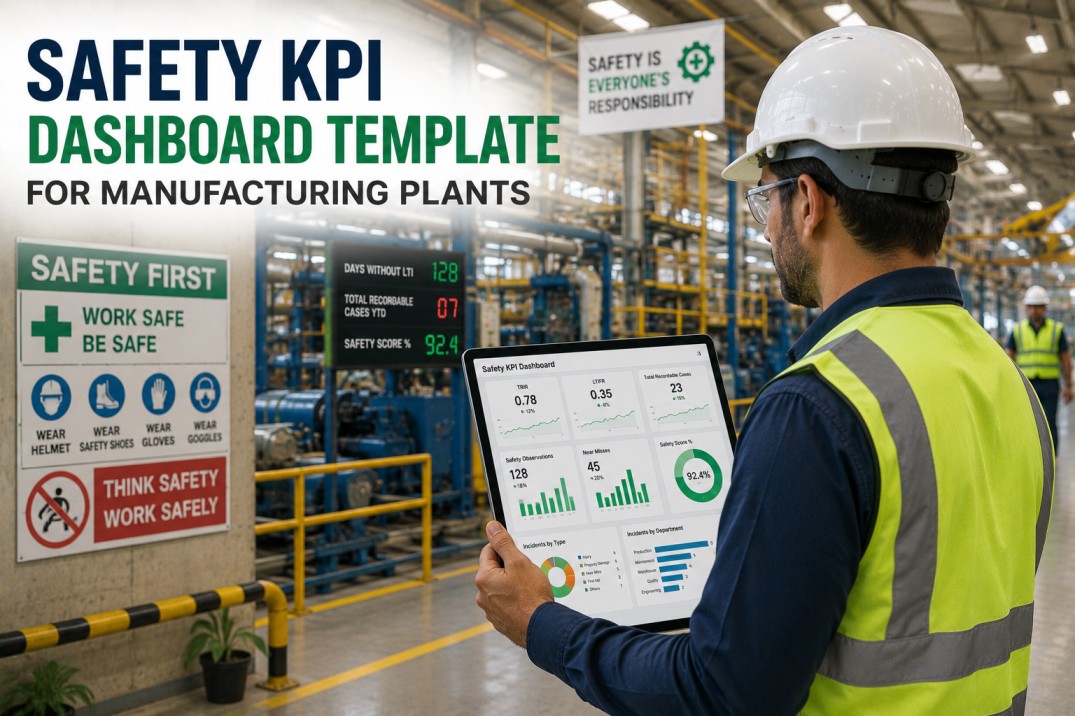
The RAG status blocks provide a five-second health check of the plant across the core SQDCP dimensions. Unlike a detailed table or chart, each dimension is represented as a large solid-colour block — green for on track, amber for at risk, red for off target — with only the dimension name and a single headline number. This extreme simplification is deliberate: the TV dashboard must convey the plant's overall health at a glance without requiring the viewer to read labels, compare values, or interpret legends.
Instant Health Check
Read Your Plant Health in Under Five Seconds
iFactory's RAG status blocks turn five complex metrics into five coloured blocks that everyone on the shop floor can read at a glance — no dashboard training required, no interpretation needed, just instant awareness of plant health.
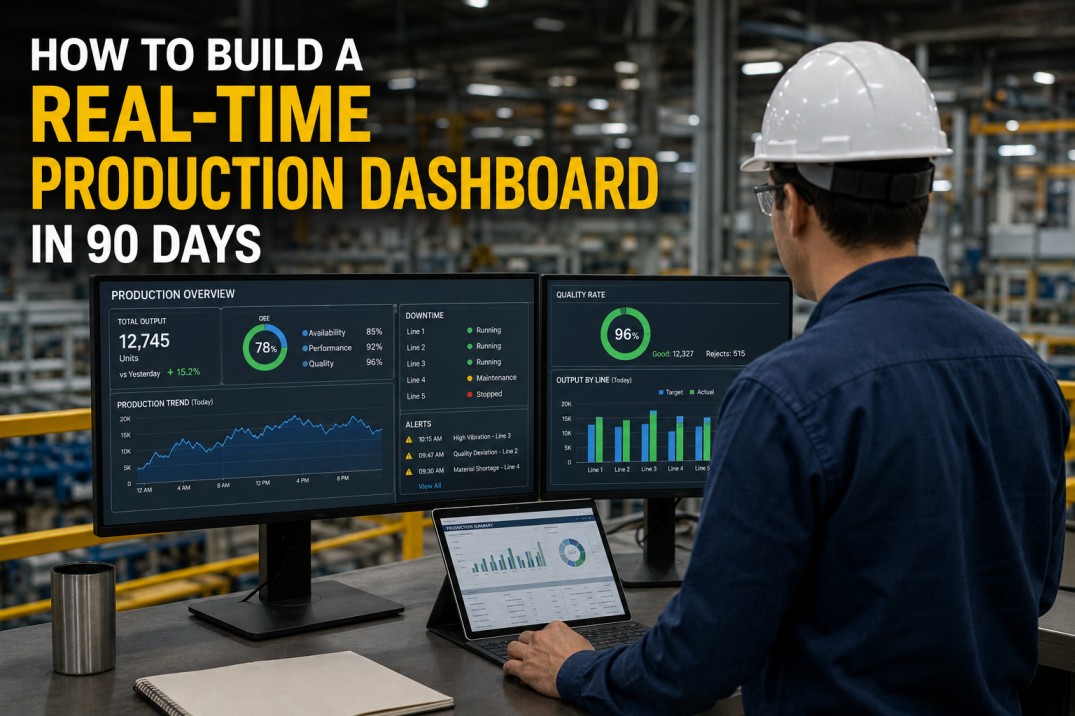
Big Metric TV Cards
Big metric cards are the workhorse of the TV dashboard — they display the most critical production numbers in a font size that fills the screen. Each card shows a single KPI with its label, a large value, a target comparison, and a colour-coded background that shifts from green to amber to red based on performance relative to target. The cards are designed for the primary content rotation on the TV: one card or a small group of cards fills the entire screen for a set dwell time before rotating to the next view.
Trend Direction Indicators
The trend direction indicators give the TV dashboard viewer immediate context about whether each KPI is improving or deteriorating compared to the previous period. Each indicator combines a large directional arrow — up for improvement, down for decline — with the current value and the delta from the prior period. The arrows are intentionally oversized because direction matters more than magnitude on a TV screen: the team needs to know at a glance whether things are getting better or worse.
Know the Direction
See at a Glance Whether Every Metric Is Improving or Declining
iFactory's trend indicators use oversized SVG arrows and colour-coded deltas to show direction immediately — so the shop floor team knows whether to celebrate, investigate, or escalate without reading a single number.
Shift Summary Banner
The shift summary banner is the bottom section of the TV dashboard that displays the shift-to-date production record. It shows the four most important operational statistics for the current shift: total units produced, total downtime minutes, current quality rate, and safety events. The banner stays visible regardless of which content view is shown above, giving every team member a constant reference for how the shift is performing against plan. At shift change, the banner freezes the final numbers and displays them as the handover summary for the incoming team.
Frequently Asked Questions
What is a shop floor TV dashboard?
A shop floor TV dashboard is a real-time data display designed for large screens mounted in production areas — typically 55 inches or larger — that shows current manufacturing performance metrics in formats optimised for distance viewing. Unlike desktop dashboards that require interaction, TV dashboards are read-only displays that auto-update and often auto-rotate through multiple views. They serve operators, technicians, supervisors, and support staff who need instant awareness of production status, quality, safety, and andon alerts without accessing a computer.
What size text should a shop floor TV dashboard use?
Text on a shop floor TV dashboard should be significantly larger than on a desktop dashboard. As a rule of thumb: headline numbers should be at least 80-120px on a 55-inch screen (visible from 15 metres), secondary values at 40-60px (visible from 8-10 metres), and labels at 24-36px (visible from 5 metres). The TV dashboard template on this page uses the same proportional sizing — the font sizes are scaled for the web representation but the relative sizing hierarchy matches what a production TV display would use. iFactory's TV dashboard templates automatically scale font sizes based on the screen resolution and viewing distance configured during setup.
How do TV dashboards differ from regular dashboards?
TV dashboards differ from regular dashboards in five key ways: font sizes are 2-3 times larger to support distance reading; colour is the primary encoding channel (traffic-light status dominates) because colour is visible faster than text; interaction is eliminated entirely — no clickable elements, hover states, or drill-down menus; content auto-rotates through multiple views on a timed cycle; and the layout is optimised for landscape 16:9 screens rather than vertical-scrolling web pages. A good TV dashboard should be comprehensible in under three seconds from a standing position ten metres away.
How often should a TV dashboard update?
A shop floor TV dashboard should update in real time — every time a production event is recorded, a quality check is completed, an andon call is triggered, or a safety observation is logged, the dashboard should reflect the change within seconds. For most manufacturing plants, a refresh interval of 5-10 seconds is sufficient to keep the display current without creating visual noise. Metrics like andon alerts and line status should update instantly via WebSocket or MQTT push, while aggregate numbers like shift totals or OEE can refresh on a timed interval. iFactory TV dashboards use push-based updates for alerts and line status and configurable polling for aggregate metrics.
How many views should a TV dashboard rotate through?
A shop floor TV dashboard should rotate through 3-6 views with a dwell time of 10-30 seconds per view. The most common rotation sequence is: line status overview (primary view, 30 seconds), big metric cards showing OEE and quality (15 seconds), andon alert ticker (always visible or in rotation), shift summary (15 seconds), and a plant-level SQDCP RAG view (15 seconds). The rotation ensures that viewers who stop to watch for 30-60 seconds see all critical information without the display becoming static and ignored. iFactory TV dashboards come with pre-configured rotation sequences that can be customised per plant.
Does iFactory support different screen sizes for TV dashboards?
Yes, iFactory's TV dashboard template automatically adapts to different screen sizes and resolutions. The template supports 43-inch to 86-inch screens at 1080p, 4K, and 5K resolutions. Font sizes, element spacing, and tile layouts scale proportionally based on the configured screen size and viewing distance. The template also supports multi-screen setups where different TV displays in the same plant show different views — for example, a main screen showing the line status overview while a secondary screen shows the andon alert ticker and shift summary. Each screen is configured independently through iFactory's display management console.
Get Your Template
Deploy a TV Dashboard That Your Entire Shop Floor Can Read
iFactory's real-time TV dashboard template is purpose-built for 55"+ screens — extra-large fonts, traffic-light RAG blocks, live andon ticker, and auto-rotating views that keep every operator, supervisor, and support team member informed without a single login. See it running on your data in a 30-minute demo.