A production planning vs actual template is the most essential tool in a plant manager's analytics stack. It answers the single question that every production review meeting starts with: did we make what we planned to make? Without a standardized plan vs actual template, each review devolves into data wrangling — pulling numbers from different sources, reconciling definitions, and debating whose figures are correct. This template eliminates that friction by establishing a single source of truth for production targets, actual output, mix, yield, and variance analysis — all in one place.
Stop Reconciling Production Numbers — Use the Template
Get the full production planning vs actual template with pre-built KPIs, variance calculations, and role-based dashboards. An iFactory analytics specialist will walk you through the template using your plant's actual production data in a 30-minute live demo.
Production Variance Scoreboard
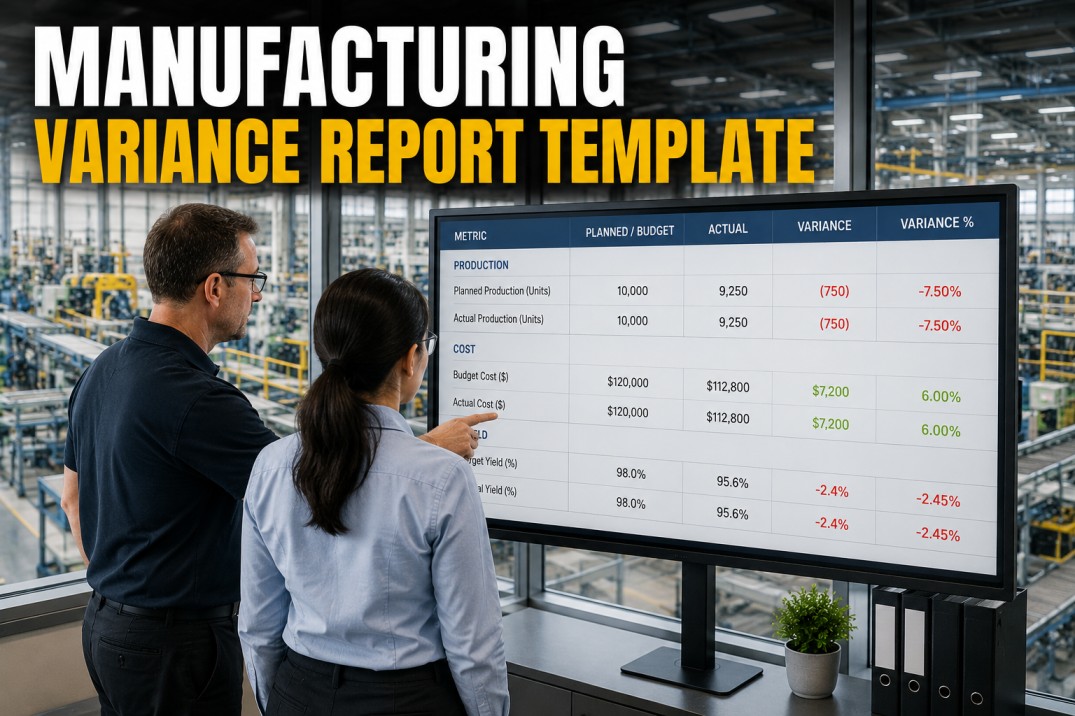
A quick-glance scoreboard is the top section of every plan vs actual template. It answers the four questions that leadership asks first: what did we plan, what did we produce, how big is the gap, and what percentage did we achieve. Each metric is calculated automatically from the underlying production data.
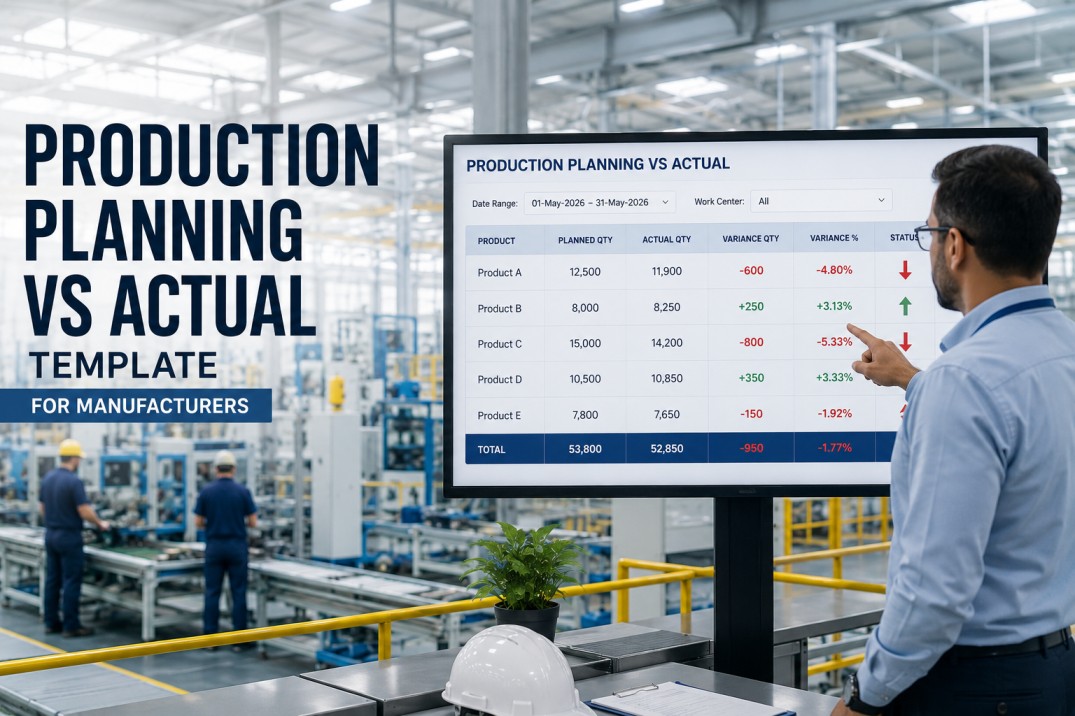
Plan vs Actual by Product Line
The template breaks variance down by product line so that plant managers can see which products are driving the gap. Each row shows the planned output, actual output, and the variance as both a bar chart and a percentage. Products below 90% achievement are flagged for root cause analysis.
Variance Breakdown — Volume, Mix & Yield
The production variance waterfall is the most insightful page of the template. It decomposes the total gap between plan and actual into three components: volume effect (how many units we made vs planned), mix effect (whether we made the right products), and yield effect (how much material we consumed). This decomposition tells plant management exactly where to focus improvement efforts.
What the Production Plan vs Actual Template Includes
The template is not a single spreadsheet — it is a complete reporting framework that connects to your production data sources and delivers role-based views for every stakeholder. Below are the six core components that ship with every iFactory production planning vs actual template deployment.
Pre-defined production KPIs with standardized formulas: plan attainment, volume variance, mix variance, yield variance, schedule adherence, and production efficiency. All formulas are transparent and auditable.
CorePre-built connectors for ERP (SAP, Oracle, Dynamics), MES, and CMMS systems. The template pulls production plans from the scheduling system and actuals from the shop floor in real time — no manual exports.
ConnectorAutomated variance calculation engine that decomposes the plan vs actual gap into volume, mix, and yield components. The engine highlights the top three contributors to variance each period.
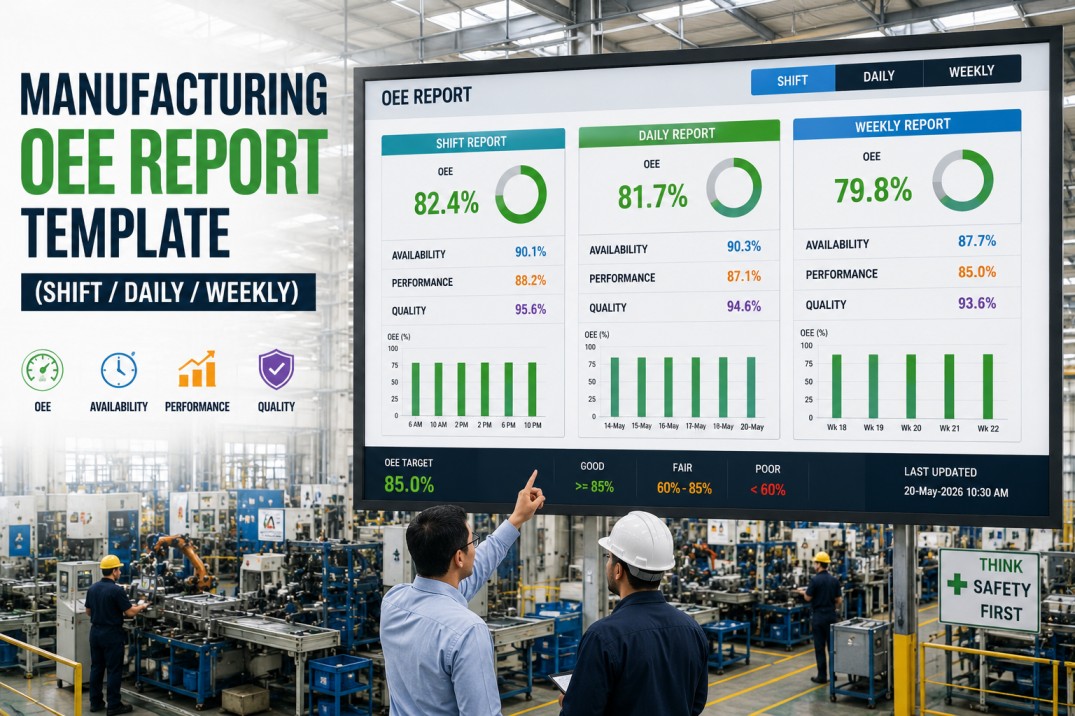
AnalyticsThree dashboard layers: Operator view (shift-level plan vs actual), Supervisor view (daily by line), and Plant Manager view (weekly/monthly across all lines with drill-down).
UXRolling 13-week trend charts for plan attainment and variance. Cross-line benchmarking shows which production lines consistently hit plan and which need process improvement support.
ReportingOne-click export to PDF, Excel, and PowerPoint. Automated email distribution schedules so that every stakeholder receives their plan vs actual report at the right cadence without manual effort.
WorkflowGet the Complete Template
Production Plan vs Actual — Pre-Built and Ready to Connect
Includes live data connectors, automated variance calculations, role-based dashboards, and export workflows. A 30-minute demo with an iFactory analytics specialist will have the template running against your production data before the call ends.
Production Schedule vs Actual — Line-Level Table
The detailed schedule table shows every production order, its planned and actual quantities, and the variance at the line level. Color-coded cells make it immediately obvious which orders are on track (green), slightly behind (amber), or significantly off plan (red). Plant supervisors use this table to prioritize their daily stand-up discussions.
| Order | Product | Line | Shift | Plan Qty | Actual Qty | Variance | Achievement |
|---|---|---|---|---|---|---|---|
| PO-2401 | Product A | Line 1 | Day | 2,500 | 2,480 | −20 | 99.2% |
| PO-2402 | Product A | Line 1 | Night | 2,500 | 2,150 | −350 | 86.0% |
| PO-2403 | Product B | Line 2 | Day | 3,000 | 2,950 | −50 | 98.3% |
| PO-2404 | Product B | Line 2 | Night | 3,000 | 2,100 | −900 | 70.0% |
| PO-2405 | Product C | Line 4 | Day | 4,250 | 4,100 | −150 | 96.5% |
| PO-2406 | Product C | Line 4 | Night | 4,250 | 3,000 | −1,250 | 70.6% |
| PO-2407 | Product D | Line 3 | Day | 2,500 | 2,480 | −20 | 99.2% |
| PO-2408 | Product D | Line 3 | Night | 2,500 | 2,350 | −150 | 94.0% |
| PO-2409 | Product E | Line 5 | Day | 1,500 | 1,420 | −80 | 94.7% |
| PO-2410 | Product E | Line 5 | Night | 1,500 | 1,180 | −320 | 78.7% |
How the Template Connects to Your Production Data
The plan vs actual template is not a manual spreadsheet — it is a connected analytics layer that pulls production plans from your scheduling system and actual output from shop floor data sources. The data pipeline below shows how production data flows from source systems into the template and ultimately to stakeholder dashboards.
Common Root Causes of Plan vs Actual Variance
When the template flags a significant variance, the next step is root cause identification. The chart below shows the most common root causes across manufacturing plants that use the plan vs actual template. Understanding these patterns helps plant management apply targeted corrective actions rather than generic interventions.
Raw material or component supply disruptions cause the most frequent plan misses. Supplier lead time variability, inventory inaccuracy, and logistics delays are the primary drivers.
Unplanned equipment failures and extended changeovers directly reduce actual output versus plan. Preventive maintenance gaps and aging assets are the most common contributors.
Unscheduled absenteeism, unfilled positions, and skill gaps reduce effective capacity. Plants with high overtime rates tend to see more plan vs actual variance on night shifts.
First-pass yield issues force production to run additional units beyond the plan to meet customer demand. Process variability and inadequate changeover validation are key contributors.
Utility interruptions, engineering trials, quality holds, and customer-driven schedule changes account for the remaining variance. These are typically one-off events rather than systemic issues.
Frequently Asked Questions About the Production Plan vs Actual Template
What data sources does the plan vs actual template connect to?
The template connects directly to your ERP system (SAP, Oracle, Dynamics, or any ODBC-compliant system) for production plans, and to your MES or shop floor data collection system for actual production output. It also connects to CMMS for downtime data and quality systems for yield and scrap data. iFactory's pre-built connectors handle the integration in hours — not weeks.
Is this a spreadsheet template or a software dashboard?
It is a live, connected dashboard — not a static spreadsheet. The template lives inside the iFactory analytics platform and updates automatically as new production data flows in. It includes the same structured layout as a spreadsheet template (scoreboard, product breakdown, waterfall, schedule table) but with live data, automated calculations, and role-based access. You can export any view to Excel or PDF for offline review.
How long does it take to deploy the template?
A basic deployment with two data source connections (ERP for plans + MES for actuals) typically takes 3–5 business days. This includes connector configuration, KPI calculation validation, and user access setup. A full deployment with all views, role-based dashboards, and automated distribution is typically 10–15 business days. The timeline depends primarily on data source accessibility and the number of product lines being tracked.
Can the template handle multiple plants and production lines?
Yes. The template is designed for multi-plant, multi-line deployments from day one. Each plant sees its own plan vs actual data, and corporate users can view a consolidated rollup across all sites. The template supports unlimited production lines, products, and shifts. Plant-level and line-level filters allow users to focus on specific areas without losing the enterprise-wide view.
Does the template calculate variance automatically?
Yes. The variance engine calculates total variance, volume variance, mix variance, and yield variance automatically every time new production data is loaded. It also highlights the top three contributors to variance and flags any production order where actual output falls below 90% of the plan. All calculations are transparent — you can inspect the formula behind every KPI to ensure it matches your corporate definition.
Can we customize the template for our specific production process?
Absolutely. The template is a starting point that is fully customizable to your production environment. You can add product-specific KPIs, modify the variance decomposition logic to match your cost accounting method, create custom views for different roles, and build alert thresholds that reflect your operational targets. The iFactory platform includes a drag-and-drop report builder for ongoing customization without requiring developer support.
Ready to see the template in action.
Get the Production Plan vs Actual Template — Live on Your Data
A 30-minute demo with an iFactory manufacturing analytics specialist. We'll connect the template to your ERP and MES data, show you live plan vs actual dashboards with variance breakdowns, and deliver a customized deployment roadmap for your plant.