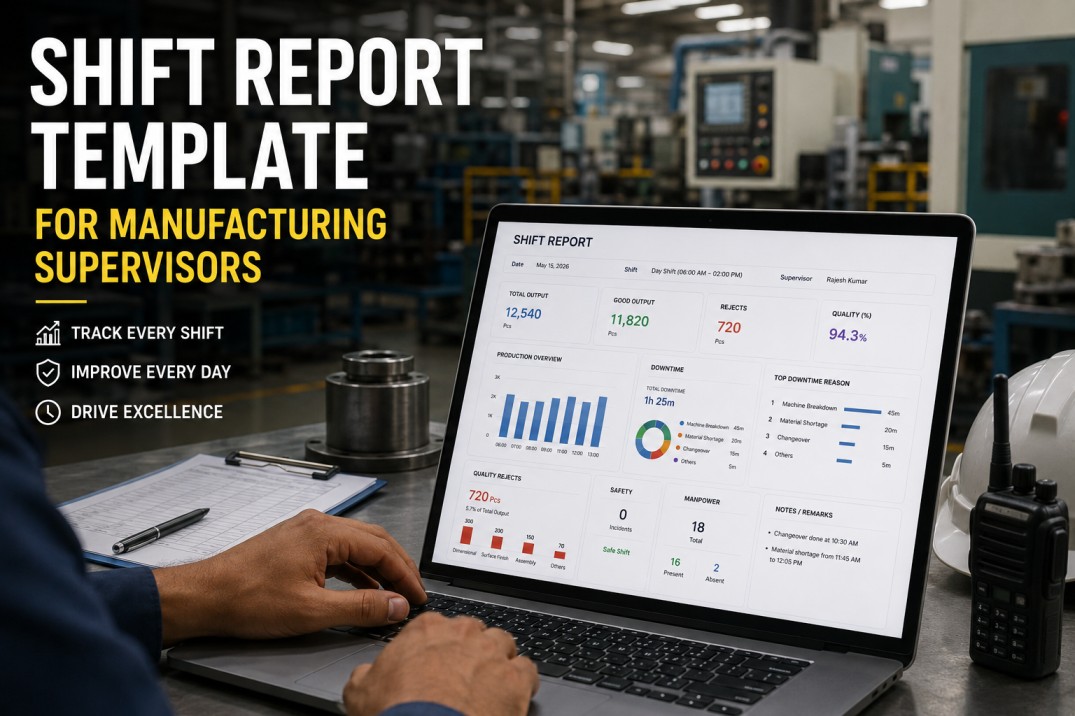
A shift performance report checklist helps manufacturing supervisors capture every critical metric at shift end — production output, OEE, scrap rates, quality incidents, and safety events. Without a standardised shift report, handovers are inconsistent, issues fall through the cracks, and plant leadership lacks the data needed for continuous improvement. This checklist covers seven essential dimensions of shift reporting, from production attainment to handover actions, so you can close every shift with complete visibility and accountability.
Shift Performance Summary at a Glance
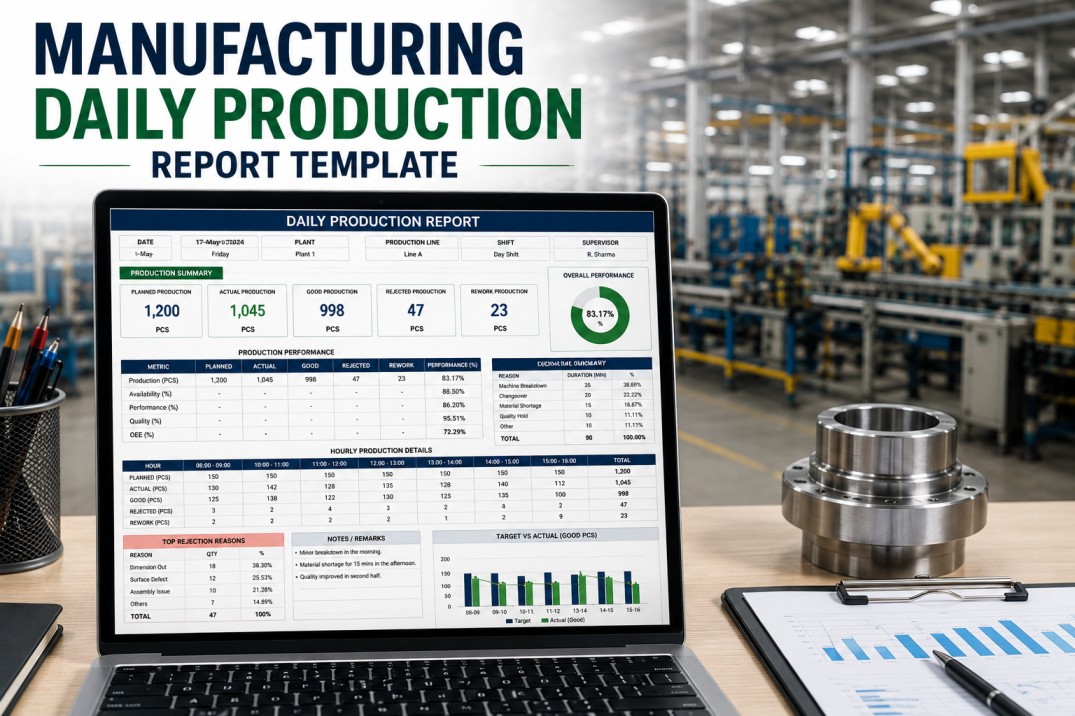
Record shift-level summary information at a glance. The banner below captures key identifiers and high-level performance metrics for the current shift.
Automate Shift Reports
Generate Shift Reports Automatically the Moment a Shift Ends
iFactory auto-generates complete shift reports from production data — output, OEE, scrap, downtime, and handover notes. No more manual spreadsheets or forgotten entries.
Production Output vs Target: Shift Attainment Analysis
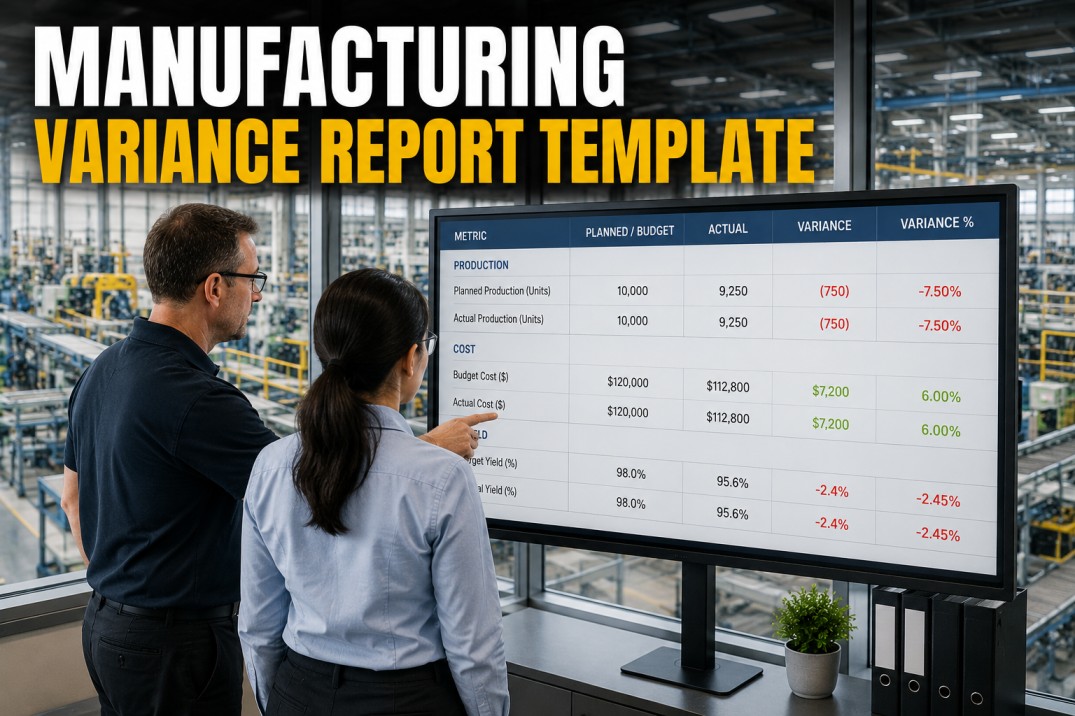
Compare actual production output against the shift schedule for each product line. The variance column highlights overproduction and shortfall for immediate corrective action.
| Product / Line | Actual | Target | Variance | Attainment | Progress |
|---|---|---|---|---|---|
| Engine Block A | 420 | 450 | -30 | 93.3% | |
| Engine Block B | 385 | 400 | -15 | 96.3% | |
| Transmission C | 210 | 200 | +10 | 105.0% | |
| Axle Assembly | 315 | 320 | -5 | 98.4% | |
| Final Assembly | 517 | 500 | +17 | 103.4% | |
| Total Plant | 1,847 | 1,870 | -23 | 98.8% |
OEE Component Breakdown: Availability, Performance, Quality
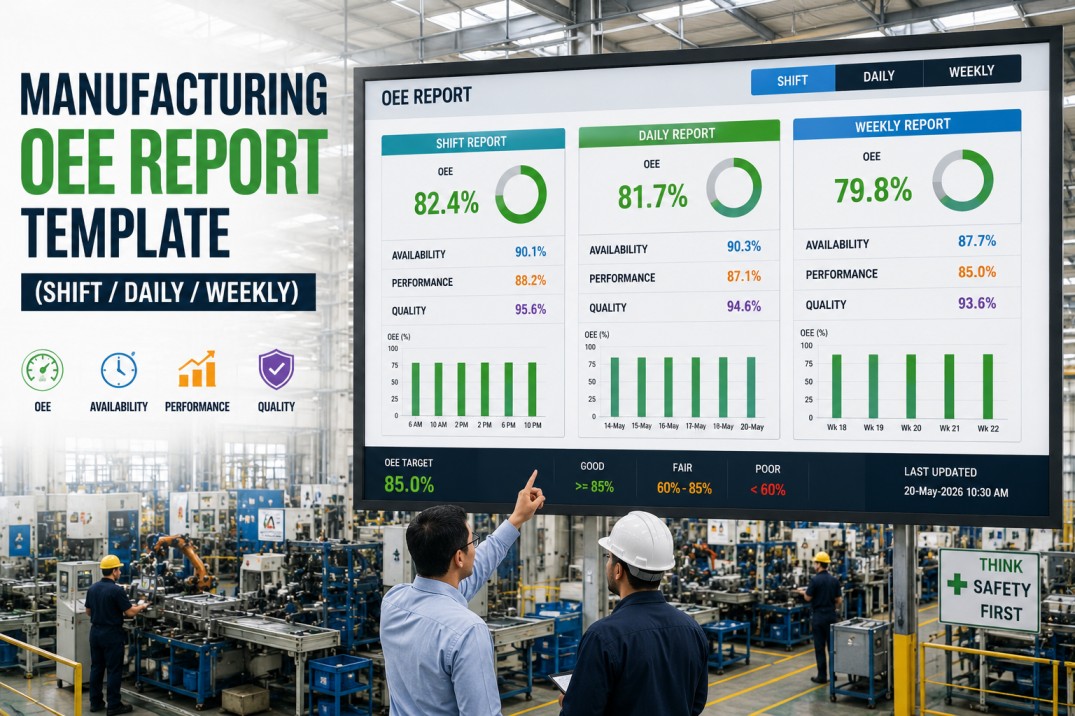
OEE breaks down into its three core components — Availability, Performance, and Quality. Tracking each component separately reveals where the biggest losses occur and guides targeted improvement initiatives.
| Component | Current | Target | Gap | Status | Trend |
|---|---|---|---|---|---|
| Availability | 89.5% | 92.0% | 2.5% | Below Target | |
| Performance | 91.2% | 95.0% | 3.8% | Below Target | |
| Quality | 96.1% | 97.0% | 0.9% | Below Target | |
| Overall OEE | 78.4% | 85.0% | 6.6% | Needs Review |
Track OEE Per Shift
Get Real-Time OEE Tracking Across Every Shift and Line
iFactory calculates OEE automatically from machine data, capturing every downtime event, cycle time variance, and quality loss. See which shifts perform best and why.
Shift Scrap and Defect Breakdown by Category
Scrap and defect data from the shift is categorised by type, showing frequency, cumulative share, and impact level. The top defect types account for nearly 70% of total scrap.
| Defect Type | Quantity | Share | Cumulative | Impact |
|---|---|---|---|---|
| Surface scratches | 38 | 28.6% | High | |
| Dimensional variance | 24 | 46.6% | High | |
| Material flaw | 16 | 58.6% | Medium | |
| Weld defect | 14 | 69.2% | Medium | |
| Contamination | 11 | 77.4% | Medium | |
| Assembly error | 10 | 85.0% | Medium | |
| Packaging damage | 7 | 90.2% | Low | |
| Labeling error | 5 | 94.0% | Low | |
| Total | 125 | 100% |
Shift Events Timeline: Downtime, Audits, and Changeovers
A chronological log of key events during the shift helps supervisors identify patterns in downtime, quality issues, and operational delays. Each event is timestamped with duration and notes for handover clarity.
| Time | Event | Duration | Notes |
|---|---|---|---|
| 06:00 | Shift start & team briefing | 15 min | |
| 06:15 | Production ramp-up — all lines | 30 min | |
| 06:45 | First-piece inspections complete | 10 min | |
| 08:30 | Line A downtime — tool change | 22 min | Tooling replacement |
| 09:15 | Mid-shift quality audit | 20 min | 1 non-conformance found |
| 10:00 | Planned break / line changeover | 30 min | Model B changeover |
| 10:45 | Post-break ramp-up | 15 min | |
| 12:00 | Line C slowdown — material delay | 18 min | Material shortage |
| 13:30 | End-of-shift cleanup & count | 20 min | |
| 14:00 | Shift handover & report submission | 15 min |
Eliminate Data Gaps
Never Lose Shift Data Again with Digital Handover Logs
iFactory's digital shift log captures every handover item in real time, with photo attachments, timestamped notes, and automatic notification to the incoming shift supervisor.
Labour & Resource Utilisation Across Stations
Labour utilisation tracks how effectively each station converted available operator hours into production output. Efficiency per operator hour and utilisation percentage help identify staffing imbalances and training needs.
| Station | Operator | Hours | Output | Efficiency | Utilisation | Trend |
|---|---|---|---|---|---|---|
| Station 1 — Machining | R. Chen | 8.0 | 420 | 52.5 | 100% | |
| Station 2 — Welding | L. Park | 8.0 | 385 | 48.1 | 96% | |
| Station 3 — Painting | M. Singh | 8.0 | 310 | 38.8 | 88% | |
| Station 4 — Assembly | A. Costa | 7.5 | 370 | 49.3 | 93% | |
| Station 5 — QC | J. Brown | 8.0 | 290 | 36.3 | 100% | |
| Station 6 — Packing | T. Wu | 7.0 | 350 | 50.0 | 85% |
Shift Handover Checklist: Close Every Shift Completely
The shift handover checklist ensures that every critical task is completed before the next shift takes over. Each item includes the responsible role and completion status for full accountability.
| # | Handover Item | Owner | Status |
|---|---|---|---|
| 1 | Confirm production count and log | Production Supervisor | Done |
| 2 | Report OEE and component breakdown | Production Supervisor | Done |
| 3 | Record scrap quantity by category | Quality Technician | Done |
| 4 | Document downtime events and reasons | Maintenance Lead | Done |
| 5 | Log safety incidents or near-misses | Safety Officer | Done |
| 6 | Note open quality non-conformances | Quality Engineer | Done |
| 7 | Submit shift summary in iFactory | Production Supervisor | Done |
| 8 | Communicate priority items to next shift | Shift Lead | Done |
Frequently Asked Questions
What should be included in a shift performance report?
A comprehensive shift report should include production output vs target, OEE and its component breakdown, scrap and defect data, downtime events with duration and root cause, safety incidents, labour utilisation, and a handover summary for the next shift. The report should be generated automatically from production data whenever possible.
How do supervisors benefit from standardised shift reports?
Standardised shift reports ensure consistent data collection across all shifts, eliminate information loss during handovers, and provide plant leadership with comparable shift-level data for trend analysis. Supervisors spend less time on manual data entry and more time on floor management.
What is the best way to track OEE per shift?
OEE should be calculated automatically from production system data — availability from planned vs actual runtime, performance from cycle time vs ideal cycle time, and quality from good vs total units produced. Manual OEE tracking is error-prone and rarely captures accurate downtime data.
How should shift handover be structured?
A structured handover should cover: production count and attainment, quality issues and non-conformances, equipment status and pending maintenance, safety events, material availability, and priority items for the incoming shift. Digital handover logs in a manufacturing analytics platform provide a searchable audit trail.
What metrics define an effective shift report?
The five essential metrics are: production output vs target (attainment %), OEE (and its three components), first-pass yield or scrap rate, downtime (total minutes and OEE impact), and safety (lost-time incidents and near-misses). Additional metrics can include changeover time, labour efficiency, and energy usage.
How often should shift reports be reviewed by management?
Shift reports should be reviewed daily by the production manager during a brief stand-up meeting with shift supervisors. Weekly reviews aggregate shift data into trend reports, and monthly reviews feed into plant-wide operational reviews and strategic improvement planning.
Close Every Shift with Confidence
Get Full Shift Visibility with iFactory's Manufacturing Analytics
iFactory gives every shift supervisor a complete, auto-generated shift report the moment the shift ends. Output, OEE, scrap, events, handover — all in one place. Book a demo to see it in action.