A maintenance KPI report template is the foundation of every world-class reliability program. Without a standardized template that tracks MTBF, MTTR, PM compliance, and backlog in one place, maintenance leaders spend more time gathering data than analyzing it — pulling work orders from the CMMS, calculating metrics by hand in spreadsheets, and presenting numbers that nobody trusts because the methodology changes every month. This template eliminates that cycle by defining each KPI with a single formula, connecting directly to your CMMS data, and delivering a consistent maintenance scorecard that plant leadership can rely on for decision-making.
Your Maintenance KPIs Should Not Live in a Spreadsheet
Get the complete maintenance KPI report template with pre-built MTBF, MTTR, PM compliance, and backlog dashboards. An iFactory analytics specialist will connect the template to your CMMS and show you live maintenance scorecards in a 30-minute demo.
Maintenance KPI Gauge — MTBF, MTTR, PM Compliance & Backlog
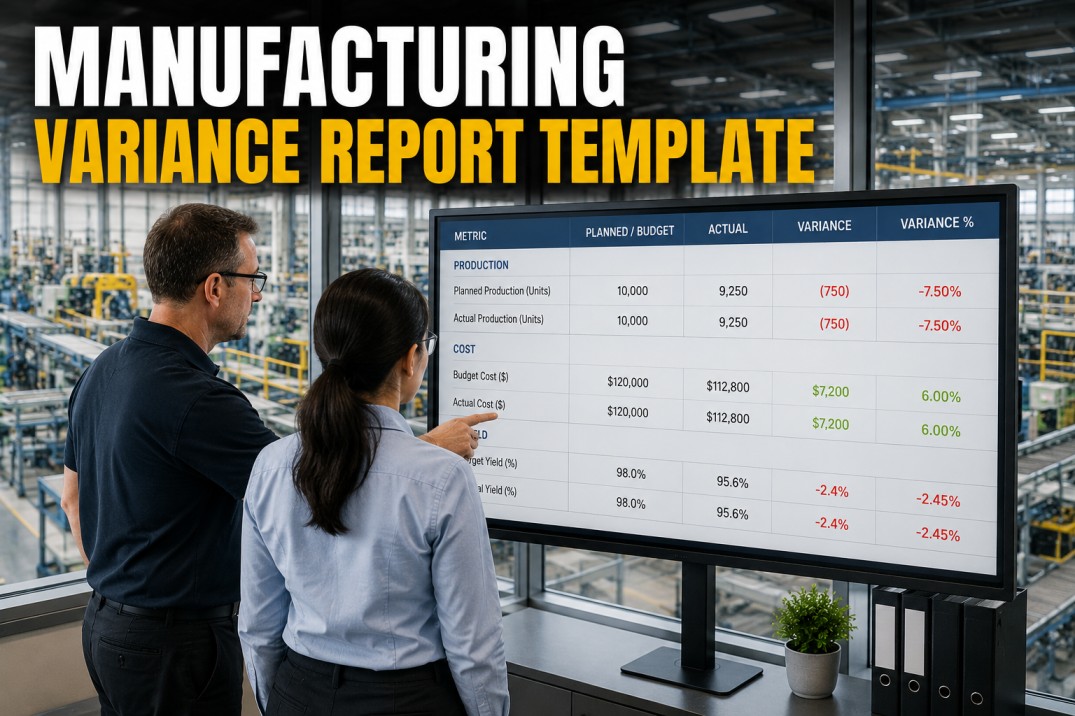
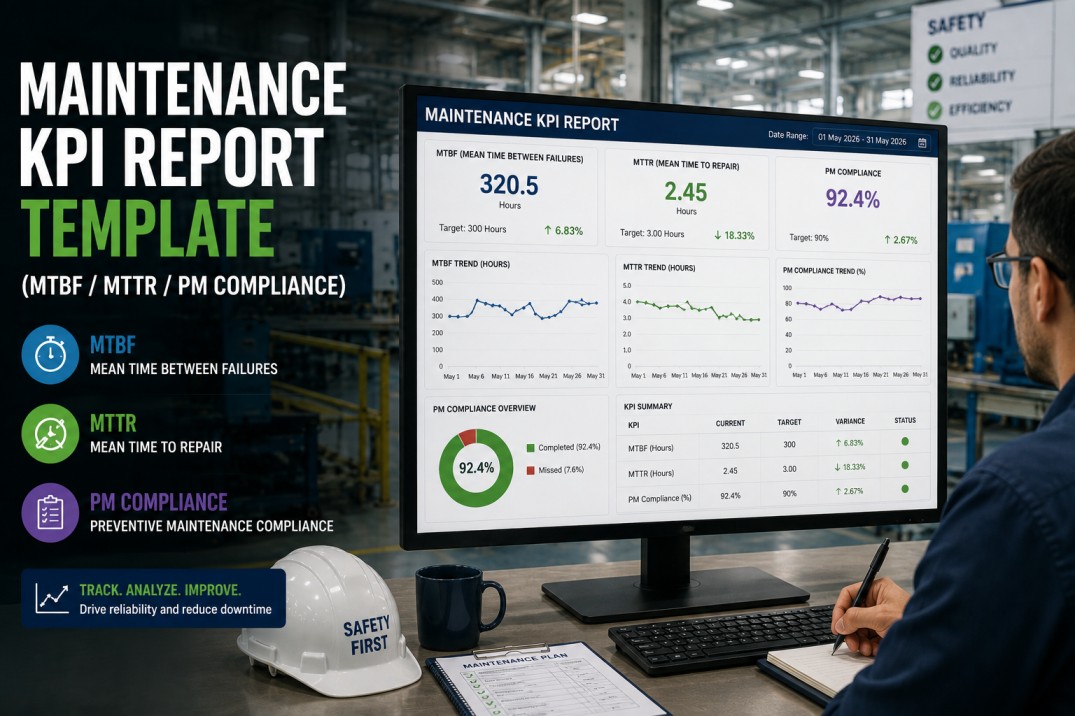
The template's KPI gauge section provides an at-a-glance health check for the four most important maintenance metrics. Each gauge shows the current value against the plant's target, color-coded for immediate status recognition. The values shown below are representative benchmarks for a high-performing manufacturing plant.
MTBF & MTTR by Asset — Reliability Grid
The template breaks maintenance KPIs down to the individual asset level so that reliability engineers can identify which machines are dragging down the plant's average MTBF and MTTR. Each row shows the asset, its failure frequency, the average time between failures, and the average repair time — with a reliability rating that flags underperforming assets.
PM Compliance Calendar — Weekly Completion Grid
The PM compliance calendar within the template shows preventive maintenance completion status at a glance. Each cell represents a week, and the colored dots show how many of the scheduled PMs were completed on time. Plant maintenance supervisors use this view during weekly stand-up meetings to identify overdue tasks before they become equipment failures.
Maintenance KPI Formula Reference
Every KPI in the template uses a transparent, auditable formula. Maintenance leaders can inspect the exact calculation behind each metric to ensure it matches their corporate definition. The formula reference is built into the template and updates automatically as new CMMS data arrives.
Measures the average time between equipment failures. Higher is better. The template calculates MTBF per asset, per asset class, and for the plant overall. Operating time excludes scheduled downtime.
Measures the average time to restore an asset to operation after a failure. Lower is better. The template tracks MTTR by asset, failure type, and technician team to identify improvement opportunities.
Tracks the percentage of preventive maintenance tasks completed within their scheduled window. The template flags any PM completed more than 7 days past its due date as non-compliant.
Measures the total estimated hours of open maintenance work divided by the weekly available technician capacity. A backlog of 2-4 weeks is healthy. Above 6 weeks indicates systemic under-capacity.
Measures the percentage of planned production time lost to equipment downtime. This KPI bridges maintenance and production by quantifying the business impact of every failure event.
Estimates the cost avoided by preventing equipment failures through effective PM and PdM programs. The template calculates this as the difference between expected and actual downtime costs.
Maintenance KPIs — Automated from CMMS Data
iFactory Calculates MTBF, MTTR & PM Compliance Automatically
Pre-built maintenance KPI template with live CMMS connectors, automated formula calculations, asset-level reliability tracking, and role-based dashboards for maintenance technicians, supervisors, and plant managers. A 30-minute demo connects the template to your CMMS and shows live scorecards.
Maintenance Backlog Aging — Work Order Breakdown
The backlog aging view in the template categorizes open work orders by the time elapsed since they were created. This helps maintenance leaders understand not just how much work is pending, but how old that work is — a critical distinction because aging backlog increases the risk of equipment failure and emergency breakdowns.
What the Maintenance KPI Template Includes
The maintenance KPI report template ships with a complete set of pre-built components that connect to your CMMS and start delivering value from day one. Each component is designed to reduce the time maintenance teams spend on reporting and increase the time available for reliability improvement.
Pre-built connector for SAP PM, Oracle EAM, Maintenance Connection, Fiix, UpKeep, and any ODBC-compliant CMMS. Pulls work orders, PM schedules, labor hours, and cost data automatically.
Four-quadrant scorecard showing MTBF, MTTR, PM compliance, and backlog health with color-coded status indicators. All KPIs calculated automatically from CMMS data with transparent formulas.
Rolling 13-month trend charts for all four core KPIs. Month-over-month and year-over-year comparison with automatic target lines and anomaly highlighting.
Click from plant-level KPIs down to individual asset performance. Each asset has its own MTBF/MTTR profile, failure history, and PM compliance record.
Weekly PM completion grid showing which tasks were completed on time, overdue, or upcoming. Color-coded dots enable instant visual assessment of PM compliance trends.
One-click export to PDF, Excel, and PowerPoint. Scheduled email distribution for weekly maintenance reports with automatic attachment generation.
Top Failure Modes — Frequency & Impact
The failure mode analysis view in the template ranks the most common failure types across all assets. Maintenance teams use this view to prioritize root cause analysis and target their improvement efforts on the failure modes that cause the most downtime events.
Frequently Asked Questions About the Maintenance KPI Report Template
Which CMMS systems does the template connect to?
The template includes pre-built connectors for SAP PM, Oracle EAM, IBM Maximo, Maintenance Connection, Fiix, UpKeep, eMaint, and any CMMS that supports ODBC or REST API access. If your CMMS is not on this list, the iFactory data engineering team can build a custom connector — typically within 2-3 business days. The template pulls work order data, PM schedules, labor hours, and cost information directly from your CMMS without requiring manual exports.
How are MTBF and MTTR calculated in the template?
MTBF is calculated as total operating time divided by the number of failures in the period. Operating time excludes scheduled downtime (PM, holidays, planned shutdowns). MTTR is calculated as total repair labor hours divided by the number of repairs. Both calculations use a rolling 12-month window by default, but the template supports custom date ranges. The exact formula for each KPI is visible in the template's formula reference section and is fully auditable.
Can the template generate weekly maintenance reports automatically?
Yes. The template includes an automated report distribution engine that can generate and email weekly maintenance KPI reports to any distribution list. Each recipient receives a PDF or Excel file with their role-based view. The plant manager gets the full scorecard with trend charts, the maintenance supervisor gets the PM compliance and backlog views, and the reliability engineer gets the asset-level MTBF/MTTR detail. Reports can be scheduled for any day and time.
How does the template handle multiple plants or sites?
The template supports multi-site deployments with independent CMMS instances per plant. Each plant sees its own maintenance KPIs, while corporate users can view a consolidated scorecard across all sites. The template applies the same KPI definitions across all plants automatically, ensuring that MTBF and MTTR are calculated identically regardless of which CMMS each plant uses. Cross-plant benchmarking is enabled out of the box.
What is a healthy maintenance backlog size?
Industry best practice targets a maintenance backlog of 2-4 weeks of estimated work hours. Below 2 weeks suggests the team may be overstaffed or not scheduling enough proactive maintenance. Above 6 weeks indicates systemic under-capacity that will eventually lead to increased equipment failures and emergency repairs. The template tracks backlog in weeks and alerts when the backlog exceeds the threshold you define, enabling proactive resource planning.
Is the template customizable for our specific KPI definitions?
Yes. While the template ships with industry-standard KPI definitions, every formula can be modified to match your corporate standards. You can change the MTBF calculation window, adjust PM compliance thresholds, redefine backlog categories, and add plant-specific KPIs. The template includes a formula editor that allows maintenance leaders to modify calculations without developer support. All changes are version-controlled and auditable.
Your maintenance scorecard is ready to deploy.
Get the Maintenance KPI Template — Live on Your CMMS Data
A 30-minute demo with an iFactory manufacturing analytics specialist. We'll connect the template to your CMMS, show you live MTBF/MTTR scorecards, PM compliance dashboards, and backlog reports, and deliver a customized deployment roadmap for your plant.