Manufacturing Execution Systems (MES) and manufacturing analytics platforms are often confused — and sometimes conflated — by plant teams evaluating their technology stack. Both systems operate on the plant floor, both handle production data, and both provide dashboards. But they serve fundamentally different purposes: MES is a system of execution, designed to track and control production in real time. Analytics is a system of insight, designed to aggregate, model, and visualise data from multiple sources for decision support. This page breaks down the difference between MES and manufacturing analytics, when each wins, where they overlap, and how platforms like iFactory bridge them for a unified view of plant performance.
Get Started
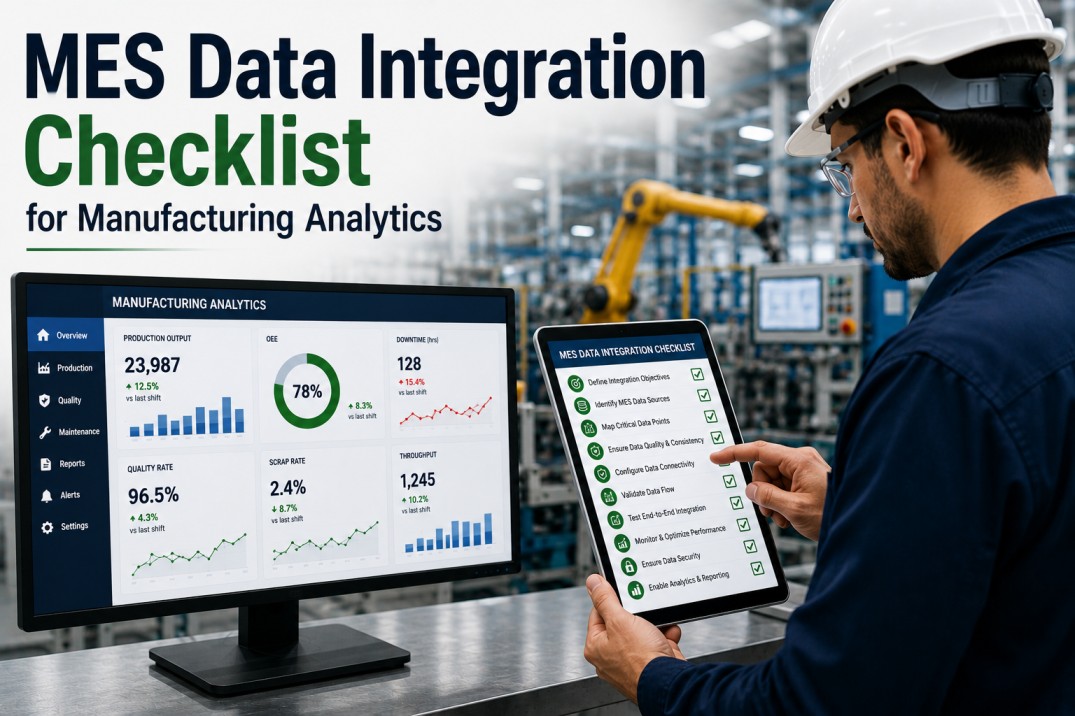
Plug Into Your MES Without Replacing It
iFactory connects directly to your MES database — extracting production orders, machine states, quality results, and traceability data into a unified analytics platform. No MES replacement, no custom integration projects, no disruption to plant-floor execution. See it in action in a 30-minute demo.
MES vs Manufacturing Analytics: Three Operating Models
Manufacturing organisations typically operate one of three models: pure MES for execution with embedded standard reports, a standalone analytics platform layered on top of MES and other plant-floor systems, or an integrated MES+Analytics approach where both layers share a common data model and governance framework. Each model serves a different strategic intent — execution control, analytical insight, or unified decision intelligence. The three cards below compare the defining characteristics of each approach.
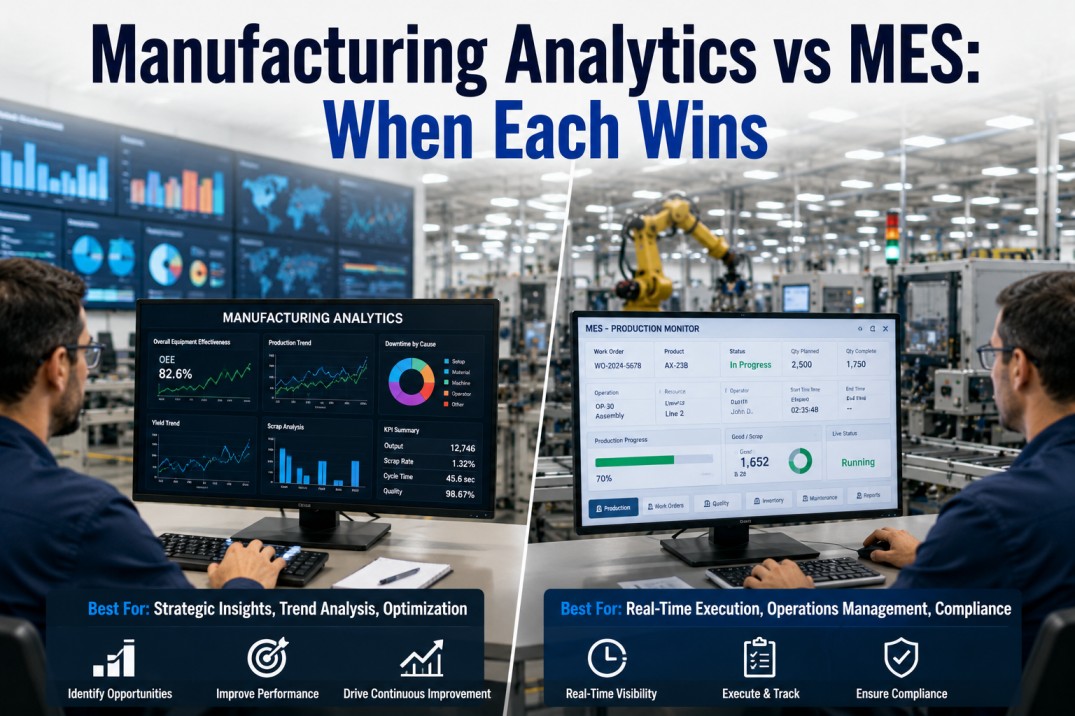
MES vs Analytics: Functional Comparison
MES and analytics platforms serve fundamentally different roles in the manufacturing technology stack. MES is the system of execution — it creates, tracks, and stores transactional production records. Analytics is the system of insight — it ingests, models, and visualises data from MES and other sources for decision support. The scrollable table below compares twelve functional dimensions, with the primary owner highlighted for each.
| Criteria | MES | Manufacturing Analytics |
|---|---|---|
| Primary purpose | Execute & track production | ● Analyse & improve performance |
| Data generation | ● Creates transactional records | Ingests & models existing data |
| User interface | Form-based, task-oriented UI | ● Visual, dashboard-oriented UI |
| Report flexibility | Pre-built, parameter-driven | ● Ad-hoc, fully customisable |
| Data scope | Within MES modules | ● MES + ERP + SCADA + IoT + CMMS |
| Time horizon | Real-time / shift-level | ● Historical + real-time + predictive |
| Analytics depth | Basic counts & summaries | ● Statistical, ML, what-if, trend |
| Schema structure | Fixed transactional schema | ● Flexible analytical schema |
| Governance | Role-based within MES | ● Cross-source stewardship |
| Integration effort | ● None (native) | Requires data pipeline |
| User self-service | Limited — IT-dependent | ● Strong — business analyst ready |
| Deployment model | On-premise / edge | ● Cloud / hybrid / edge |
Compare Systems
MES vs Analytics: Which Do You Need More?
Not every plant needs both immediately. A simple line with standard products may thrive on MES-only reporting. A multi-line plant with diverse data sources and a growing BI demand likely needs both. iFactory helps you assess your current reporting maturity and design the right MES+Analytics architecture for your operations.
MES vs Analytics: Layered Architecture
The architecture diagram below shows how MES and analytics coexist in a modern manufacturing IT stack. The plant floor generates data through PLCs, SCADA, manual entry, and IoT devices. That data flows into the MES layer for execution tracking and into the analytics layer for insight generation. The iFactory Integration Bridge connects both layers bidirectionally, ensuring that dashboards reflect live MES data and that users can drill through from any KPI to the underlying MES transaction.
When to Choose MES vs Analytics: Decision Framework
Six common manufacturing scenarios mapped to the right system choice. Use this IF-THEN decision framework to determine whether MES, manufacturing analytics, or an integrated approach is the right fit for each operational need. In practice, most plants need both — the question is which to lead with and how to connect them.
Bridge the Gap
Stop Exporting MES Data — Connect It Directly to Analytics
The most costly reporting workflow in manufacturing is "export from MES, merge in Excel, present in PowerPoint." iFactory automates this by connecting MES data directly to analytics dashboards — no exports, no manual prep, no stale data. Your MES keeps executing; iFactory keeps analysing.
Data Ownership: MES vs Analytics
Understanding which system owns or processes each type of manufacturing data is critical for designing integration architecture and governance models. The matrix below maps twelve common data categories to their primary owner — MES (execution/transaction origin), Analytics (insight/aggregation destination), or Both (shared governance). Use this reference when planning your MES-to-analytics data pipeline.
| Data Type | MES | Analytics | Primary Steward |
|---|---|---|---|
| Production orders & routing | ● Owned | ● Owned | Both |
| Machine state & cycle times | ● Owned | ● Owned | Both |
| OEE calculations | — | ● Owned | Ana |
| Quality inspection results | ● Owned | ● Owned | Both |
| Scrap & rework records | ● Owned | ● Owned | Both |
| Downtime reasons & categories | ● Owned | ● Owned | Both |
| Energy consumption data | — | ● Owned | Ana |
| SPC / CpK trend analysis | — | ● Owned | Ana |
| Cross-plant benchmark KPIs | — | ● Owned | Ana |
| Predictive maintenance signals | — | ● Owned | Ana |
| Compliance lot genealogy | ● Owned | — | Mes |
| Workforce labour tracking | ● Owned | — | Mes |
MES + Analytics Maturity Tiers
Plants evolve through three distinct tiers of MES-analytics integration, starting from MES-only reporting to a fully unified platform. Each tier represents a step change in analytical capability, data governance, and user self-service. Understanding your current tier — and the capabilities of the next level — helps prioritise investments in analytics infrastructure, data pipeline engineering, and team skills.
Deploy Today
Unified MES + Analytics — Execution and Insight in One View
Stop choosing between MES execution control and analytics-driven insight. iFactory gives you both: MES data flows in real time into analytics dashboards, and users drill through from any KPI to the underlying MES transaction. One connected platform, one source of truth. Start with a single plant.
Frequently Asked Questions
What is the difference between MES and manufacturing analytics?
MES (Manufacturing Execution System) is a real-time system that tracks, manages, and records production execution — work orders, routing, data collection, traceability, and standard reporting. Its primary purpose is operational control. Manufacturing analytics is a separate platform that aggregates data from MES and other sources (ERP, SCADA, quality, energy, maintenance) to provide cross-source dashboards, ad-hoc analysis, predictive models, and self-service reporting. Its primary purpose is decision support. MES executes the work; analytics helps understand how well it was done.
Can analytics replace the reporting in my MES?
No. MES reports serve a unique purpose — they provide the real-time, transaction-level detail that operators and supervisors need to execute the current shift. Analytics platforms supplement, not replace, MES reporting by providing historical trends, cross-source correlations, and self-service dashboards that MES cannot deliver. The best architecture is an integrated one where MES handles execution reporting and analytics handles decision-support reporting, with a data bridge ensuring consistency between the two.
Do I need both MES and a separate analytics platform?
Most mid-to-large plants benefit from having both. If your plant has more than one production line, uses data from multiple systems (MES + ERP + quality + energy), or has users who export MES data to Excel for further analysis, you almost certainly need both. Small plants with a single line and simple reporting needs may manage with MES-only reporting, but they will eventually outgrow it as cross-source analysis demands increase.
How does iFactory connect to an existing MES?
iFactory connects to MES systems at the database layer — directly to the MES transactional tables, views, or API endpoints. It extracts production orders, machine states, quality results, and traceability data into its analytics platform without modifying or disrupting the MES. The connection can be real-time (CDC streaming) or batch (scheduled extracts) depending on latency requirements. iFactory does not replace the MES — it connects to and enriches it.
What data should I move from MES to analytics first?
Start with the data that drives your most-used and most-painful reports: production counts and machine states (for OEE dashboards), quality inspection results (for SPC and defect trending), and downtime reasons (for loss tree analysis). These three data categories typically deliver 80% of the analytical value and are the easiest to extract from standard MES tables. Add batch genealogy, labour tracking, and maintenance records in subsequent phases.
How often should MES data sync to the analytics platform?
Production tracking, OEE, and machine state data should sync in near-real time (every 1-5 minutes) for live dashboards on the plant floor. Quality inspection results can sync every 15-30 minutes. Shift-level summaries, labour data, and batch genealogy can sync at shift boundaries or daily. iFactory supports configurable sync cadences per data category so you can balance freshness with pipeline cost.
Start Today
From MES Data to Actionable Insights — Without the IT Backlog
Whether your plant runs Siemens Opcenter, Rockwell FTPS, Apriso, or a custom MES — iFactory connects to your data layer and delivers analytics dashboards in days, not months. No more waiting for IT to build custom MES reports. No more Excel-based analysis. Book a 30-minute demo to see it on your data.